Climate Change - The Scientific Debate
Discussion


Facefirst said:
Every time you post this TB, I urge you to do a search 'turbobloke' + 'visible causal signal' - you might be surprised with the results. I for one would be careful about calling out attrition loops from that position. 
To your substantive point - I and others have answered this question many times. You not accepting the answers is very different from there not being answers.
It would be an attrition loop if you ever provided that visible causal signal. As you haven't it isn't.To your substantive point - I and others have answered this question many times. You not accepting the answers is very different from there not being answers.
Phil1 said:
It would be an attrition loop if you ever provided that visible causal signal. As you haven't it isn't.
And I have explained - and so have others - that it is a misleading rhetoric device and a poor one at that. The question is simple, the answer complicated.I think that there are several visible signals in the data:
1. A narrowing trend in diurnal temperature.
2. A warming troposphere combined with a cooling stratosphere.
3. An increase in downward radiation and a decrease in outgoing longwave radiation at the wavelenghts that CO2 absorbs radiation.
Other signals require more abstraction, but the above observations are consistent with an enhanced greenhouse effect and NOT consistent with other theories of climate forcing.
I predict, however, that this isn't the last we've heard on this particular attrition loop...
Facefirst said:
And a cooling stratosphere?
I thought you were looking to explain a human warming signal indistinguishable from zero, not stratospheric cooling 
Ozone depletion is implicated in stratospheric cooling. Ozone depletion that follows solar UV variation which is orders of magnitude greater than TSI variation. And before advocacy blog content is raised concerning cooling at different altitudes within a cherry pick ending around 1995, with ozone being found typically 30km to 50km up not only has there been cooling throughout this range in the recent past, it has flattened off over the last fifteen years rather than increased in rate which would be expected as carbon dioxide levels have increased.
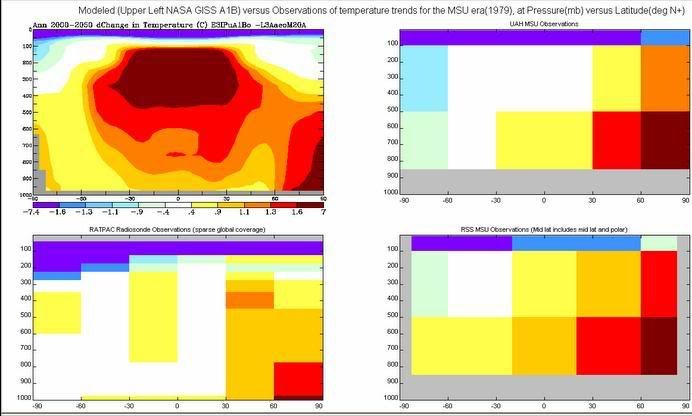
Climate models also typically get the amount of stratospheric cooling wrong. Note the model blue (model is top left) compared to real world stratospheric cooling (blue in the others). Note also the sources within the graphic.
Like the IPCC we're still all waiting for a visible causal signal from anthropogenic carbon dioxide, model gigo not included.
Facefirst said:
Phil1 said:
It would be an attrition loop if you ever provided that visible causal signal. As you haven't it isn't.
And I have explained - and so have others - that it is a misleading rhetoric device and a poor one at that. The question is simple, the answer complicated.I think that there are several visible signals in the data:
1. A narrowing trend in diurnal temperature.
2. A warming troposphere combined with a cooling stratosphere.
3. An increase in downward radiation and a decrease in outgoing longwave radiation at the wavelenghts that CO2 absorbs radiation.
Other signals require more abstraction, but the above observations are consistent with an enhanced greenhouse effect and NOT consistent with other theories of climate forcing.
I predict, however, that this isn't the last we've heard on this particular attrition loop...
FF, bring something NEW to the table, not yesterday's s
 t presented in a different way.
Seeing as you agree the models have failed, on what basis does the theory (and it is obviously no more than that) of MMGW base itself?
Remember, Man Made, causality, and actually happening...
turbobloke said:
I thought you were looking to explain a human warming signal indistinguishable from zero, not stratospheric cooling
Ozone depletion is implicated in stratospheric cooling. Ozone depletion that follows solar UV variation which is orders of magnitude greater than TSI variation. And before advocacy blog content is raised concerning cooling at different altitudes within a cherry pick ending around 1995, with ozone being found typically 30km to 50km up not only has there been cooling throughout this range in the recent past, it has flattened off over the last fifteen years rather than increased in rate which would be expected as carbon dioxide levels have increased.
The impact of decreasing ozone on cooling is implicated at around 20km, not the 30km to 50km that you state. In fact, the paper by Ramaswamy el al 2001 makes this explicit point, also adding that from 40 - 50 km, CO2 leads to the highest cooling. So, what are the trends for the various altitudes?Ozone depletion is implicated in stratospheric cooling. Ozone depletion that follows solar UV variation which is orders of magnitude greater than TSI variation. And before advocacy blog content is raised concerning cooling at different altitudes within a cherry pick ending around 1995, with ozone being found typically 30km to 50km up not only has there been cooling throughout this range in the recent past, it has flattened off over the last fifteen years rather than increased in rate which would be expected as carbon dioxide levels have increased.
EDIT: I can't find a more up-to-date graph.
turbobloke said:
Climate models also typically get the amount of stratospheric cooling wrong. Note the model blue (model is top left) compared to real world stratospheric ooling (blue in the others). Note also the sources within the graphic.
What paper are they from?turbobloke said:
Like the IPCC we're still all waiting for a visible causal signal from anthropogenic carbon dioxide, model gigo not included.
I didn't think my prediction would come true quite so quickly.Edited by Facefirst on Friday 22 July 15:30
That is exactly the advocacy blog content I referred to, with cooling on the charts evident at all altitudes but a commentary claiming it doesn't exist. And chopped at 1995 as I described. Why did you consider it worth posting?
At least my predictions are a bit better than the climate models
At least my predictions are a bit better than the climate models
Facefirst said:
I (and others) have provided pages and pages of evidence. It is a rhetoric device in that the people advancing the question similarly refuse to accept an amalgam of evidence on the grounds that no one 'thing' 'proves' or 'disproves' AGW. The logical fallacy then follows that because there is no one 'thing' that proves AGW, then AGW is disproved.
It's a little disingenious to suggest that people don't accept certain, beyond doubt, core AGW principles. For example I have no issue with the statements: - CO2 is a GHG
- Human ecomonic activity is a net increase of CO2 in the atmosphere
- Increased GHGs in the atmosphere will increase planetary temperature
Where we all fall out is the significance and links between those primary claims. It's the 'therefore' drawn from those basic statements that drive the Models and policy that draw rightful criticism.
Areas of specific disagreement I have are:
- CO2 does not appear to have the capability of effecting such significant levels of temperature elevation at the concentrations involved.
- Evidence points to periods with different temp/CO2 links
- Evidence points to CO2 lagging temp changes
- Changes in CO2 in the atmosphere may be from human activity in part or total. We have an unclear picture of the full interactions.
Where it really breaks down for me is the urgency of dealing with the 'problem' and the effects of it. What costs more lives, warmer planet or dead global economy?
Even if AGW is true and of the scale claimed it's a better 'what if' scenario than the alternative. Particularly given the time-scales for significant change.
The climate will change slowly, the economy can be destroyed to the point of many millions dieing in decades.
Facefirst said:
When I point out that competing theories of a changing climate involve similarly complicated amalgamations of data, theory, and correlation, I am greeted in return with lots of bluster.
Bluster? I see you normally refuted with scientific evidence and then only when your 'competing theories' are only a rehashing of CO2 = BAD.Facefirst said:
Your point on modelling seems valid to a degree (pun intended), but because models aren't 100% right doesn't make them totally useless.
No but their efficacy as a planning tool and driver to global policy must be in doubt. Given the projections of doom are from models (and I accept that models are teh only way to project until we invent time travel!) we must not act hastily on them when they are shown to be, at best, inadequate.Facefirst said:
freecar said:
Just a quick drive-by point.
Facefist, if there is empirical evidence that definitely shows AGW then TB wouldn't need to keep asking for a visible human signal in the climate.
This particular attrition loop is a rhetoric device - I explained why a few pages back.Facefist, if there is empirical evidence that definitely shows AGW then TB wouldn't need to keep asking for a visible human signal in the climate.
freecar said:
This isn't there, so there is categorically NOT empirical evidence that supports AGW.
What, you mean apart from the multiple and independent global temp datasets, the loss of ice, the acidification of the oceans, a change in the energy budget, diurnal temp trend shift, increasing atmospheric CO2 concentrations, and the rising tropopause?freecar said:
It might be pedantic but what you mean is that "there is empirical evidence of a warming climate"
Sadly you still need the (faulty) models to attribute this warming to humans.
Observation doesn't prove blame.
You don't need models for any of the above. They are real-world observations and there are no competing theories that can explain them all together. Enhancing the greenhouse effect does just that.Sadly you still need the (faulty) models to attribute this warming to humans.
Observation doesn't prove blame.
Observing the climate does not prove that man is responsible, knowing the temperature does not indicate what caused the temperature increase. (if there actually is one)
You do realise that this is the entire reason for the existence of models to try to establish the A in AGW.
You cannot prove anything by just measureing how warm (or not) it is.
Asking to show that man is responsible for this is not a diversionary tactic it is the entire fundamental reason for any policy making. If man IS responsible then we MAY be able to change something. IF man is NOT responsible then we are wasting our time trying to fight it.
What you are saying is akin to saying "we all know Americans cause coastal erosion so lets kill them all" which would be good for coastal erosion were it true but what would happen is the coast would still erode and the Americans would all be dead. When I ask for proof that killing Americans will end coastal erosion you deny my request saying that asking for proof is a diversion and an attrition loop.
turbobloke said:
That is exactly the advocacy blog content I referred to, with cooling on the charts evident at all altitudes but a commentary claiming it doesn't exist. And chopped at 1995 as I described. Why did you consider it worth posting?
At least my predictions are a bit better than the climate models
At least my predictions are a bit better than the climate models

So your point has been addressed before, outside of PH?
Whodathunk it.
If you have more up-to-date graphs on upper and lower stratospheric temperature, please post them.
Thanks to this MMGW theory being accepted as fact by our Government..no by Cameron, we will see our ability to provide warmth and light diminish, just as the truth dawns about the next mini ice age.
Fact is millions will suffer and thousands will die as our winters get cooler.
So, pat yourselves on the back all you believers, your work is already making a difference.
By the way how are those ice sheets and glaciers?
Fact is millions will suffer and thousands will die as our winters get cooler.
So, pat yourselves on the back all you believers, your work is already making a difference.
By the way how are those ice sheets and glaciers?
Facefirst said:
turbobloke said:
That is exactly the advocacy blog content I referred to, with cooling on the charts evident at all altitudes but a commentary claiming it doesn't exist. And chopped at 1995 as I described. Why did you consider it worth posting?
At least my predictions are a bit better than the climate models
At least my predictions are a bit better than the climate models
So your point has been addressed before, outside of PH?
Whodathunk it.
If you have more up-to-date graphs on upper and lower stratospheric temperature, please post them.
That's how we play attrition bingo kiddies.
freecar said:
If you really believed that then you are either suffering from a deprivation of intelligent neurons or you didn't pay any attention to what you are writing.
Straight in with the adhoms, you clever clever thing you. freecar said:
Observing the climate does not prove that man is responsible, knowing the temperature does not indicate what caused the temperature increase. (if there actually is one)
Obviously, which is why you need evidence from more than once source and why no one 'signal' will ever prove anything.freecar said:
You do realise that this is the entire reason for the existence of models to try to establish the A in AGW.
You cannot prove anything by just measureing how warm (or not) it is.
No, models exist to try and better understand the role of all forcings and to see what the effects of increasing or decreasing forcings is.You cannot prove anything by just measureing how warm (or not) it is.
freecar said:
Asking to show that man is responsible for this is not a diversionary tactic it is the entire fundamental reason for any policy making. If man IS responsible then we MAY be able to change something. IF man is NOT responsible then we are wasting our time trying to fight it.
If it was the first time the question had been asked (and answered) then I'd agree. Seeing as there are literally hundreds of websites dedicated to spelling out why there is an A in AGW, it does seem rather diversionary to repeatedly ask for the whole lot to be presented again and again.freecar said:
What you are saying is akin to saying "we all know Americans cause coastal erosion so lets kill them all" which would be good for coastal erosion were it true but what would happen is the coast would still erode and the Americans would all be dead. When I ask for proof that killing Americans will end coastal erosion you deny my request saying that asking for proof is a diversion and an attrition loop.
You beat that strawman! You beat 'em good!Beyond the cherry pick
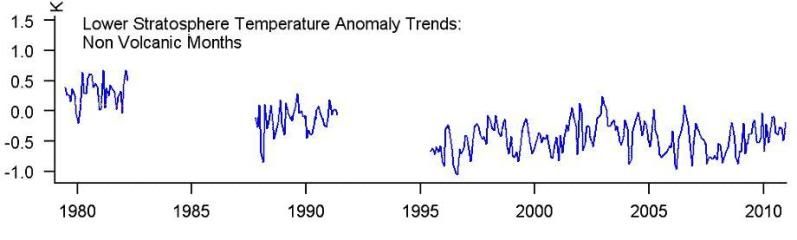
Why cooling to 1995, where the advocacy blogs tend to stop, then flat, with carbon dioxide levels increasing more and more over time?
All this within the AGW religion since adding carbon dioxide to the atmosphere now or in the last 15 years has been making next to no difference to the non-existent effect - growth of trees and crops another matter.
turbobloke said:
Beyond the cherry pick
Why cooling to 1995, where the advocacy blogs tend to stop, then flat, with carbon dioxide levels increasing more and more over time?
All this within the AGW religion since adding carbon dioxide to the atmosphere now or in the last 15 years has been making next to no difference to the non-existent effect - growth of trees and crops another matter.
OK, one more...Why cooling to 1995, where the advocacy blogs tend to stop, then flat, with carbon dioxide levels increasing more and more over time?
All this within the AGW religion since adding carbon dioxide to the atmosphere now or in the last 15 years has been making next to no difference to the non-existent effect - growth of trees and crops another matter.
There is no source with your graph (as requested), and it tells us little because it doesn't specify altitude (as requested) - just lower stratosphere, nor does it show upper stratosphere where CO2 cooling is expected to be dominant. What that graph appears to show is that ozone cooling shows no trend (or a weak cooling trend if you squint), which is not consistent with the idea that ozone is depleting.
This would fit neatly with the evidence suggesting a relatively static solar forcing background to current warming.
Weren't you heading off for a cup of tea?
Your (and kerplunk's) repeated requests for sources reflect a lack of any substantive response.
That data, apart from being in my files, is all over the internet, go look-see! You'll even find the origin.
Requests for sources, coming from a source which sees this (below)...
http://skeptico.blogs.com/.a/6a00d83451df0c69e2011...
... as somehow more worthy is ironic in the extreme, not least as the same google search that leads to such advocacy blog content will lead to sources of data such as that which I posted.
Yesterday you had 20+ peer reviewed scientific papers to chew over. How are you getting on?
Your (and kerplunk's) repeated requests for sources reflect a lack of any substantive response.
That data, apart from being in my files, is all over the internet, go look-see! You'll even find the origin.
Requests for sources, coming from a source
which sees this (below)...http://skeptico.blogs.com/.a/6a00d83451df0c69e2011...
... as somehow more worthy is ironic in the extreme, not least as the same google search that leads to such advocacy blog content will lead to sources of data such as that which I posted.
Yesterday you had 20+ peer reviewed scientific papers to chew over. How are you getting on?
turbobloke said:
Weren't you heading off for a cup of tea?
A beer acutally, but yes...turbobloke said:
Your (and kerplunk's) repeated requests for sources reflect a lack of any substantive response.
No, it was a specific request from the moderators. It also lets people see the discussion surrounding them.turbobloke said:
That data, apart from being in my files, is all over the internet, go look-see!
Then it should be no problem for you to post it with your graphs.turbobloke said:
Requests for sources, coming from a source which sees this (below)...
http://skeptico.blogs.com/.a/6a00d83451df0c69e2011...
... is ironic in the extreme, not least as the same google search that leads to such advocacy blog content will lead to sources of data such as that which I posted.
And in the very sentence before posting that graph I gave the original source. which sees this (below)...http://skeptico.blogs.com/.a/6a00d83451df0c69e2011...
... is ironic in the extreme, not least as the same google search that leads to such advocacy blog content will lead to sources of data such as that which I posted.
turbobloke said:
Yesterday you had 20+ peer reviewed scientific papers to chew over. How are you getting on?
I'm getting on fine TB, thanks for asking. Gassing Station | Science! | Top of Page | What's New | My Stuff