Climate Change - The Scientific Debate (Vol. II)
Discussion


Diderot said:
durbster said:
Diderot said:
kerplunk said:
As above - I see consistant trends and that improved coverage doesn't change the overall picture much.
Claims that 1850 sampling make declarations of warmest on record since 1850 dodgy are not supported
You are Aesop aicmfp. Either him or one of the brothers Grimm. Or any other fiction author. Claims that 1850 sampling make declarations of warmest on record since 1850 dodgy are not supported
‘Much’ is in reality how ‘much’? Give me precise figs. Give me actual data and figs (ahh, there is none). I’m not a fan of figs but we have a couple of fig trees in our garden on the south coast. Mrs Diderot harvests them. ‘It’s an index of global boiling.
Your ‘improved coverage’ is the most ridiculous statement to ever plop out of your mouth when the reality is most of the global land mass in 1880 had no stations whatever. None. Nada. Zilch. 1850 was, of course, worse. Explain ‘improved’. Do you actually understand how big Africa, South America, Russia, Australia, Canada, and the Arctic is? Do you understand how varied their respective climates are? It would not appear so. You seem prepared to just guess what the average temperature was for most of the global land mass in the 19th century when most of the global land mass had no stations.
Then you go on to cite some random individual on t
 tter as if he is the arbiter of the truth.
 So far, the sum of your argument is you chanting "there's not enough data," over and over again. You've been given every opportunity to explain why you claim this, and you've offered nothing. It's your belief, and that's that. Just repeat the mantra.
People have even given you instructions on how you could prove what you say, if it were correct. You ignored them, and instead simply repeated the mantra.
You've been given evidence against your point, and refused to engage with a single element of it (I suspect because you haven't a clue what any of it means). Instead, here you are again, repeating the mantra.
At what point are you going to realise this is all way beyond your grasp and move on?

Diderot said:
It’s my belief there is not enough data? There’s no belief involved - look at the global distribution of weather stations in 1880.
Just to try and explain to you in simple terms for you: yes, you believe there is not enough data to establish a trend. What has been shown to you in numerous ways is that what you believe is not actually correct. Your belief is based on your ignorance, and your refusal to learn anything that might upset that belief, because faith in an ideology is more important to you than truth.
durbster said:
Diderot said:
It’s my belief there is not enough data? There’s no belief involved - look at the global distribution of weather stations in 1880.
Just to try and explain to you in simple terms for you: yes, you believe there is not enough data to establish a trend. What has been shown to you in numerous ways is that what you believe is not actually correct. Your belief is based on your ignorance, and your refusal to learn anything that might upset that belief, because faith in an ideology is more important to you than truth.
There is no mention of a trend, instead an explicit average temperature is stated to two decimal places. That number is an estimate mise en abîme. There is no actual data from most of the global land mass to support it across the 1850-1900 average they are using. That is a simple enough concept for you to grasp isn’t it?
Diderot said:
The claim is last year was the hottest since records began in 1850 - NOAA explicitly states: ‘ The 10 warmest years since 1850 have all occurred in the past decade. In fact, the average global temperature for 2023 exceeded the pre-industrial (1850–1900) average by 2.43 degrees F (1.35 degrees C).’
There is no mention of a trend, instead an explicit average temperature is stated to two decimal places. That number is an estimate mise en abîme. There is no actual data from most of the global land mass to support it across the 1850-1900 average they are using. That is a simple enough concept for you to grasp isn’t it?
What about the claims of the Roman Warm Period being "at least 2 degrees warmer" than today. Do you place any stock in those? There is no mention of a trend, instead an explicit average temperature is stated to two decimal places. That number is an estimate mise en abîme. There is no actual data from most of the global land mass to support it across the 1850-1900 average they are using. That is a simple enough concept for you to grasp isn’t it?
If you do, then how does the sampling compare to the 1850-1900 time period.
If not, then why don't you repeatedly tell the posters of such claims that they are mistaken?
Thanks.
Diderot said:
You are Aesop aicmfp. Either him or one of the brothers Grimm. Or any other fiction author.
‘Much’ is in reality how ‘much’? Give me precise figs. Give me actual data and figs (ahh, there is none). I’m not a fan of figs but we have a couple of fig trees in our garden on the south coast. Mrs Diderot harvests them. ‘It’s an index of global boiling.
Your ‘improved coverage’ is the most ridiculous statement to ever plop out of your mouth when the reality is most of the global land mass in 1880 had no stations whatever. None. Nada. Zilch. 1850 was, of course, worse. Explain ‘improved’. Do you actually understand how big Africa, South America, Russia, Australia, Canada, and the Arctic is? Do you understand how varied their respective climates are? It would not appear so. You seem prepared to just guess what the average temperature was for most of the global land mass in the 19th century when most of the global land mass had no stations.
Then you go on to cite some random individual on ttter as if he is the arbiter of the truth.
"Explain improved" - so you need that explaining. Ok‘Much’ is in reality how ‘much’? Give me precise figs. Give me actual data and figs (ahh, there is none). I’m not a fan of figs but we have a couple of fig trees in our garden on the south coast. Mrs Diderot harvests them. ‘It’s an index of global boiling.
Your ‘improved coverage’ is the most ridiculous statement to ever plop out of your mouth when the reality is most of the global land mass in 1880 had no stations whatever. None. Nada. Zilch. 1850 was, of course, worse. Explain ‘improved’. Do you actually understand how big Africa, South America, Russia, Australia, Canada, and the Arctic is? Do you understand how varied their respective climates are? It would not appear so. You seem prepared to just guess what the average temperature was for most of the global land mass in the 19th century when most of the global land mass had no stations.
Then you go on to cite some random individual on t
tter as if he is the arbiter of the truth. The graph is a comparison of the results of using the lowest 1850 global land sampling throughout the whole period (up to about 2018) with the increasingly better over time sampling in the nasa-giss land record.
"You seem prepared to just guess what the average temperature was for most of the global land mass in the 19th century when most of the global land mass had no stations"
It's not about me. Beyond the interpolating of station data to a certain distance there is no 'guessing' of global av temps. Nasa-giss interpolate station data to a 1200km radius. Area not within 1200km of a station is left blank.
Here is the 1880 global land picture with 1200km smoothing:
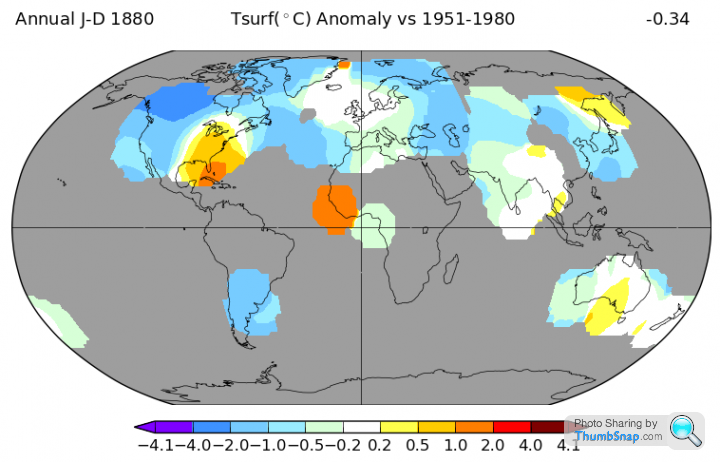
You could however say that leaving areas blank has the same effect as assigning the global av land anomaly (-0.34 in 1880) to those areas. Not much you can do about that. It's not a choice or a guess - it's a consequence
(edit - oops uploaded the wrong map)
Edited by kerplunk on Sunday 28th January 14:49
Isotopologue said:
Diderot said:
The claim is last year was the hottest since records began in 1850 - NOAA explicitly states: ‘ The 10 warmest years since 1850 have all occurred in the past decade. In fact, the average global temperature for 2023 exceeded the pre-industrial (1850–1900) average by 2.43 degrees F (1.35 degrees C).’
There is no mention of a trend, instead an explicit average temperature is stated to two decimal places. That number is an estimate mise en abîme. There is no actual data from most of the global land mass to support it across the 1850-1900 average they are using. That is a simple enough concept for you to grasp isn’t it?
What about the claims of the Roman Warm Period being "at least 2 degrees warmer" than today. Do you place any stock in those? There is no mention of a trend, instead an explicit average temperature is stated to two decimal places. That number is an estimate mise en abîme. There is no actual data from most of the global land mass to support it across the 1850-1900 average they are using. That is a simple enough concept for you to grasp isn’t it?
If you do, then how does the sampling compare to the 1850-1900 time period.
If not, then why don't you repeatedly tell the posters of such claims that they are mistaken?
Thanks.
His reference was Encyplopedia Brittanica's mention of Hubert Lamb's 1965 work which was for Europe only

Isotopologue said:
Diderot said:
The claim is last year was the hottest since records began in 1850 - NOAA explicitly states: ‘ The 10 warmest years since 1850 have all occurred in the past decade. In fact, the average global temperature for 2023 exceeded the pre-industrial (1850–1900) average by 2.43 degrees F (1.35 degrees C).’
There is no mention of a trend, instead an explicit average temperature is stated to two decimal places. That number is an estimate mise en abîme. There is no actual data from most of the global land mass to support it across the 1850-1900 average they are using. That is a simple enough concept for you to grasp isn’t it?
What about the claims of the Roman Warm Period being "at least 2 degrees warmer" than today. Do you place any stock in those? There is no mention of a trend, instead an explicit average temperature is stated to two decimal places. That number is an estimate mise en abîme. There is no actual data from most of the global land mass to support it across the 1850-1900 average they are using. That is a simple enough concept for you to grasp isn’t it?
If you do, then how does the sampling compare to the 1850-1900 time period.
If not, then why don't you repeatedly tell the posters of such claims that they are mistaken?
Thanks.
Diderot said:
The claim is last year was the hottest since records began in 1850 - NOAA explicitly states: ‘ The 10 warmest years since 1850 have all occurred in the past decade. In fact, the average global temperature for 2023 exceeded the pre-industrial (1850–1900) average by 2.43 degrees F (1.35 degrees C).’
Which is accurate reporting of what the record shows. What do you expect them to say? Perhaps could use some error bars - could have been more/could have been less.Diderot said:
There is no mention of a trend, instead an explicit average temperature is stated to two decimal places. That number is an estimate mise en abîme. There is no actual data from most of the global land mass to support it across the 1850-1900 average they are using. That is a simple enough concept for you to grasp isn’t it?
You mean there is no mention of a trend in that sentence, which is from a NOAA page which does discuss decadal trends, has time series graphs etc (duh). That you've found a sentence that doesn't mention the +/- uncertainty and then from that portrayed the accuracy is to 2 decimal places is rather dull of you.Isotopologue said:
Diderot said:
What about the claims of the Roman Warm Period being "at least 2 degrees warmer" than today. Do you place any stock in those?
If you do, then how does the sampling compare to the 1850-1900 time period.
If not, then why don't you repeatedly tell the posters of such claims that they are mistaken?
Thanks.
What about those claims? They are an estimate, usually prefaced by ‘about’, ‘around or ‘circa’, not expressed to two decimal places as if the estimate mise en abîme is derived from actual data. Beyond that difference, the most significant one is that we are not basing absurd policies which will cost us £ trillions to implement, and lead inexorably to reduced standards of living, on such estimations. If you do, then how does the sampling compare to the 1850-1900 time period.
If not, then why don't you repeatedly tell the posters of such claims that they are mistaken?
Thanks.

Edited by kerplunk on Sunday 28th January 19:39
Diderot said:
durbster said:
Diderot said:
It’s my belief there is not enough data? There’s no belief involved - look at the global distribution of weather stations in 1880.
Just to try and explain to you in simple terms for you: yes, you believe there is not enough data to establish a trend. What has been shown to you in numerous ways is that what you believe is not actually correct. Your belief is based on your ignorance, and your refusal to learn anything that might upset that belief, because faith in an ideology is more important to you than truth.
There is no mention of a trend, instead an explicit average temperature is stated to two decimal places. That number is an estimate mise en abîme. There is no actual data from most of the global land mass to support it across the 1850-1900 average they are using. That is a simple enough concept for you to grasp isn’t it?
We know that 2023 was the hottest on record. That is not in dispute.
The hottest year on record, in itself, doesn't mean much. Even if there were no global warming, we would have had some years that were hotter than others, and the hot and cold record years would occasionally be broken with decreasing frequency.
However, you keep referring to the cost of tackling climate change. The motivation to tackle climate change is not about records, it's about the long term trend. The hottest year record repeatedly being broken is merely the obvious side-effect of a warming planet, and evidence that the warming trend is real.
That means your only contention can be the validity of the record itself. Your claim is the temperature record is meaningless because you imagine there is missing data that would somehow totally change the picture and show that there is no warming (and therefore not need to spend money tackling it).
As has been illustrated to you, with pictures and everything, that claim doesn't make sense, isn't supported by any evidence or the data, and is highly implausible in any case.
kerplunk said:
Diderot said:
You are Aesop aicmfp. Either him or one of the brothers Grimm. Or any other fiction author.
‘Much’ is in reality how ‘much’? Give me precise figs. Give me actual data and figs (ahh, there is none). I’m not a fan of figs but we have a couple of fig trees in our garden on the south coast. Mrs Diderot harvests them. ‘It’s an index of global boiling.
Your ‘improved coverage’ is the most ridiculous statement to ever plop out of your mouth when the reality is most of the global land mass in 1880 had no stations whatever. None. Nada. Zilch. 1850 was, of course, worse. Explain ‘improved’. Do you actually understand how big Africa, South America, Russia, Australia, Canada, and the Arctic is? Do you understand how varied their respective climates are? It would not appear so. You seem prepared to just guess what the average temperature was for most of the global land mass in the 19th century when most of the global land mass had no stations.
Then you go on to cite some random individual on ttter as if he is the arbiter of the truth.
"Explain improved" - so you need that explaining. Ok‘Much’ is in reality how ‘much’? Give me precise figs. Give me actual data and figs (ahh, there is none). I’m not a fan of figs but we have a couple of fig trees in our garden on the south coast. Mrs Diderot harvests them. ‘It’s an index of global boiling.
Your ‘improved coverage’ is the most ridiculous statement to ever plop out of your mouth when the reality is most of the global land mass in 1880 had no stations whatever. None. Nada. Zilch. 1850 was, of course, worse. Explain ‘improved’. Do you actually understand how big Africa, South America, Russia, Australia, Canada, and the Arctic is? Do you understand how varied their respective climates are? It would not appear so. You seem prepared to just guess what the average temperature was for most of the global land mass in the 19th century when most of the global land mass had no stations.
Then you go on to cite some random individual on t
tter as if he is the arbiter of the truth. The graph is a comparison of the results of using the lowest 1850 global land sampling throughout the whole period (up to about 2018) with the increasingly better over time sampling in the nasa-giss land record.
"You seem prepared to just guess what the average temperature was for most of the global land mass in the 19th century when most of the global land mass had no stations"
It's not about me. Beyond the interpolating of station data to a certain distance there is no 'guessing' of global av temps. Nasa-giss interpolate station data to a 1200km radius. Area not within 1200km of a station is left blank.
Here is the 1880 global land picture with 1200km smoothing:
You could however say that leaving areas blank has the same effect as assigning the global av land anomaly (-0.34 in 1880) to those areas. Not much you can do about that. It's not a choice or a guess - it's a consequence
(edit - oops uploaded the wrong map)
Edited by kerplunk on Sunday 28th January 14:49
And 1200kms is a rather large area to ‘smooth’ wouldn’t you say? It would, for example, encompass the entire mainland of the UK and Ireland. Of course, there’s no difference between the climate in Cornwall and the Cairngorms, for example, is there? (Rhetorical question).
That vast swathes of the planet’s land mass are still left ‘blank’ is rather telling too. You may suggest that ‘ leaving areas blank has the same effect as assigning the global av land anomaly (-0.34 in 1880) to those areas. Not much you can do about that. It's not a choice or a guess - it's a consequence’. Yes it’s a consequence of having no data, and however you choose to makes excuses for that fact, it’s merely another unsatisfactory estimation. Its estimation mise en abîme. As such, the suggestion that we can proclaim, with a straight face, that the hottest evah year since records began in 1850 was precisely 1.35c warmer than the 1850-1900 average is simply dishonest. It’s fictional nonsense whichever way you look at it.
Diderot said:
kerplunk said:
Diderot said:
You are Aesop aicmfp. Either him or one of the brothers Grimm. Or any other fiction author.
‘Much’ is in reality how ‘much’? Give me precise figs. Give me actual data and figs (ahh, there is none). I’m not a fan of figs but we have a couple of fig trees in our garden on the south coast. Mrs Diderot harvests them. ‘It’s an index of global boiling.
Your ‘improved coverage’ is the most ridiculous statement to ever plop out of your mouth when the reality is most of the global land mass in 1880 had no stations whatever. None. Nada. Zilch. 1850 was, of course, worse. Explain ‘improved’. Do you actually understand how big Africa, South America, Russia, Australia, Canada, and the Arctic is? Do you understand how varied their respective climates are? It would not appear so. You seem prepared to just guess what the average temperature was for most of the global land mass in the 19th century when most of the global land mass had no stations.
Then you go on to cite some random individual on ttter as if he is the arbiter of the truth.
"Explain improved" - so you need that explaining. Ok‘Much’ is in reality how ‘much’? Give me precise figs. Give me actual data and figs (ahh, there is none). I’m not a fan of figs but we have a couple of fig trees in our garden on the south coast. Mrs Diderot harvests them. ‘It’s an index of global boiling.
Your ‘improved coverage’ is the most ridiculous statement to ever plop out of your mouth when the reality is most of the global land mass in 1880 had no stations whatever. None. Nada. Zilch. 1850 was, of course, worse. Explain ‘improved’. Do you actually understand how big Africa, South America, Russia, Australia, Canada, and the Arctic is? Do you understand how varied their respective climates are? It would not appear so. You seem prepared to just guess what the average temperature was for most of the global land mass in the 19th century when most of the global land mass had no stations.
Then you go on to cite some random individual on t
tter as if he is the arbiter of the truth. The graph is a comparison of the results of using the lowest 1850 global land sampling throughout the whole period (up to about 2018) with the increasingly better over time sampling in the nasa-giss land record.
"You seem prepared to just guess what the average temperature was for most of the global land mass in the 19th century when most of the global land mass had no stations"
It's not about me. Beyond the interpolating of station data to a certain distance there is no 'guessing' of global av temps. Nasa-giss interpolate station data to a 1200km radius. Area not within 1200km of a station is left blank.
Here is the 1880 global land picture with 1200km smoothing:
You could however say that leaving areas blank has the same effect as assigning the global av land anomaly (-0.34 in 1880) to those areas. Not much you can do about that. It's not a choice or a guess - it's a consequence
(edit - oops uploaded the wrong map)
Edited by kerplunk on Sunday 28th January 14:49
Diderot said:
And 1200kms is a rather large area to ‘smooth’ wouldn’t you say? It would, for example, encompass the entire mainland of the UK and Ireland. Of course, there’s no difference between the climate in Cornwall and the Cairngorms, for example, is there? (Rhetorical question).
Never mind Cornwall, the climate at the top of a Cairngorn mountain is quite different to down in the valley. But I'm afraid your rhetorical question makes you look like a noob. The smoothing doesn't assume the same absolute temperature over that distance - it assumes the same temperature *anomaly* - the variation from the average temperature for that locationThat's not to say the smoothing is always an accurate reflection of reality. That's not likely. But it likely has been tested and the error margin quantified.
Diderot said:
That vast swathes of the planet’s land mass are still left ‘blank’ is rather telling too. You may suggest that ‘ leaving areas blank has the same effect as assigning the global av land anomaly (-0.34 in 1880) to those areas. Not much you can do about that. It's not a choice or a guess - it's a consequence’. Yes it’s a consequence of having no data, and however you choose to makes excuses for that fact, it’s merely another unsatisfactory estimation. Its estimation mise en abîme. As such, the suggestion that we can proclaim, with a straight face, that the hottest evah year since records began in 1850 was precisely 1.35c warmer than the 1850-1900 average is simply dishonest. It’s fictional nonsense whichever way you look at it.
Not much hereAs said, it's an estimate - if error bars unstated could fool a noob about the precision. Agreed already
Edited by kerplunk on Monday 29th January 00:20
Diderot said:
What about those claims? They are an estimate, usually prefaced by ‘about’, ‘around or ‘circa’, not expressed to two decimal places as if the estimate mise en abîme is derived from actual data. Beyond that difference, the most significant one is that we are not basing absurd policies which will cost us £ trillions to implement, and lead inexorably to reduced standards of living, on such estimations.
Surely the past temperatures of time periods such as the Roman Warm Period are used to derive understanding if how climate has varied in the past and therefore whether current trends are something to worry about or not?It's not clear to me what you mean by "as if the estimate mise en abîme is derived from actual data" are you saying that people who claim the Roman Warm Period was at least two degrees warmer than the present aren't deriving that estimate from data because they've only reported a round number?
I'm sure you spent a while asking repeatedly for error bars on a plot that had error bars shown. Those error bars were larger further back in time. So any estimates of temperature further back in time are known to be more uncertain.
kerplunk said:
Diderot said:
kerplunk said:
Diderot said:
You are Aesop aicmfp. Either him or one of the brothers Grimm. Or any other fiction author.
‘Much’ is in reality how ‘much’? Give me precise figs. Give me actual data and figs (ahh, there is none). I’m not a fan of figs but we have a couple of fig trees in our garden on the south coast. Mrs Diderot harvests them. ‘It’s an index of global boiling.
Your ‘improved coverage’ is the most ridiculous statement to ever plop out of your mouth when the reality is most of the global land mass in 1880 had no stations whatever. None. Nada. Zilch. 1850 was, of course, worse. Explain ‘improved’. Do you actually understand how big Africa, South America, Russia, Australia, Canada, and the Arctic is? Do you understand how varied their respective climates are? It would not appear so. You seem prepared to just guess what the average temperature was for most of the global land mass in the 19th century when most of the global land mass had no stations.
Then you go on to cite some random individual on ttter as if he is the arbiter of the truth.
"Explain improved" - so you need that explaining. Ok‘Much’ is in reality how ‘much’? Give me precise figs. Give me actual data and figs (ahh, there is none). I’m not a fan of figs but we have a couple of fig trees in our garden on the south coast. Mrs Diderot harvests them. ‘It’s an index of global boiling.
Your ‘improved coverage’ is the most ridiculous statement to ever plop out of your mouth when the reality is most of the global land mass in 1880 had no stations whatever. None. Nada. Zilch. 1850 was, of course, worse. Explain ‘improved’. Do you actually understand how big Africa, South America, Russia, Australia, Canada, and the Arctic is? Do you understand how varied their respective climates are? It would not appear so. You seem prepared to just guess what the average temperature was for most of the global land mass in the 19th century when most of the global land mass had no stations.
Then you go on to cite some random individual on t
tter as if he is the arbiter of the truth. The graph is a comparison of the results of using the lowest 1850 global land sampling throughout the whole period (up to about 2018) with the increasingly better over time sampling in the nasa-giss land record.
"You seem prepared to just guess what the average temperature was for most of the global land mass in the 19th century when most of the global land mass had no stations"
It's not about me. Beyond the interpolating of station data to a certain distance there is no 'guessing' of global av temps. Nasa-giss interpolate station data to a 1200km radius. Area not within 1200km of a station is left blank.
Here is the 1880 global land picture with 1200km smoothing:
You could however say that leaving areas blank has the same effect as assigning the global av land anomaly (-0.34 in 1880) to those areas. Not much you can do about that. It's not a choice or a guess - it's a consequence
(edit - oops uploaded the wrong map)
Edited by kerplunk on Sunday 28th January 14:49
Diderot said:
And 1200kms is a rather large area to ‘smooth’ wouldn’t you say? It would, for example, encompass the entire mainland of the UK and Ireland. Of course, there’s no difference between the climate in Cornwall and the Cairngorms, for example, is there? (Rhetorical question).
Never mind Cornwall, the climate at the top of a Cairngorn mountain is quite different to down in the valley. But I'm afraid your rhetorical question makes you look like a noob. The smoothing doesn't assume the same absolute temperature over that distance - it assumes the same temperature *anomaly* - the variation from the average temperature for that locationThat's not to say the smoothing is always an accurate reflection of reality. That's not likely. But it likely has been tested and the error margin quantified.
Diderot said:
That vast swathes of the planet’s land mass are still left ‘blank’ is rather telling too. You may suggest that ‘ leaving areas blank has the same effect as assigning the global av land anomaly (-0.34 in 1880) to those areas. Not much you can do about that. It's not a choice or a guess - it's a consequence’. Yes it’s a consequence of having no data, and however you choose to makes excuses for that fact, it’s merely another unsatisfactory estimation. Its estimation mise en abîme. As such, the suggestion that we can proclaim, with a straight face, that the hottest evah year since records began in 1850 was precisely 1.35c warmer than the 1850-1900 average is simply dishonest. It’s fictional nonsense whichever way you look at it.
Not much hereAs said, it's an estimate - if error bars unstated could fool a noob about the precision. Agreed already
Edited by kerplunk on Monday 29th January 00:20
ks for obvious reasons).I know that smoothing refers to anomalies from an arbitrary baseline, but it cannot compensate adequately for the inherent lack of data from the absence of station coverage. At every level, we have estimations, layer upon layer of them.
Diderot said:
They are not presented as estimates are they? The statement referenced above by NOAA doesn't say ' we estimate that 2023 was the warmest years since records began by about 1.5 degrees C +/- 0.5 degrees C, rather it explicitly states 1.35 degrees c warmer (which is unsubstantiated bks for obvious reasons).
paste: as said, it's an estimate - if error bars unstated could fool a noob about the precision. Agreed alreadyks for obvious reasons).Diderot said:
I know that smoothing refers to anomalies from an arbitrary baseline
Well you do now anyway. You should've said so time wasterkerplunk said:
Diderot said:
They are not presented as estimates are they? The statement referenced above by NOAA doesn't say ' we estimate that 2023 was the warmest years since records began by about 1.5 degrees C +/- 0.5 degrees C, rather it explicitly states 1.35 degrees c warmer (which is unsubstantiated bks for obvious reasons).
paste: as said, it's an estimate - if error bars unstated could fool a noob about the precision. Agreed alreadyks for obvious reasons).Diderot said:
kerplunk said:
Diderot said:
They are not presented as estimates are they? The statement referenced above by NOAA doesn't say ' we estimate that 2023 was the warmest years since records began by about 1.5 degrees C +/- 0.5 degrees C, rather it explicitly states 1.35 degrees c warmer (which is unsubstantiated bks for obvious reasons).
paste: as said, it's an estimate - if error bars unstated could fool a noob about the precision. Agreed alreadyks for obvious reasons).NASA fail at it by saying "about 1.4C warmer than the late 19th-century average" in their 2023 round up.
As do Berkeley, letting the cat out of the bag by using the word 'estimated' in theirs.
Strangely, Dr Roy the lukewarmer of UAH, does the same as NOAA and fools the populace: "The 2023 annual average global LT anomaly was +0.51 deg. C above the 1991-2020 mean, easily making 2023 the warmest of the 45-year satellite record"
kerplunk said:
Diderot said:
kerplunk said:
Diderot said:
They are not presented as estimates are they? The statement referenced above by NOAA doesn't say ' we estimate that 2023 was the warmest years since records began by about 1.5 degrees C +/- 0.5 degrees C, rather it explicitly states 1.35 degrees c warmer (which is unsubstantiated bks for obvious reasons).
paste: as said, it's an estimate - if error bars unstated could fool a noob about the precision. Agreed alreadyks for obvious reasons).NASA fail at it by saying "about 1.4C warmer than the late 19th-century average" in their 2023 round up.
As do Berkeley, letting the cat out of the bag by using the word 'estimated' in theirs.
Strangely, Dr Roy the lukewarmer of UAH, does the same as NOAA and fools the populace: "The 2023 annual average global LT anomaly was +0.51 deg. C above the 1991-2020 mean, easily making 2023 the warmest of the 45-year satellite record"
The Guardian, ever the hyperbolists, proclaims: “the planet was 1.48C hotter in 2023 compared with the period before the mass burning of fossil fuels ignited the climate crisis. “.
The Times stated: ‘The World Meteorological Organisation (WMO), a specialised agency of the United Nations, said on Friday that the planet was on average 1.45C warmer than the pre-industrial period after analysing figures from the Met Office, Nasa and other organisations.’
The Telegraph suggests: “Last year was the hottest on record, climate scientists have confirmed, breaking previous highs by a significant margin in what was described as “an alarm call to everyone. The global average temperature in 2023 was 14.98C – 1.48C warmer than the 1850-1900 pre-industrial level, according to the EU’s Copernicus Climate Change Service.”
Etc.
Diderot said:
BBC claims: “Globally 2023 was the warmest year on record - at 1.48C above the pre-industrial baseline - it smashed the previous record set in 2016 by 0.17C.”
The Guardian, ever the hyperbolists, proclaims: “the planet was 1.48C hotter in 2023 compared with the period before the mass burning of fossil fuels ignited the climate crisis. “.
The Times stated: ‘The World Meteorological Organisation (WMO), a specialised agency of the United Nations, said on Friday that the planet was on average 1.45C warmer than the pre-industrial period after analysing figures from the Met Office, Nasa and other organisations.’
The Telegraph suggests: “Last year was the hottest on record, climate scientists have confirmed, breaking previous highs by a significant margin in what was described as “an alarm call to everyone. The global average temperature in 2023 was 14.98C – 1.48C warmer than the 1850-1900 pre-industrial level, according to the EU’s Copernicus Climate Change Service.”
Etc.
Science reporting in newspapers is generally poor regardless of specific topic. If you want detail, go to the published literature.The Guardian, ever the hyperbolists, proclaims: “the planet was 1.48C hotter in 2023 compared with the period before the mass burning of fossil fuels ignited the climate crisis. “.
The Times stated: ‘The World Meteorological Organisation (WMO), a specialised agency of the United Nations, said on Friday that the planet was on average 1.45C warmer than the pre-industrial period after analysing figures from the Met Office, Nasa and other organisations.’
The Telegraph suggests: “Last year was the hottest on record, climate scientists have confirmed, breaking previous highs by a significant margin in what was described as “an alarm call to everyone. The global average temperature in 2023 was 14.98C – 1.48C warmer than the 1850-1900 pre-industrial level, according to the EU’s Copernicus Climate Change Service.”
Etc.
Isotopologue said:
Diderot said:
BBC claims: “Globally 2023 was the warmest year on record - at 1.48C above the pre-industrial baseline - it smashed the previous record set in 2016 by 0.17C.”
The Guardian, ever the hyperbolists, proclaims: “the planet was 1.48C hotter in 2023 compared with the period before the mass burning of fossil fuels ignited the climate crisis. “.
The Times stated: ‘The World Meteorological Organisation (WMO), a specialised agency of the United Nations, said on Friday that the planet was on average 1.45C warmer than the pre-industrial period after analysing figures from the Met Office, Nasa and other organisations.’
The Telegraph suggests: “Last year was the hottest on record, climate scientists have confirmed, breaking previous highs by a significant margin in what was described as “an alarm call to everyone. The global average temperature in 2023 was 14.98C – 1.48C warmer than the 1850-1900 pre-industrial level, according to the EU’s Copernicus Climate Change Service.”
Etc.
Science reporting in newspapers is generally poor regardless of specific topic. If you want detail, go to the published literature.The Guardian, ever the hyperbolists, proclaims: “the planet was 1.48C hotter in 2023 compared with the period before the mass burning of fossil fuels ignited the climate crisis. “.
The Times stated: ‘The World Meteorological Organisation (WMO), a specialised agency of the United Nations, said on Friday that the planet was on average 1.45C warmer than the pre-industrial period after analysing figures from the Met Office, Nasa and other organisations.’
The Telegraph suggests: “Last year was the hottest on record, climate scientists have confirmed, breaking previous highs by a significant margin in what was described as “an alarm call to everyone. The global average temperature in 2023 was 14.98C – 1.48C warmer than the 1850-1900 pre-industrial level, according to the EU’s Copernicus Climate Change Service.”
Etc.
The point here is that the lack of transparency around the inherent uncertainty is a deliberate, systemic and systematic policy of obfuscation and deception. ‘Noobs’, as KP puts it, are simply being hoodwinked. Obviously we have strayed into politics here.
Diderot said:
Of course.
The point here is that the lack of transparency around the inherent uncertainty is a deliberate, systemic and systematic policy of obfuscation and deception. ‘Noobs’, as KP puts it, are simply being hoodwinked. Obviously we have strayed into politics here.
The trouble is that uncertainty cuts both ways. If you're happy to accept that things might be better than thought in the future because of uncertainty, you have to accept the same chance that things are even worse than thought (unless there are asymmetric uncertainties).The point here is that the lack of transparency around the inherent uncertainty is a deliberate, systemic and systematic policy of obfuscation and deception. ‘Noobs’, as KP puts it, are simply being hoodwinked. Obviously we have strayed into politics here.
Gassing Station | Science! | Top of Page | What's New | My Stuff