Car Survival Rate Analysis
Discussion


STATISTICAL ANALYSIS OF CAR SURVIVAL
This work began as a contribution to the “Everyday cars that are starting to disappear” thread, born out of frustration that, interesting though most of posts were, they were entirely subjective in nature, and a consequent desire to introduce a degree of rigour and objective measurement to the process. What was intended to be a discrete post grew to the extent that I became guilty of the heinous crime of threadjacking. I was suggested by Seek that this subject was best split out to become something that could be referenced discretely, and that I copied my posts across. My apologies for the inordinate time that it has taken me to do this, but I have become incredibly busy. In consequence, my posts are likely to become rather sporadic for at least the next two to three months: unfortunately, car statistics take second place to earning my daily crust.
I should stress at the outset that this is intended only as a thread for geeks interested in car statistics, and in detailed/lengthy analysis. As such, it will be of no interest to the majority of those on this website, so I suggest that if this is not you that you stop reading here.
This is not intended as a personal hobbyhorse, so please feel free to contribute any statistics or analysis of your own. The only thing that I would ask is that we confine this thread to car survival statistics, so if you have, for example, some fascinating analysis of car power output trends, that you start a new thread for it.
The work started off innocently enough by consulting the excellent “How Many Left” website ( https://www.howmanyleft.co.uk/), but my natural tendency to always work back towards original source data, led me to the official Government statistics on which “How Many Left” is based, this can be found at: https://www.gov.uk/government/statistical-data-sets/all-vehicles-veh01. These enable us to do some much more interesting analysis. No datasets are ever perfect; however, as with most UK Government statistics, I consider the DfT data to be of high-quality, and free from any systematic bias (the DfT state their tests indicate that approximately 2% of entries have one data field incorrectly entered). Certainly, the data is a lot better than the majority the stuff that I encounter in my day job, and requires almost no cleaning. Even better, the DfT data is available in Excel spreadsheet format, which can be imported and manipulated, readily. There are some weaknesses in the datasets, and in particular with correlating it between the different datasets required to undertake the analysis, but we will encounter these issues as we go, which are in any case fundamentally second order in nature.
While the statistics might be good, the downside of this thread will be having to put up with my idiosyncratic views (I have been accused of building an entire career based on professional cynicism). Please regard me as the ‘shock jock’ of PH, my aim is to stimulate discussion and fresh thinking: if there is one thing that I have learnt in the workplace over the past few decades it is how supposedly absolute certainties, and self-evident truths on which all else is based can be fundamentally flawed. I am here to challenge established views, and in the debate, hopefully, enlightenment for us all will appear. My commentaries are a strange conflation between the factually accurate and irrefutability impartial, and my bigoted views. I try hard to draw a stylistic distinction between the two in my writing, so hopefully the joins are clear.
In re-posting my earlier work I will updating my work to reflect the constructive comments made, this will include some changes to the cars analysed in each market segment. The principal delay in posting it will be that I have been heavily expanding and updating my work on family hatchbacks to bring it up to the standard of the other market segments analysed. In the course of this work I have found two new contenders for Britain’s worst surviving car, which are almost too close to split, and come from different continents…
As ever, there are only two types of car that are interesting: those that survive vastly better than their peers, and (far more interestingly) those with abysmal survival rates that are plunging to oblivion like a flaming grand piano off a clifftop. Everything else in the middle is just boring, although I will give each a write up. Hopefully the thread might provide some enlightenment on which used cars to avoid (masochists, and the bloody-minded excepted), and which might be stellar buys.
I must stress that just because a model line has a historically bad survival rate does not mean that modern examples will perform similarly, necessarily. I should also stress that just because Model A has a worse survival rate than Model B, it does not necessarily mean that Model A is a “worse car” than Model B. There are several possible reasons why cars cross over to the great car park in the sky:
When we get onto the serious analysis I will be disaggregating cars into the following market segments:
I look forward to hearing your feedback, and a few good debates (I am a fairly robust character, it is unlikely that you will offend me).
This work began as a contribution to the “Everyday cars that are starting to disappear” thread, born out of frustration that, interesting though most of posts were, they were entirely subjective in nature, and a consequent desire to introduce a degree of rigour and objective measurement to the process. What was intended to be a discrete post grew to the extent that I became guilty of the heinous crime of threadjacking. I was suggested by Seek that this subject was best split out to become something that could be referenced discretely, and that I copied my posts across. My apologies for the inordinate time that it has taken me to do this, but I have become incredibly busy. In consequence, my posts are likely to become rather sporadic for at least the next two to three months: unfortunately, car statistics take second place to earning my daily crust.
I should stress at the outset that this is intended only as a thread for geeks interested in car statistics, and in detailed/lengthy analysis. As such, it will be of no interest to the majority of those on this website, so I suggest that if this is not you that you stop reading here.
This is not intended as a personal hobbyhorse, so please feel free to contribute any statistics or analysis of your own. The only thing that I would ask is that we confine this thread to car survival statistics, so if you have, for example, some fascinating analysis of car power output trends, that you start a new thread for it.
The work started off innocently enough by consulting the excellent “How Many Left” website ( https://www.howmanyleft.co.uk/), but my natural tendency to always work back towards original source data, led me to the official Government statistics on which “How Many Left” is based, this can be found at: https://www.gov.uk/government/statistical-data-sets/all-vehicles-veh01. These enable us to do some much more interesting analysis. No datasets are ever perfect; however, as with most UK Government statistics, I consider the DfT data to be of high-quality, and free from any systematic bias (the DfT state their tests indicate that approximately 2% of entries have one data field incorrectly entered). Certainly, the data is a lot better than the majority the stuff that I encounter in my day job, and requires almost no cleaning. Even better, the DfT data is available in Excel spreadsheet format, which can be imported and manipulated, readily. There are some weaknesses in the datasets, and in particular with correlating it between the different datasets required to undertake the analysis, but we will encounter these issues as we go, which are in any case fundamentally second order in nature.
While the statistics might be good, the downside of this thread will be having to put up with my idiosyncratic views (I have been accused of building an entire career based on professional cynicism). Please regard me as the ‘shock jock’ of PH, my aim is to stimulate discussion and fresh thinking: if there is one thing that I have learnt in the workplace over the past few decades it is how supposedly absolute certainties, and self-evident truths on which all else is based can be fundamentally flawed. I am here to challenge established views, and in the debate, hopefully, enlightenment for us all will appear. My commentaries are a strange conflation between the factually accurate and irrefutability impartial, and my bigoted views. I try hard to draw a stylistic distinction between the two in my writing, so hopefully the joins are clear.
In re-posting my earlier work I will updating my work to reflect the constructive comments made, this will include some changes to the cars analysed in each market segment. The principal delay in posting it will be that I have been heavily expanding and updating my work on family hatchbacks to bring it up to the standard of the other market segments analysed. In the course of this work I have found two new contenders for Britain’s worst surviving car, which are almost too close to split, and come from different continents…
As ever, there are only two types of car that are interesting: those that survive vastly better than their peers, and (far more interestingly) those with abysmal survival rates that are plunging to oblivion like a flaming grand piano off a clifftop. Everything else in the middle is just boring, although I will give each a write up. Hopefully the thread might provide some enlightenment on which used cars to avoid (masochists, and the bloody-minded excepted), and which might be stellar buys.
I must stress that just because a model line has a historically bad survival rate does not mean that modern examples will perform similarly, necessarily. I should also stress that just because Model A has a worse survival rate than Model B, it does not necessarily mean that Model A is a “worse car” than Model B. There are several possible reasons why cars cross over to the great car park in the sky:
- They are not durable under UK conditions.
- Spare parts have become unavailable, or too expensive (which of course works two ways: cars are scrapped because some vital part has failed, and cars get scrapped for cannibalisation).
- Their value has dropped so low that owners are no longer prepared to spend money keeping them on the road.
- They have become unsaleable and thus are scrapped when their owners wish to change cars.
- Supply:demand economics: the car is of type for which there is insufficient demand in that part of the second-hand market (a subset of Point 4): as we will see it is small runarounds, and “interesting” cars that survive the best, while largish middle market cars survive relatively poorly as a group.
- The cars have been exported (although this might well not mean that vehicle has been scrapped, it is a reason for them disappearing from the UK registry).
When we get onto the serious analysis I will be disaggregating cars into the following market segments:
- Town Cars/Sub-Superminis
- Superminis
- Family Hatchbacks
- Family Cars
- Junior Executive Cars
- Executive Cars
- Luxury Cars
- Small People Carriers
- Large People Carriers
- Smaller SUVs
- Large SUVs
- Affordable Sports Cars
I look forward to hearing your feedback, and a few good debates (I am a fairly robust character, it is unlikely that you will offend me).
Edited by Car_Nut on Friday 31st March 00:34


This is where it all started, back on 7 January, my apologies if it repeats the introduction to this thread, my latest annotations to it are inside square brackets:
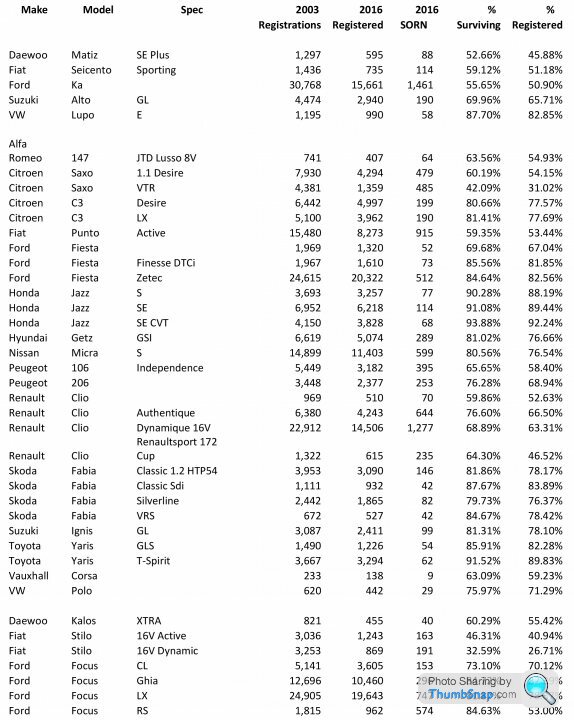
While I have found this thread interesting, I feel a desire to place it on a quantifiable rather than an anecdotal basis. Accordingly, I have consulted the howmanyleft.com website and have produced the following table. On the basis of the statistic quoted above [by an earlier poster on the original thread] for the current average life of a UK car of 13.8 years I have looked at the number of cars recorded as manufactured in 2003 that are still registered or SORNed in the UK. Which I think makes for quite interesting reading.
There are of course a number of health warnings that need to be given:
Naturally, I have merely scratched the surface of the available data, and there is much more to be done to produce a comprehensive analysis. I have spent many hours on this and feel that I have done my bit for now, but if anybody else wishes to add data, please post it up, and I would be happy to add it to my spreadsheet and re-post it.

I have drawn two sets of interim conclusions from the above: firstly, general conclusions, and secondly, more detailed conclusions about individual marques and models.
General Conclusions
Detailed Conclusions
Postscript
One glaring omission from this list was the Mini: I have no idea how I managed to forget it, but rest assured that it gets its rightful place in the Sun later in the thread.
While I have found this thread interesting, I feel a desire to place it on a quantifiable rather than an anecdotal basis. Accordingly, I have consulted the howmanyleft.com website and have produced the following table. On the basis of the statistic quoted above [by an earlier poster on the original thread] for the current average life of a UK car of 13.8 years I have looked at the number of cars recorded as manufactured in 2003 that are still registered or SORNed in the UK. Which I think makes for quite interesting reading.
There are of course a number of health warnings that need to be given:
- as the source website itself acknowledges, it is only as accurate as the Government statistics that it is based on allows – there are some plainly corrupt datasets, which I have ignored, fortunately these are only a small percentage of the total data [further work using the DfT data indicated that the issue arises from the howmanyleft.com website looking at individual model variants, an incredibly useful job; however, there are inconsistencies in the way that quite a few model variants are described between the “First Registrations” dataset and those for taxed and SORNed vehicles, which can make some of the data problematic when attempting to drill down to that level];
- the database replicates the manner in which vehicles were described on first registration, accordingly, most models are disaggregated into a bewildering number of variants, and in few cases only does it appear possible to gain access to a representative sample size of aggregate data for individual models, I have therefore been forced in most cases to select one or a few popular variants;
- in order to produce statistically significant samples my rule has been to use a minimum of 200 examples registered in 2003 as a cut off, although as you will see I have bent this on a couple of occasions to include a model of interest in the results;
- the statistics relate to manufacturer’s products of 13-14 years ago, thus some caution needs to be exercised when projecting the life-expectancy of current products, or equally crucially the future availability and pricing of spare parts.
Naturally, I have merely scratched the surface of the available data, and there is much more to be done to produce a comprehensive analysis. I have spent many hours on this and feel that I have done my bit for now, but if anybody else wishes to add data, please post it up, and I would be happy to add it to my spreadsheet and re-post it.
I have drawn two sets of interim conclusions from the above: firstly, general conclusions, and secondly, more detailed conclusions about individual marques and models.
General Conclusions
- As one would expect, it is small hatchbacks and prestige cars that have the greatest survival rates, with the greatest hollowing out being of common family sized cars.
- Notwithstanding the above, the smallest hatchbacks, in general, have markedly lower survival rates than supermini or family sized hatchbacks.
- In general, higher spec cars tend to survive better than base spec cars, no doubt reflecting the greater attachment that owners have for them, and thus willingness to pay for big bills on ageing cars.
- Estate cars have a survival rate varying between 2.5% and 9% higher than the saloon variant, reflecting their greater utility to owners. Their probability of being taxed is even higher, at between 5% and 16%.
- Performance variants tend to survive better, although there is a sharp dichotomy between the figures for small hatchbacks, and those for larger cars. At the risk of having my head bitten off, I would venture to suggest that this is likely to be related to the average driver profile: small hot hatches appealing to the yoof market tend to have poor survival rates, I suggest that this is likely to be as a result of being driven by inexperienced drivers who crash and otherwise abuse them a lot, whereas cars that are accessible to those with greater maturity (and probably greater average intelligence) and have markedly better survival rates than their cooking brethren, which by the time that one reaches the exalted heights of the Mercedes E500 gives an 80% survival advantage.
- The survival rates for diesel cars appear to be a shade over that that of equivalent petrol models: small diesel cars survive notably better than the equivalent petrol models, whereas at the prestige end of the market there appears to be slight bias in favour of petrol survival.
- Much as one hates to admit it, automatics seem to survive a little better than manuals, although again this is more marked in smaller cars.
- The survival rate of SUVs is, although high, somewhat less than I would have expected – it is clear that these are by no means virtually indestructible. The cost of repairs might be one issue, another might be export to the Third World. However, the survival rates for the cheaper models are much less than for prestige models.
- There is significant evidence of cars that most would consider to be the most likely future major classics being SORNed – one presumes that these vehicles are being stored by investors, mainly.
- Average survival rates across sample:
- Micro Hatches 58.3%
- Superminis 75.8%
- Family Hatches 70.6%
- Family Cars 52.1%
- Junior Executive Cars 72.1%
- Executive Cars 72.0%
- Luxury Barges 78.8%
- Estate Cars 79.3%
- People Carriers 72.6%
- SUVs 78.9%
- Sports Cars 73.9%
Detailed Conclusions
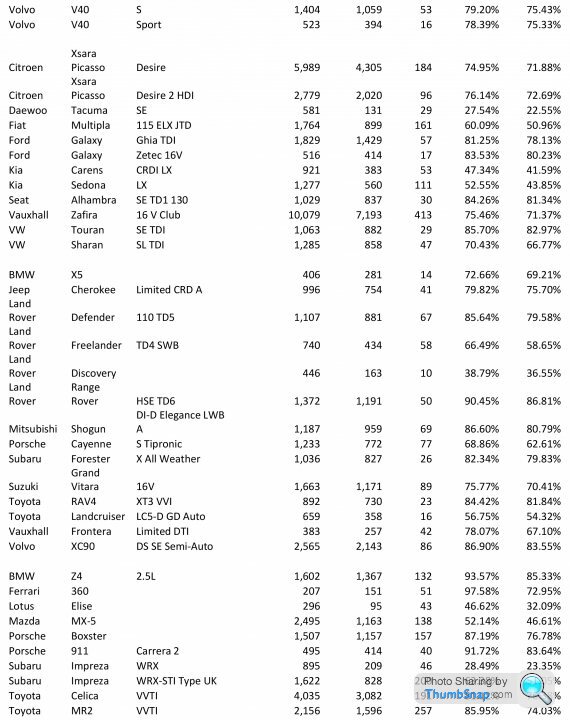
- As one would expect for the sample considered it is the Ferrari 360 that has the highest survival rate at 97.6%; however, over 25% of survivors are SORNed, no doubt mainly by collectors/speculators, and one is entitled to ask how many of these will ever be seen on the roads again. The BMW Z4 followed, just edging out the Porsche 911. I was somewhat surprised by the next two: the Honda Jazz, and the Jaguar XJ. These are both part of a strong showing by both manufacturers in the PH survival stakes.
- If a car originated from a mainstream manufacturer in France, Italy, Korea, or Malaysia then I am afraid that the chances of survival are not great, although there are some exceptions, which manage to achieve average survival rates for their class, most of which are Peugeots. The wooden spoon falls to the Daewoo Tacuma SE, with a survival rate of just 27.5%. Given that Korean cars are supposed to be the new Japanese cars this is perhaps a little surprising; however, Korean cars have come a long way in part 13-14 years, so I suspect that the current generation of cars is likely to fare rather better.
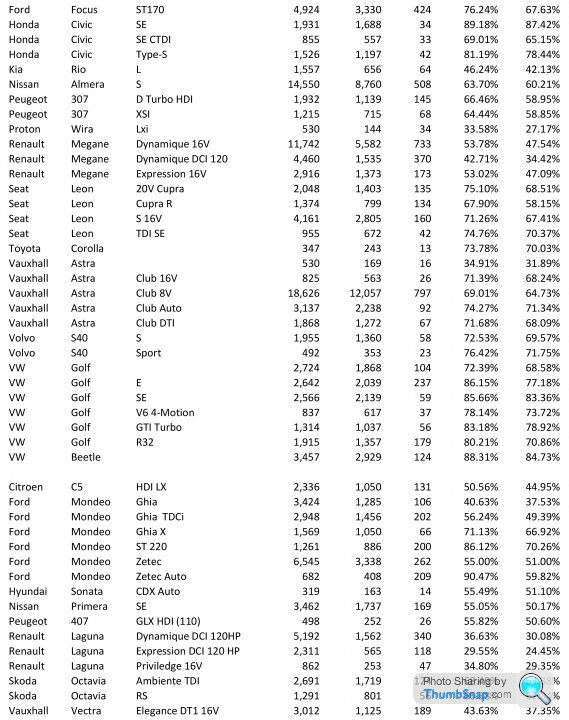
- Of the mainstream European manufacturers, I would suggest that the results indicate that the approximate ranking of survival probability is, from the best to worst, Ford, Skoda, VW, Peugeot, Vauxhall, Citroen, Renault, and Fiat. Of the great triumvirate, the sample indicates an 81.2% survival rate for the Focus, an 81.1% survival rate for the Golf, with Astra lagging badly on 69.2%. Given that this was the Mk4 Golf, I suspect that the Golf’s standing will slip subsequently: I strongly believe from personal ownership experience that the Mk 4 was a high point for the Golf, being more solidly engineered, and built with better quality components than later Golfs, even though these are more fun to drive. (I must admit to some personal interest here as I still own a very early Mk2 Golf GTI that I bought new, as well as a Mk2 16V Jetta GTI, that I have owned from new). None of the big three hatchbacks match the survival rate of the Fiesta: 83.7% of the sample. Contrast that with the 51.1% measured for the Renault Megane, or the 39.2% for the Fiat Stilo. Of the family-sized offerings only the VW Passat and Skoda Octavia have survival rates comparable to smaller hatchbacks. While the 34.5% survival rate of the notoriously flaky Mk2 Renault Laguna is badly sub-par.
- Of the Japanese manufacturers, Hondas have a greater survival rate than other manufacturers, let down only by the rather average 72.0% survival rate recorded for the Accord. Otherwise Honda has a survival rate comfortably above those of European mass market producers. Toyotas appear to have the second highest survival rates, which I must say slightly surprised me, given the horror stories that one hears about prices of crucial components. Nissan’s survival rates appear to be somewhat less than that of the other two main Japanese manufacturers, and comparable with those of middle-ranking European manufacturers.
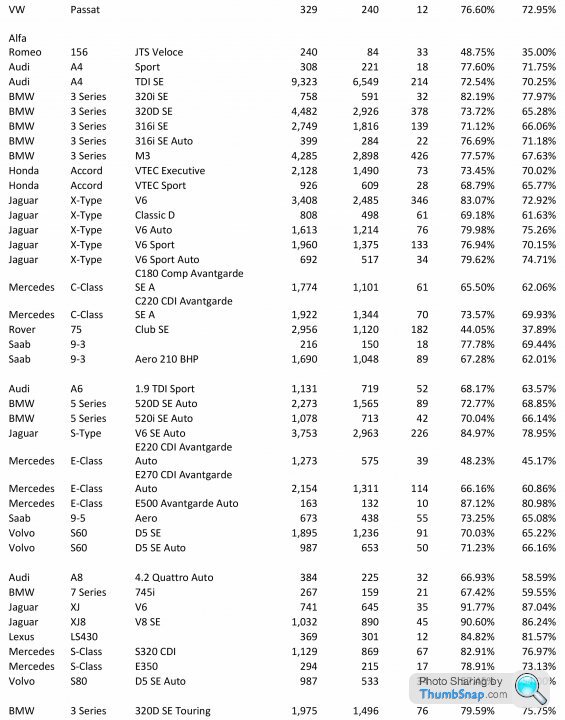
- At the prestige end of the market Jaguar is the clear winner of the PH survival stakes in all three executive/luxury categories, this was quite a surprise to me, and a real eye-opener. The more Jaguar variants that I looked at the more it confirmed the trend. Even cars that are not held in generally high regard these days, such as the X-Type and the S-Type, have outlived all of their German contemporaries on Britain’s roads. The only poor showing is at the very bottom of the X-Type tree, the 2.0 Classic D: a poverty spec version fitted with a rattlely old Ford diesel with known issues: the closest point between the X-Type and its Mondeo roots. At the other end of the scale comparison between the (X350) XJ8 and the Audi A8 Quattro is instructive: both were aluminium bodied cars, fitted with 4.2 litre V8 engines, the former has a 90.6% survival rate of just 66.9%: a staggering difference.
- In the executive and luxury sectors, it appears from the sample that Jaguar, are followed by BMW, Audi, Mercedes and Volvo, except at rarefied heights, where the Mercedes S-Class trails the Jaguar XJ, with everything else nowhere. Given, that we are talking about the infamous quality of Mercedes around the Millennium, their relatively low survival rates is not perhaps surprising: I am of a generation that regards the W124 as the pinnacle of mass production engineering and the everything that Daimler-Benz has done since as third rate by comparison.
- Where have all the Lotus Elises gone?
Postscript
One glaring omission from this list was the Mini: I have no idea how I managed to forget it, but rest assured that it gets its rightful place in the Sun later in the thread.


A perfect thread, thank you for putting the time and effort in.
Only had time to skim read and honed in the Focus vs MK4 Golf bit being only 0.1% apart. Out of those two it is a difficult call as which will have more on the road in say another five years time.
The MK1 and MK1.5 Focus is generally more simply engineered with less to go wrong in terms of engines and electronics but what is really letting them down is rust and secod to that will be the complicated mutlilink control blade rear suspension. The Focus is more robust and reliable but will rot away.
The MK4 Golf on the other hand is very well rustproofed and has a very simple rear suspension setup. Interestingly the front suspension on both the Golf and Focus is almost the same although the bush configuration on the Focus is more robust. What will let the Golf down and send it to the scrapper is an engine or electonics system failure.
From that alone they are neck and neck in a race to the scrappers, the Focus will rust away while the Golf will expensively go wrong.
However, factor in the greater love for and enthusiast scene then I think there will be more MK4 Golf left than MK1 / 1.5 Focus's in five years time.
As for current cars, I think they will be going to the scrapper much sooner than cars of yesteryear. The sweetspot for longlasting cars that a shed driver stands any chance of being to fix are those produced between the mid 90's and mid 00's. There are very few 90's cars left now so if anyone wants a credible go at shedding then grab an early 00's car before they too are few in numbers.
In the future shedding is going to be a lot more expensive and difficult, and I think rust once again is going to be a major issue. The issue is going to be 'coding' and built in inability of electronic parts to be re-used (coded) to another car. Electric power steering is going to be the biggest send to scrapper issue I'd say. Secondary to that due the expanded ranges of cars and therefore bespoke parts (mainly body panels) are going to be dealer only and therefore very expensive.
Only the most basic of current cars are going to become viable future sheds, could the Duster therefore become a classic?
Sorry if there is some thread shift but shedding is my thing although I never do it properly as I spend too much on my sheds.

May I take one sentence from the OP:
"The work started off innocently enough by consulting the excellent “How Many Left” website https://www.howmanyleft.co.uk/ , but my natural tendency to always work back towards original source data, led me to the official Government statistics on which “How Many Left” is based, this can be found at: https://www.gov.uk/government/statistical-data-set... "
'How Many Left' is notoriously inaccurate because the original data is flawed - the DfT data described as 'high quality'. It isn't, as those with an in-depth knowledge of a particular marque or model will confirm.
An example, the Riley One-Point-Five produced between 1957-1965. Production totalled 39,568. 'How Many Left' shows a Riley 1.5 was licensed in 1936, three were licensed in 1937 with cars of this model being licensed every year between 1946 - 1955. Those '40s-'50s cars are easy to explain; they are Riley RMA or RME models, an entirely different car which had an entirely different one and a half litre engine but the pre-war cars? Pre-war Rileys were given names e.g. Monaco, Kestrel but none of these models (which might have had one and a half litre engines) are listed and to complicate the data further, there is a post-war Riley Kestrel but with a 1100cc or 1300cc engine.
Here's the Riley data: https://www.howmanyleft.co.uk/?utf8=✓&q...
Why the confusion in the data? 'Input error'. The statement, "the DfT state their tests indicate that approximately 2% of entries have one data field incorrectly entered" is questionable; it doesn't take a professional data analyst to see that. No car historian would regard it as reliable, merely indicative and therefore any work based upon it must be taken with the proverbial pinch of salt.
Car_Nut said:
- Where have all the Lotus Elises gone?
ETA: I just noticed someone else had already said the same thing.

Also, whilst mechanical issues are never going to write off an Elise (because you can replace he entire drive-train for half the value of the cheapest Elise), relatively minor accident damage can, and a lot of cars get used on track.
Edited by kambites on Friday 31st March 08:03
Riley Blue said:
May I take one sentence from the OP:
"The work started off innocently enough by consulting the excellent “How Many Left” website https://www.howmanyleft.co.uk/ , but my natural tendency to always work back towards original source data, led me to the official Government statistics on which “How Many Left” is based, this can be found at: https://www.gov.uk/government/statistical-data-set... "
'How Many Left' is notoriously inaccurate because the original data is flawed - the DfT data described as 'high quality'. It isn't, as those with an in-depth knowledge of a particular marque or model will confirm.
An example, the Riley One-Point-Five produced between 1957-1965. Production totalled 39,568. 'How Many Left' shows a Riley 1.5 was licensed in 1936, three were licensed in 1937 with cars of this model being licensed every year between 1946 - 1955. Those '40s-'50s cars are easy to explain; they are Riley RMA or RME models, an entirely different car which had an entirely different one and a half litre engine but the pre-war cars? Pre-war Rileys were given names e.g. Monaco, Kestrel but none of these models (which might have had one and a half litre engines) are listed and to complicate the data further, there is a post-war Riley Kestrel but with a 1100cc or 1300cc engine.
Here's the Riley data: https://www.howmanyleft.co.uk/?utf8=?&q=Riley
Why the confusion in the data? 'Input error'. The statement, "the DfT state their tests indicate that approximately 2% of entries have one data field incorrectly entered" is questionable; it doesn't take a professional data analyst to see that. No car historian would regard it as reliable, merely indicative and therefore any work based upon it must be taken with the proverbial pinch of salt.
I can't see that this is relevant. We all know that How Many Left data for classic cars is flawed, hardly surprising given that much of this goes back pre DVLA, the OP's stats do not cover pre '03. Also, in comparing the data as listed/removed from listing a minority of data that might be missing or incorrectly recorded does not distort the output."The work started off innocently enough by consulting the excellent “How Many Left” website https://www.howmanyleft.co.uk/ , but my natural tendency to always work back towards original source data, led me to the official Government statistics on which “How Many Left” is based, this can be found at: https://www.gov.uk/government/statistical-data-set... "
'How Many Left' is notoriously inaccurate because the original data is flawed - the DfT data described as 'high quality'. It isn't, as those with an in-depth knowledge of a particular marque or model will confirm.
An example, the Riley One-Point-Five produced between 1957-1965. Production totalled 39,568. 'How Many Left' shows a Riley 1.5 was licensed in 1936, three were licensed in 1937 with cars of this model being licensed every year between 1946 - 1955. Those '40s-'50s cars are easy to explain; they are Riley RMA or RME models, an entirely different car which had an entirely different one and a half litre engine but the pre-war cars? Pre-war Rileys were given names e.g. Monaco, Kestrel but none of these models (which might have had one and a half litre engines) are listed and to complicate the data further, there is a post-war Riley Kestrel but with a 1100cc or 1300cc engine.
Here's the Riley data: https://www.howmanyleft.co.uk/?utf8=?&q=Riley
Why the confusion in the data? 'Input error'. The statement, "the DfT state their tests indicate that approximately 2% of entries have one data field incorrectly entered" is questionable; it doesn't take a professional data analyst to see that. No car historian would regard it as reliable, merely indicative and therefore any work based upon it must be taken with the proverbial pinch of salt.
Keep it stiff said:
Riley Blue said:
May I take one sentence from the OP:
"The work started off innocently enough by consulting the excellent “How Many Left” website https://www.howmanyleft.co.uk/ , but my natural tendency to always work back towards original source data, led me to the official Government statistics on which “How Many Left” is based, this can be found at: https://www.gov.uk/government/statistical-data-set... "
'How Many Left' is notoriously inaccurate because the original data is flawed - the DfT data described as 'high quality'. It isn't, as those with an in-depth knowledge of a particular marque or model will confirm.
An example, the Riley One-Point-Five produced between 1957-1965. Production totalled 39,568. 'How Many Left' shows a Riley 1.5 was licensed in 1936, three were licensed in 1937 with cars of this model being licensed every year between 1946 - 1955. Those '40s-'50s cars are easy to explain; they are Riley RMA or RME models, an entirely different car which had an entirely different one and a half litre engine but the pre-war cars? Pre-war Rileys were given names e.g. Monaco, Kestrel but none of these models (which might have had one and a half litre engines) are listed and to complicate the data further, there is a post-war Riley Kestrel but with a 1100cc or 1300cc engine.
Here's the Riley data: https://www.howmanyleft.co.uk/?utf8=?&q=Riley
Why the confusion in the data? 'Input error'. The statement, "the DfT state their tests indicate that approximately 2% of entries have one data field incorrectly entered" is questionable; it doesn't take a professional data analyst to see that. No car historian would regard it as reliable, merely indicative and therefore any work based upon it must be taken with the proverbial pinch of salt.
I can't see that this is relevant. We all know that How Many Left data for classic cars is flawed, hardly surprising given that much of this goes back pre DVLA, the OP's stats do not cover pre '03. Also, in comparing the data as listed/removed from listing a minority of data that might be missing or incorrectly recorded does not distort the output."The work started off innocently enough by consulting the excellent “How Many Left” website https://www.howmanyleft.co.uk/ , but my natural tendency to always work back towards original source data, led me to the official Government statistics on which “How Many Left” is based, this can be found at: https://www.gov.uk/government/statistical-data-set... "
'How Many Left' is notoriously inaccurate because the original data is flawed - the DfT data described as 'high quality'. It isn't, as those with an in-depth knowledge of a particular marque or model will confirm.
An example, the Riley One-Point-Five produced between 1957-1965. Production totalled 39,568. 'How Many Left' shows a Riley 1.5 was licensed in 1936, three were licensed in 1937 with cars of this model being licensed every year between 1946 - 1955. Those '40s-'50s cars are easy to explain; they are Riley RMA or RME models, an entirely different car which had an entirely different one and a half litre engine but the pre-war cars? Pre-war Rileys were given names e.g. Monaco, Kestrel but none of these models (which might have had one and a half litre engines) are listed and to complicate the data further, there is a post-war Riley Kestrel but with a 1100cc or 1300cc engine.
Here's the Riley data: https://www.howmanyleft.co.uk/?utf8=?&q=Riley
Why the confusion in the data? 'Input error'. The statement, "the DfT state their tests indicate that approximately 2% of entries have one data field incorrectly entered" is questionable; it doesn't take a professional data analyst to see that. No car historian would regard it as reliable, merely indicative and therefore any work based upon it must be taken with the proverbial pinch of salt.
It's relevant because, as I understand it, the DfT's statement for its data accuracy includes all decades, including pre-DVLA. In the case of older cars, it's so inaccurate it's virtually useless.
Gassing Station | General Gassing | Top of Page | What's New | My Stuff