UKIP - The Future - Volume 3
Discussion


Interesting article by Carswell on the new 'digital democracy'
http://www.standard.co.uk/comment/comment/douglas-...
http://www.standard.co.uk/comment/comment/douglas-...
Guam said:
Thanks, we know greater london is skewed on such polling relative to RUK. It would be good to see how the demographics break down by region 
Data is not sufficient to look at it by region AND age. But the regional weighting tells us nothing new. UKIP support worst in London and Scotland, esp north of border. Best in North , closely followed by the South excl London. Midland and Wales somewhere in the middle.
Greens much much more evenly balanced across the country. Scotland noticeably the front runner which probably ties in with LD history and collapse of their vote plus of course they may just be raving greens. London a step behind, closely followed by Midlands/Wales. Equal last place at levels just below the UKIP Midlands result were South and North.Greens didn't have a single region anywhere near the low scores of the UKIP Scotland and London scores.
Again socio-economic results nothing new there either. Greens weighted a little towards ABC1 with UKIP weighted an equal amount towards C2DE.
In terms of sampling heavily weighted towards South excl London, with very poor sampling imo in London and Scotland.
Not sure if that answers your question fully but considering the data not especially comprehensive.
Rgds
HonestIago said:
Of most young folk (I'm 24) being hopelessly naive? Mine too. Man-made climate change is non-existent and the Greens are only supported by those who are completely economically illiterate. I honestly despair at some of the tripe I hear from my former university friends who are planning to vote for them.
Don't despair. I'm 36 and exactly the same sort of statistics were touted as heralding a generational shift 12 years ago, and before. It's a classic tactic of so called progressives to play on the gullibility and optimism of the young. It makes young people feel self conscious about espousing "old" opinions and middle aged people feel young by indulging in folly.
As you get older you will find that people get more sensible. Gingerly at first then gathering pace as people lose their youthful vanity along with the nervous conformity it brings, and see that we aren't on the brink of an exciting new epoch where logic will be turned on it's head, but that every generation of politicians pushes the myth that we are on the gullible and the optimistic, who are disproportionately represented amongst the young, for it's own ends.
Here is an example of that:
11% of those polled said we should pay more to the EU!
perhaps they were on benefits, or worked for the EU.
A YouGov poll published yesterday found 52 percent of respondents saying the U.K. should refuse to pay the surcharge if Cameron can’t persuade the EU to drop the demand. Only 11 percent said it was fair for Britain to contribute more. YouGov questioned 1,808 British adults on Oct. 30-31.
Foppo said:
What do you mean do you agree with this article or not?
Cameron won't be able to turn the clock back,the E.U.is about free movement of people.
It is up to Immigration to stop criminals entering the U.K.
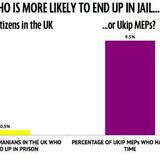
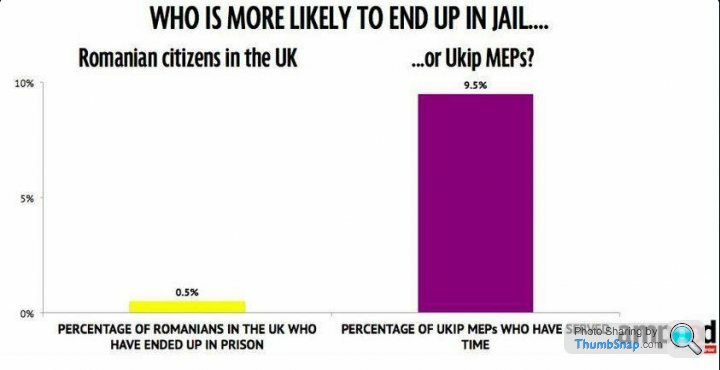
Criminals like Romanian ones? With 0.5% of them doing jail time, I'm sure other European countries would be far more interested in UKIP's MEPs levels of criminality with 9.5% of them doing jail time, for instance.Cameron won't be able to turn the clock back,the E.U.is about free movement of people.
It is up to Immigration to stop criminals entering the U.K.
So from James Kirkup and Lord Ashcroft today,maybe here is the reason that Labour and Conservatives are pooping themselves.
Chart plots combined share of the LabCon vote since 1945. (ignore the nonsensical X-axis labels)

Big two are in long term decline. Labour in particular.
The party's over......
Chart plots combined share of the LabCon vote since 1945. (ignore the nonsensical X-axis labels)
Big two are in long term decline. Labour in particular.
The party's over......
zygalski said:
FiF said:
Just putting this here.


Source YouGov h/t Matt Goodwin
This is such a shame.Source YouGov h/t Matt Goodwin
Bar graphs used to be so much better in the good old days.

NicD said:
What he omits to say is that his interpretation of the EU contribution as being the same as income taxes on an individual citizen places the UK as a subordinate entity to the sovereign EU. Not a situation that I am happy with, and I don't believe morally speaking that our politicians ever had any right to put the UK in this position. "We" the British tax payers never agreed to this and cannot be held liable for false promises made by politicians who didn't have the authority to make them.It seems more realistic to treat the contributions as a subscription pooled between peers, which completely changes the nature of not paying it and is something that is quite reasonable in the circumstances.
It seems more relevant to look at the ongoing spat between the US and the UN which means the US has been in arrears since the early 90s, and has arguably used it quite effectively as a lever for getting reforms through.
It might not be the sort of straight bat upright behaviour that that journalist expects of the UK but it's effective, and it's hardly reduced the US to an outcast.
AJS- said:
NicD said:
What he omits to say is that his interpretation of the EU contribution as being the same as income taxes on an individual citizen places the UK as a subordinate entity to the sovereign EU. Not a situation that I am happy with, and I don't believe morally speaking that our politicians ever had any right to put the UK in this position. "We" the British tax payers never agreed to this and cannot be held liable for false promises made by politicians who didn't have the authority to make them.It seems more realistic to treat the contributions as a subscription pooled between peers, which completely changes the nature of not paying it and is something that is quite reasonable in the circumstances.
It seems more relevant to look at the ongoing spat between the US and the UN which means the US has been in arrears since the early 90s, and has arguably used it quite effectively as a lever for getting reforms through.
It might not be the sort of straight bat upright behaviour that that journalist expects of the UK but it's effective, and it's hardly reduced the US to an outcast.
Esseesse said:
AJS- said:
NicD said:
What he omits to say is that his interpretation of the EU contribution as being the same as income taxes on an individual citizen places the UK as a subordinate entity to the sovereign EU. Not a situation that I am happy with, and I don't believe morally speaking that our politicians ever had any right to put the UK in this position. "We" the British tax payers never agreed to this and cannot be held liable for false promises made by politicians who didn't have the authority to make them.It seems more realistic to treat the contributions as a subscription pooled between peers, which completely changes the nature of not paying it and is something that is quite reasonable in the circumstances.
It seems more relevant to look at the ongoing spat between the US and the UN which means the US has been in arrears since the early 90s, and has arguably used it quite effectively as a lever for getting reforms through.
It might not be the sort of straight bat upright behaviour that that journalist expects of the UK but it's effective, and it's hardly reduced the US to an outcast.
If there has been careless behaviour or miscalculation then just 6 years.
Well has there been either here? No.
It's a retrospective change of the rules.
Now I can understand the argument that they want to include from black economy, it's a bit like the IRS in USA saying that they will tax service staff on assumed level of tips. But surely they can only change after a period of notice, maybe this year and then going forward.
But to do it the way it's been done is simply not acceptable and illustrates how arrogant and out of control the EU is.
Stuff em, don't pay invoke article 50. What they going to do? Invade?
zygalski said:
xjsdrive said:
Criminals like Romanian ones? With 0.5% of them doing jail time, I'm sure other European countries would be far more interested in UKIP's MEPs levels of criminality with 9.5% of them doing jail time, for instance.
Haha. Brilliant! 
'brilliant' for a moron.
Note: I am not supporting benefit fraud by anyone and especially not by a politician.
woosh parrot 
The point is that selective stats can be used to show virtually anything from any particular bias, as per that daft tiny sample size of Greens vs UKIP age related nonsense earlier.
Not that I'd expect such diverse thinking in this thread of all places.
In the UKIP vs Greens data there were a total of 186 people apparently asked to choose.
There were no other choices given & unusually in this kind of polling, no unsure or neither of the above option, so I assume it was a straight choice between the 2 parties.
Was it a random sample?
How were the people selected?
How many of those would rather vote for someone else given the option?
Why create a poll with such an insignificantly small sample size & limited options & does this indicate a rather obvious agenda & bias?
In other words, junk data in = junk data out.
Edited by zygalski on Tuesday 4th November 06:18
zygalski said:
woosh parrot
The point is that selective stats can be used to show virtually anything from any particular bias, as per that daft tiny sample size of Greens vs UKIP age related nonsense earlier.
Not that I'd expect such diverse thinking in this thread of all places.
In the UKIP vs Greens data there were a total of 186 people apparently asked to choose.
There were no other choices given & unusually in this kind of polling, no unsure or neither of the above option, so I assume it was a straight choice between the 2 parties.
Was it a random sample?
How were the people selected?
How many of those would rather vote for someone else given the option?
Why create a poll with such an insignificantly small sample size & limited options & does this indicate a rather obvious agenda & bias?
In other words, junk data in = junk data out.
Whoosh parrot just flown in and seeing your credibility had just gone out of the other window has fallen over laughing. The point is that selective stats can be used to show virtually anything from any particular bias, as per that daft tiny sample size of Greens vs UKIP age related nonsense earlier.
Not that I'd expect such diverse thinking in this thread of all places.
In the UKIP vs Greens data there were a total of 186 people apparently asked to choose.
There were no other choices given & unusually in this kind of polling, no unsure or neither of the above option, so I assume it was a straight choice between the 2 parties.
Was it a random sample?
How were the people selected?
How many of those would rather vote for someone else given the option?
Why create a poll with such an insignificantly small sample size & limited options & does this indicate a rather obvious agenda & bias?
In other words, junk data in = junk data out.
Edited by zygalski on Tuesday 4th November 06:18
Already raised questiond about some aspects of that poll but just to correct some of the unbelievable twaddle posted above.
1883 people were given the options of choosing if they would ever vote for or not vote for Cons / Labour / LibDems / Greens.
Seeing as they were doing limited polling in Scotland and Wales wonder why SNP or Plaid were not included. But on the other hand these are not national parties but nationalists standing only in some areas.
Now as to only 186 people being asked to choose just between two parties. What incredulous twaddle.
Responses were
I would definitely vote for x
I would probably vote for x
The sum of these expressed as yes.
I would definitely not vote for x
I would probably not vote for x
The sum of these expressed as no
Don't know.
Clearly people could express yes or no for more than one party. Remember the question was, would you ever...
So the results were in overall terms expressed as % figures.
Party, Yes %, No%, Don't know %
Cons, 37, 55, 9
Lab, 38, 53, 9
LibDem, 19, 73, 9
UKIP, 23, 66, 11
Green, 24, 66, 11
In summary, despite my reservations about the sampling, the greatest culprit of garbage out in all this is Mr Zygalski.
Exit is over there.
FiF said:
Whoosh parrot just flown in and seeing your credibility had just gone out of the other window has fallen over laughing.
Already raised questiond about some aspects of that poll but just to correct some of the unbelievable twaddle posted above.
1883 people were given the options of choosing if they would ever vote for or not vote for Cons / Labour / LibDems / Greens.
Seeing as they were doing limited polling in Scotland and Wales wonder why SNP or Plaid were not included. But on the other hand these are not national parties but nationalists standing only in some areas.
Now as to only 186 people being asked to choose just between two parties. What incredulous twaddle.
Responses were
I would definitely vote for x
I would probably vote for x
The sum of these expressed as yes.
I would definitely not vote for x
I would probably not vote for x
The sum of these expressed as no
Don't know.
Clearly people could express yes or no for more than one party. Remember the question was, would you ever...
So the results were in overall terms expressed as % figures.
Party, Yes %, No%, Don't know %
Cons, 37, 55, 9
Lab, 38, 53, 9
LibDem, 19, 73, 9
UKIP, 23, 66, 11
Green, 24, 66, 11
In summary, despite my reservations about the sampling, the greatest culprit of garbage out in all this is Mr Zygalski.
Exit is over there.
So it's a poll of 1883 people with other rather diluting factors such as "would you ever...."Already raised questiond about some aspects of that poll but just to correct some of the unbelievable twaddle posted above.
1883 people were given the options of choosing if they would ever vote for or not vote for Cons / Labour / LibDems / Greens.
Seeing as they were doing limited polling in Scotland and Wales wonder why SNP or Plaid were not included. But on the other hand these are not national parties but nationalists standing only in some areas.
Now as to only 186 people being asked to choose just between two parties. What incredulous twaddle.
Responses were
I would definitely vote for x
I would probably vote for x
The sum of these expressed as yes.
I would definitely not vote for x
I would probably not vote for x
The sum of these expressed as no
Don't know.
Clearly people could express yes or no for more than one party. Remember the question was, would you ever...
So the results were in overall terms expressed as % figures.
Party, Yes %, No%, Don't know %
Cons, 37, 55, 9
Lab, 38, 53, 9
LibDem, 19, 73, 9
UKIP, 23, 66, 11
Green, 24, 66, 11
In summary, despite my reservations about the sampling, the greatest culprit of garbage out in all this is Mr Zygalski.
Exit is over there.
Thanks for finally elaborating on what the bar graph actually meant.
I didn't see any explanation whatsoever between the posts.
Still junk stats. I'd put a tick in the box to vote Tory if they changed most of their policies. What does that prove?
zygalski said:
So it's a poll of 1883 people with other rather diluting factors such as "would you ever...."
Thanks for finally elaborating on what the bar graph actually meant.
I didn't see any explanation whatsoever between the posts.
Still junk stats. I'd put a tick in the box to vote Tory if they changed most of their policies. What does that prove?
It proves you need a bigger Thanks for finally elaborating on what the bar graph actually meant.
I didn't see any explanation whatsoever between the posts.
Still junk stats. I'd put a tick in the box to vote Tory if they changed most of their policies. What does that prove?
Gassing Station | News, Politics & Economics | Top of Page | What's New | My Stuff