Climate change - the POLITICAL debate. Vol 3
Discussion


This is what counts as properly sited and OK for records these days!
https://wattsupwiththat.com/2015/07/18/heathrow-hi...
30 years ago the Heathrow record would have been discarded. 15 years ago it would have been annotated as unreliable. Today it goes straight to the top of the list.
https://wattsupwiththat.com/2015/07/18/heathrow-hi...
30 years ago the Heathrow record would have been discarded. 15 years ago it would have been annotated as unreliable. Today it goes straight to the top of the list.
Mr GrimNasty said:
This is what counts as properly sited and OK for records these days!
https://wattsupwiththat.com/2015/07/18/heathrow-hi...
30 years ago the Heathrow record would have been discarded. 15 years ago it would have been annotated as unreliable. Today it goes straight to the top of the list.
Deluded.https://wattsupwiththat.com/2015/07/18/heathrow-hi...
30 years ago the Heathrow record would have been discarded. 15 years ago it would have been annotated as unreliable. Today it goes straight to the top of the list.
JawKnee said:
Mr GrimNasty said:
This is what counts as properly sited and OK for records these days!
https://wattsupwiththat.com/2015/07/18/heathrow-hi...
30 years ago the Heathrow record would have been discarded. 15 years ago it would have been annotated as unreliable. Today it goes straight to the top of the list.
Deluded.https://wattsupwiththat.com/2015/07/18/heathrow-hi...
30 years ago the Heathrow record would have been discarded. 15 years ago it would have been annotated as unreliable. Today it goes straight to the top of the list.
Yes but when your research funding depends on the answer politicians require what would you do??
I don't think its delusional just pragmatic... doesn't make it right though ...
//
JawKnee said:
Pah.Abadan in Iran is noted as being 57C on 12th July 2016.
https://weatherspark.com/history/32788/2016/Abadan...
Masters is late to the party but shouting more effectively for some reason.
Lets see the data and the changes list at the recording station.
LongQ said:
JawKnee said:
Pah.Abadan in Iran is noted as being 57C on 12th July 2016.
https://weatherspark.com/history/32788/2016/Abadan...
Masters is late to the party but shouting more effectively for some reason.
Lets see the data and the changes list at the recording station.
https://weatherspark.com/history/32848/2016/Al-Maq...
Quotes from the Page:
"Temperature
The hottest day of the last 12 months was June 30, with a high temperature of 50°C. For reference, on that day the average high temperature is 45°C and the high temperature exceeds 47°C only one day in ten. The hottest month of the last 12 months was July with an average daily high temperature of 47°C.
Relative to the average, the hottest day was February 20. The high temperature that day was 33°C, compared to the average of 22°C, a difference of 11°C. In relative terms the warmest month was February, with an average high temperature of 24°C, compared to an typical value of 21°C. "
Note that 2016 is a leap year. The hottest day in 2015 was 29th July at 49C. So not much difference for date or temperature.
And then this ...
" The coldest day of the last 12 months was January 31, with a low temperature of 0°C. For reference, on that day the average low temperature is 8°C and the low temperature drops below 4°C only one day in ten. The coldest month of the last 12 months was January with an average daily low temperature of 8°C.
Relative to the average, the coldest day was January 31. The low temperature that day was 0°C, compared to the average of 8°C, a difference of 8°C. In relative terms the coldest month was December, with an average low temperature of 8°C, compared to an typical value of 10°C.
The longest cold spell was from December 5 to December 14, constituting 10 consecutive days with cooler than average low temperatures. The month of December had the largest fraction of cooler than average days with 65% days with lower than average low temperatures. "
Apparently the coldest temp recorded in Kuwait was -4C in January 1964.
http://www.met.gov.kw/Climate/summary.php
Whichever way you look at things quoting what are obviously high temperatures in human experience terms to tenths of a degree to find 2/10ths or so (less than half a percent at that level of temperature) sound rather desperate in PR terms.
I not that the Grauniad's headline refers to "Mercury" hitting 54c. Has no one told them that Mercury has been banned and everything recalibrated?
JawKnee said:
turbobloke said:
Secondly, in the context of this thread, the record for any location and all locations is very short, and any record achieved has no causality to humans attached to it as a result of being a record.
Records still show trends even if they are relatively short but I'm sure you know that. As we see new records as CO2 continue to rise it only adds weight to the theory that CO2 is the cause of climate change.Mr GrimNasty said:
No it's not the hottest on record.
Lots of others beat it (esp. US & Australia), but crooks like to discard as unreliable whilst keeping jet engine wash enhanced Heathrow readings.
You do realise just about everywhere in Kuwait is normally 45-50C max. this time of year, 55+ must be fairly 'common' just not enough weather stations to capture.
Meanwhile Peru has record cold http://www.aljazeera.com/news/2016/07/severe-winte... and snow has fallen on 6 continents in July, even down to 1500m in Europe which is highly unusual.
You do realise that for temperature readings to be accepted they need to be from stations properly sited so that the readings are as accurate as possible.Lots of others beat it (esp. US & Australia), but crooks like to discard as unreliable whilst keeping jet engine wash enhanced Heathrow readings.
You do realise just about everywhere in Kuwait is normally 45-50C max. this time of year, 55+ must be fairly 'common' just not enough weather stations to capture.
Meanwhile Peru has record cold http://www.aljazeera.com/news/2016/07/severe-winte... and snow has fallen on 6 continents in July, even down to 1500m in Europe which is highly unusual.
If 55+ is common in that part of the world you'd think at least one of the stations out there would have recorded 55+ at least one point in the past. I highly suspect 55+ is not common out there.
Record temps in the Middle East at the same time as Peru having record snow. Just shows the global climate is in an unusual state at the moment. Things are not normal. Quite worrying really.
Can you tell us when the unusual state will stop? What is NORMAL then ? Normal, a word that is as stupid as AVERAGE !!!
This supposed new temperature record for Kuwait (it has not been accepted by the WMO) is actually another case of altered data and erasing the past to create new records and keep the warming lie going.
58C was the accepted record for the region until ONLY 2012 by the WMO and the Guinness Book of Records.
"On Sept. 13, 1922, El Azizia made history after a weather station there recorded the highest temperature ever directly measured on Earth: a blistering 136.4 degrees Fahrenheit. The record stood for 90 years until the World Meteorological Organization announced in 2012 that it found the 1922 numbers to be invalid. Although El Azizia's record has been downgraded, there's little doubt that the region is capable of reclaiming it."
The bizarre thing is that in the assessment the WMO reconfirmed the Death Valley record as reliable.
Now some people are trying to discredit Death Valley too! All this rewriting of history is based on a belief system that such record temperatures could not have happened back then because it is only the CO2 causing such heat now! It is confirmation bias feedback at its worst - the data doesn't fit the theory - alter it.
"This committee [WMO] identified five major concerns with the 1922 El Azizia temperature extreme record, specifically 1) potentially problematical instrumentation, 2) a probable new and inexperienced observer at the time of observation, 3) unrepresentative microclimate of the observation site, 4) poor correspondence of the extreme to other locations, and 5) poor comparison to subsequent temperature values recorded at the site. Based on these concerns, the WMO World Archive of Weather and Climate Extremes rejected this temperature extreme of 58°C as the highest temperature officially recorded on the planet. The WMO assessment is that the highest recorded surface temperature of 56.7°C (134°F) was measured on 10 July 1913 at Greenland Ranch (Death Valley), California."
Most if not all of these data integrity worries will apply to this latest Kuwait Mitribah station reading (a remote featureless area of north-west Kuwait) - but I bet the assessment won't be carried out with the same rigour.
The normal maximum average temperatures in this area of the world, say, Kuwait City for July is 46C, 50C+ is normal and irrelevant, unless you are trying to promulgate a global warming lie.
Edit to add.
Got the station number now 40551 so could check some details.
The average max. temperature this time of year is 49C!!!!!!!!!!
Data only appears to go back to 1996 - so this is the hottest reading in only 20 years there.
The site appears to be automatic but has had reported sensor issues in the last few years 'believed' fixed.
Electronic instruments are known to spike and read higher than LiG.
Possible US and other army activity in the area.
Other notable temperatures in the records.
55.0C Tunisia, Kebili, July 1931
54.0C Israel, Tirat Zvi, June 1942
50.7C Australia, Oodnadatta, January, 1960 (also 53.9C Buddah lake Dec 1828).
50.0C Spain, Seville, August 1881
48.9C Argentina, Rivadavia, December 1905
Most consecutive days above 100.0F: 160 days; Marble Bar, Western Australia from 31 October 1923 to 7 April 1924.
A desert in Iran was found to have a ground temperature exceeding 70C in a brief satellite survey, would easily be exceeded with more intensive surveying.
The other fact is that extreme heat records for all continents predate 1980.
To suggest there is anything worrisome about today's climate is clearly nuts.
Edited by Mr GrimNasty on Monday 25th July 13:21
Mr GrimNasty said:
Hottest year ever?
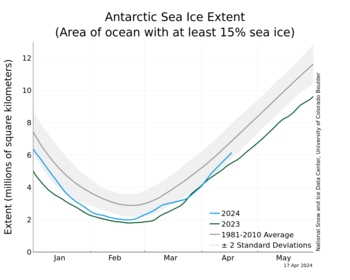
Not currently in the Arctic, below average for the melt season if anything.
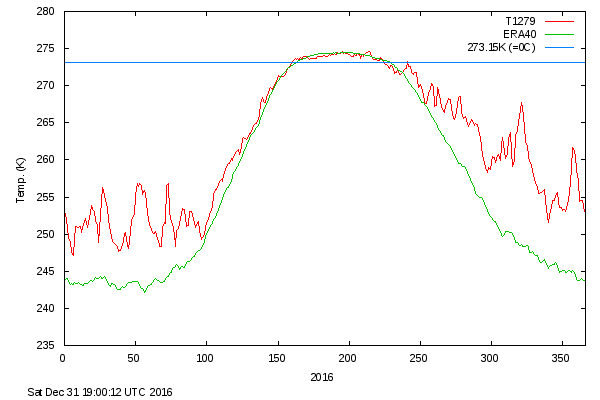
A bit of substance on these misleading graphs.Not currently in the Arctic, below average for the melt season if anything.
First, here's a (translated) quote from the source of this graph:
DMI said:
Since the 1970s, we had satellites that can measure the extent of sea ice. Therefore, we know with certainty that today is significantly less sea ice in the Northern Hemisphere than 35 years ago. During the last about 10 years the melting has accelerated, and especially during the minimum spread in September, one can observe large changes. Overall, the ice in the Arctic Ocean never been thinner and more vulnerable than now.
http://ocean.dmi.dk/arctic/index.phpAnd to put your graph into context:
Mr GrimNasty said:
Antarctic still stubbornly in denial about the exitence of man-made CO2.

To put the relatively small cooling of the southern polar region into the perspectiv of global warming (from the same source):
Mr GrimNasty said:
Antarctic ice extent is bang on long term average.
Source?Because the GRACE satellite data says otherwise:
https://data1.geo.tu-dresden.de/ais_gmb/
Mr GrimNasty said:
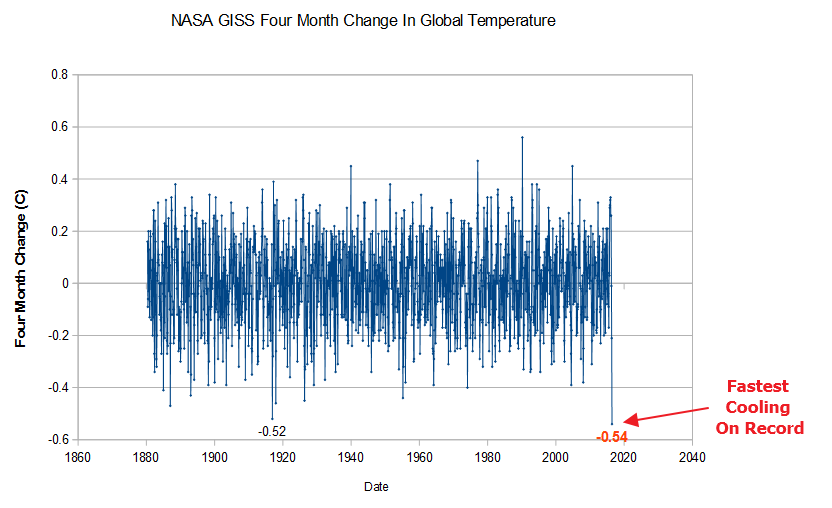
Globally the El Nino heat continues to deny the CO2 and radiate off into space as nature intended to regulate the planet.
Odd phrase. Nature doesn't "intend" to do anything.powerstroke said:
Yes but when your research funding depends on the answer politicians require what would you do??
Who's research hasn't been funded? Even today a large chunk of senior US politicians don't accept the science of global warming, so which politicians do you mean?
durbster said:
Mr GrimNasty said:
Globally the El Nino heat continues to deny the CO2 and radiate off into space as nature intended to regulate the planet.
Odd phrase. Nature doesn't "intend" to do anything.durbster said:
powerstroke said:
Yes but when your research funding depends on the answer politicians require what would you do??
Who's research hasn't been funded? Even today a large chunk of senior US politicians don't accept the science of global warming, so which politicians do you mean?

mybrainhurts said:
durbster said:
Mr GrimNasty said:
Globally the El Nino heat continues to deny the CO2 and radiate off into space as nature intended to regulate the planet.
Odd phrase. Nature doesn't "intend" to do anything.mybrainhurts said:
durbster said:
powerstroke said:
Yes but when your research funding depends on the answer politicians require what would you do??
Who's research hasn't been funded? Even today a large chunk of senior US politicians don't accept the science of global warming, so which politicians do you mean?
durbster said:
mybrainhurts said:
durbster said:
Mr GrimNasty said:
Globally the El Nino heat continues to deny the CO2 and radiate off into space as nature intended to regulate the planet.
Odd phrase. Nature doesn't "intend" to do anything.mybrainhurts said:
durbster said:
powerstroke said:
Yes but when your research funding depends on the answer politicians require what would you do??
Who's research hasn't been funded? Even today a large chunk of senior US politicians don't accept the science of global warming, so which politicians do you mean?
Can that be summed up as the amount of sea ice isn't constant, and it moves around a bit ?
That's all
durbster said:
Usual tedious rubbish.
Perhaps you would like to suggest how the DMI temperature graph is misleading as you claim. It is what it is - and clearly demonstrates the melt season has been on the cold side compared to the average line, after a superheated exceptional El Nino winter. They actually go back to the 1950s when the melt season was possibly a bit warmer.
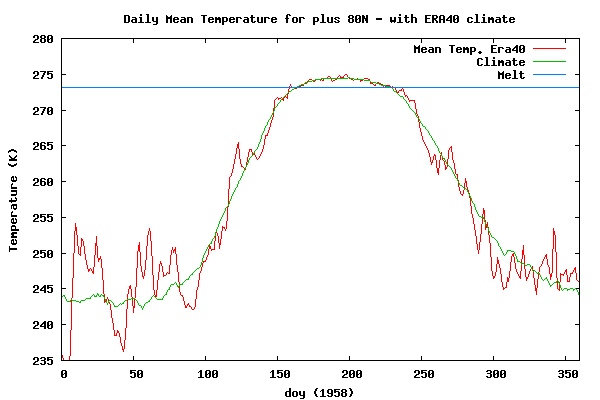
In fact some years like 2010, it's strangely hard to see that's it's that much warmer at all!

So not actually that much colder in 1958, but less ice, maybe, or maybe not, see submarine below!
DMI shows Arctic Ice volume smack on their 10 year average for the whole of July.
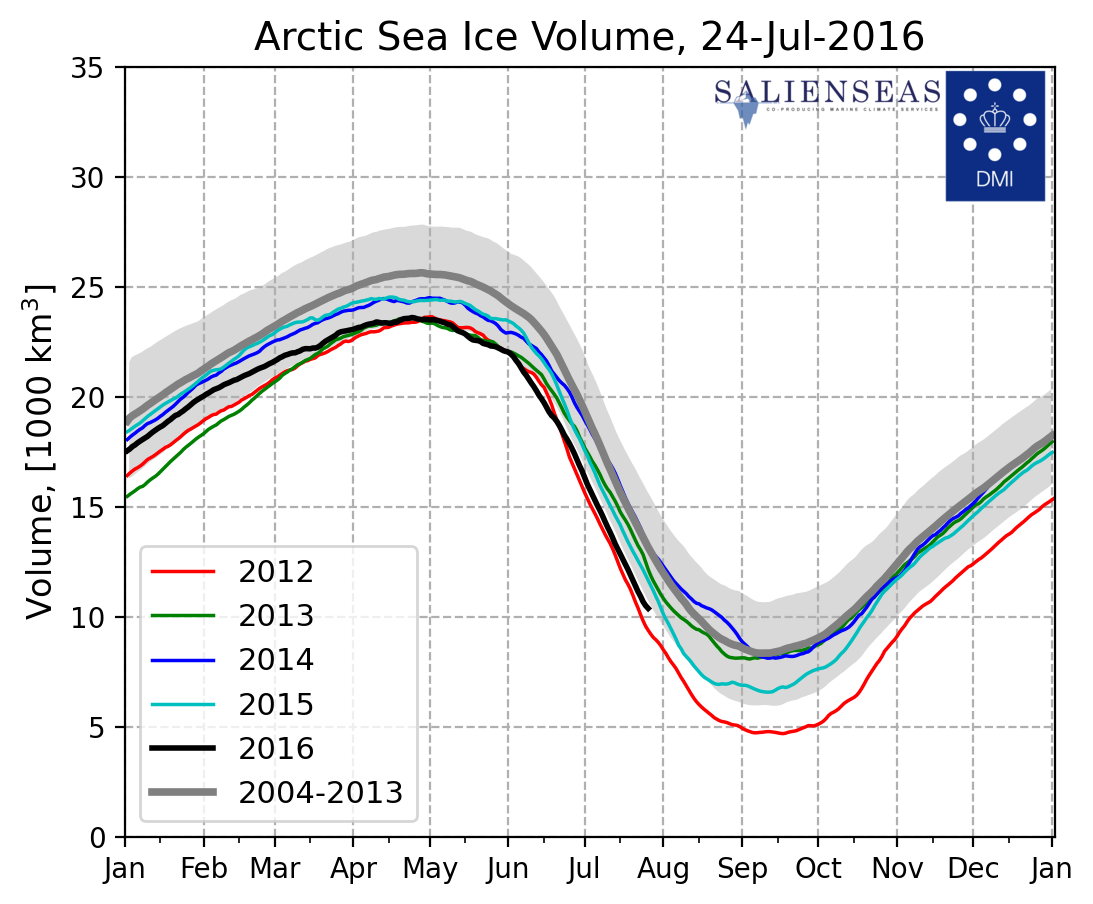
(Yes its hiding under the grey line in the middle).
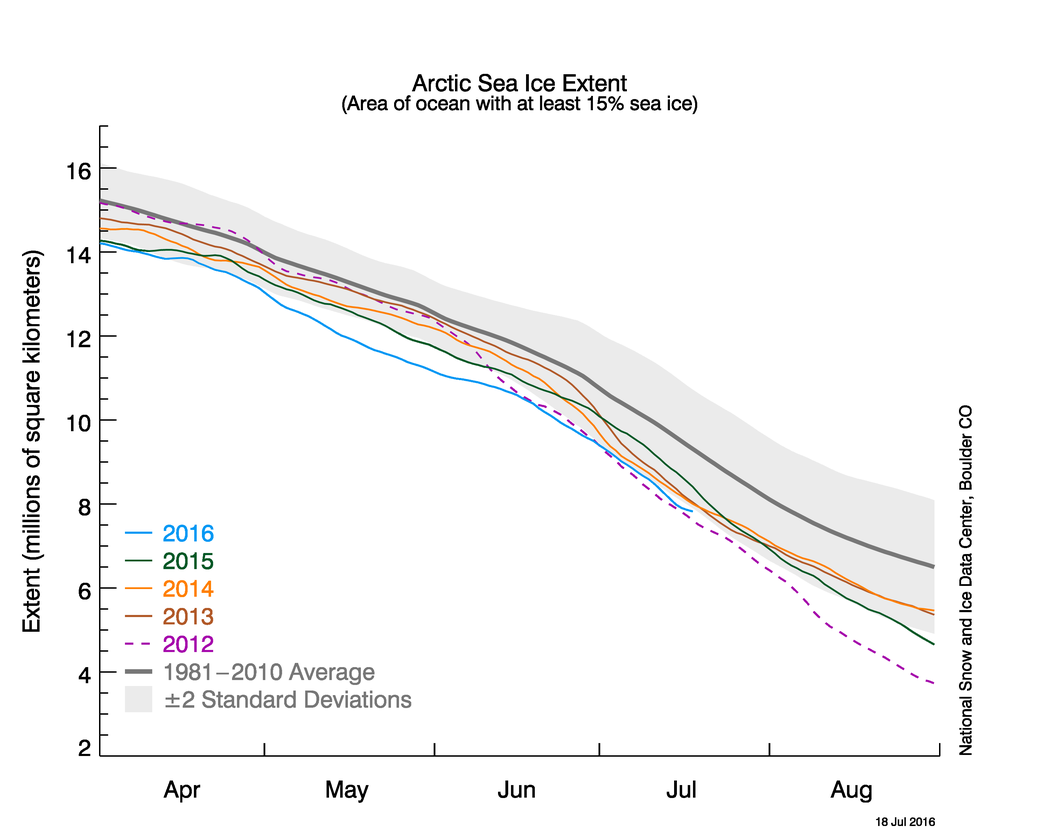
Various other sources show Arctic ice extent on a level with the last 7 - 10 years. There is certainly no acceleration in decline, blatantly the decline has ceased for a decade - you will of course CHOOSE to interpret things differently. (DMI & NSIDC have been fiddling/revising their extent data for technical failure and coastal mask changes all season, so take that with a pinch of salt.)

And Arctic ice isn't 'vulnerable', now that really does give away the unscientific motives of the people purveying emotions as science. And saying it has "never been thinner" is untrue - blatantly. We have no idea what ice was like before the 1970s, the old ice charts are assumed boundaries and sporadic obs., and some of those obs indicate periods of dramatic decline. There have been several periods when it was likely Arctic ice was under 2m at the thickest in the 20th C. - less than today. And clearly ~6K years ago there was likely no summer ice at all. The infamous 1950s Polar submarine surfacing incident broke though only 2ft of ice at the North Pole, and reported only 6-8ft elsewhere.
All the main purveyors of Antarctic ice extent products showed it about average.
It's not my fault you are too thick to know the difference between extent and mass. Although I think you'll find there is plenty of opinion that Antarctica is just fine mass wise too "NASA Study: Mass Gains of Antarctic Ice Sheet Greater than Losses - Oct 2015". And gain/lose, it's obviously nothing to do with temperature as Antarctica has not warmed in the entire satellite record.
As for your globe of warming, proves the point about dishonest pointless alarmism doesn't it, they have to paint 0.1C increments scary orange/red - because in reality on a graph with a zero axis you could hardly see the temperature line move! And the degree of Arctic warming is debatable (see DMI temperature graphs above). The current ice level/warming is probably more linked to the warm phase of the AMO than CO2.
The whole globe has cooled more than 0.5C in a few months, when it went up than much, climate alarmists like Schmidt went ape. Well he's not singing now!
As for picking on the idiom 'as nature intended', do you have English language GCSE? I doubt it, as you clearly don't understand what it means - if you think it means to suggest nature has a will and a conscience, then you are utterly bonkers or ignorant beyond belief.
So more of your extremely prejudiced baseless argumentative drivel durbster, you really must try harder.
 Too easy man, too easy.
For the record, I won't be responding to whatever mendacious pedantic point you try to dig out of this lot next.
Edited by Mr GrimNasty on Monday 25th July 21:08

Oh dear Grim.
All I did was post a larger snapshot of the data and findings from the organisations you're quoting, to put your post into context. They are not my findings so your personal attacks are as misjudged as ever.
What is remarkable is that you seem unable to comprehend that not a single one of the organisations you're cherry picking data from agree with your claims. Not one.
This means either you are doing it wrong, or they are. Can you really be so arrogant to think your analysis of their data is more valid then theirs?
Mr GrimNasty said:
in reality on a graph with a zero axis you could hardly see the temperature line move
 I always laugh when I see some of the Armageddon type graphs where the y axis goes from 20-25 or some such - to make it properly scientific why not start at zero Kelvin rather than even Celcius! Flat line = panic over
mondeoman said:
No scathing comment on this Durbs?
You had something to say on everything else, but missed this. Come on, fill yer boots...
To be honest, I wasn't really sure what the point of that one was. You had something to say on everything else, but missed this. Come on, fill yer boots...
And for the record, there were no scathing comments in my post, just information.
Gassing Station | News, Politics & Economics | Top of Page | What's New | My Stuff