Climate change - the POLITICAL debate. Vol 3
Discussion


durbster said:
DibblyDobbler said:
I tried my best but probably to no avail:
Did you read this blog post from the source of the satellite data?Dibbly said:
Umm - now let me see.... Oh yes! Because there is no climate change - don't believe me, believe satellite data: http://www.climatedepot.com/.../satellites-no-glob...
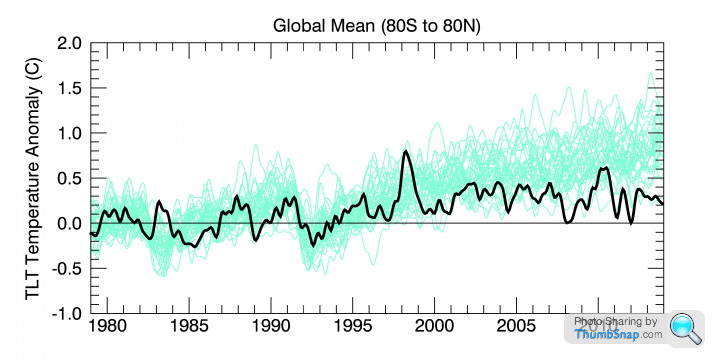
http://www.remss.com/blog/recent-slowing-rise-glob...
RSS said:
Does this slow-down in the warming mean that the idea of anthropogenic global warming is no longer valid? The short answer is ‘no’.
The point about cherry picking the start date does have some validity but I think we can all agree that not much warming seems to have happened in recent years?
"...the models weren't wrong it's just because other stuff happened..."
Does that mean that climate models can be right by not matching reality due to stuff that happened?! Why was the stuff not in the models?
Stuff not being in models makes them inadequate. Model output parting company with reality makes them wrong.
Any other view is bizarre, frankly.
Does that mean that climate models can be right by not matching reality due to stuff that happened?! Why was the stuff not in the models?
Stuff not being in models makes them inadequate. Model output parting company with reality makes them wrong.
Any other view is bizarre, frankly.
DibblyDobbler said:
Pick any long standing rural unadjusted high quality surface weather station, and the data will prove it was as warm, if not warmer than it is now, prior to the start of that graph.
DibblyDobbler said:
Thanks - no I hadn't read that. I kind of don't follow the logic though... observed temperatures (ie the thick black line) are clearly below the model predictions (the thin blue lines) but the models weren't wrong it's just because other stuff happened. Does that sum it up?
The point about cherry picking the start date does have some validity but I think we can all agree that not much warming seems to have happened in recent years?
I think his last paragraph is a fair summary:The point about cherry picking the start date does have some validity but I think we can all agree that not much warming seems to have happened in recent years?
RSS said:
I’ll conclude by reiterating that I do not expect that the hiatus and model/observation discrepancies are due to a single cause. It is far more likely that they are caused by a combination of factors. Publications, blog posts and media stories that try to pin all the blame on one factor should be viewed with some level of suspicion, whether they are written by climate scientists, journalists, or climate change denialists.
Which I think is basically conceding that the climate is just really bloody complicated and further study is needed (naturally - he's a scientist  ). There are so many factors that their combined effect can be greater than the sum of the individual elemenst.
It's also worth bearing in mind how the satellite temperature data is reached. Obviously RSS would imply a lack of confidence in their methods but it's a mind-bogglingly complex process that produces their temperature figures; certainly compared to sticking a thermometer in a cow field and looking at it every now and again.
When all's said and done, it seems clear that we just need to improve the models by collecting more data (not less, as seems to be advocated in here).
Previously published in this forum by me, a computer model containing ALL the variables would, using the most powerful computer on planet earth, would take longer than Earth has existed to produce ONE answer. You should know by now that the climate is what's known as a mathmatical chaotic system, thus PAST data is of no use for future projections (predictions). So forget that line of exploration.
Mr GrimNasty said:
The other thing about that graph is if you could extend it back, a lot of it would be all above the line, higher than it is now.
Here's the RSS data back to the start:http://woodfortrees.org/plot/rss/from:1978/to:2016...
Mr GrimNasty said:
Pick any long standing rural unadjusted high quality surface weather station, and the data will prove it was as warm, if not warmer than it is now, prior to the start of that graph.
Can you suggest one?Because I've looked at loads and there are very few that were warmer in the past:
http://www.ncdc.noaa.gov/temp-and-precip/divisiona...
durbster said:
robinessex said:
You should know by now that the climate is what's known as a mathmatical chaotic system, thus PAST data is of no use for future projections (predictions). So forget that line of exploration.
If that's true, how did we figure out how to grow crops?
turbobloke said:
"...the models weren't wrong it's just because other stuff happened..."
Does that mean that climate models can be right by not matching reality due to stuff that happened?! Why was the stuff not in the models?
Stuff not being in models makes them inadequate. Model output parting company with reality makes them wrong.
Any other view is bizarre, frankly.
Yes agreed - my comment was an attempt at irony Does that mean that climate models can be right by not matching reality due to stuff that happened?! Why was the stuff not in the models?
Stuff not being in models makes them inadequate. Model output parting company with reality makes them wrong.
Any other view is bizarre, frankly.

durbster said:
Which I think is basically conceding that the climate is just really bloody complicated and further study is needed (naturally - he's a scientist ). There are so many factors that their combined effect can be greater than the sum of the individual elemenst.
It's also worth bearing in mind how the satellite temperature data is reached. Obviously RSS would imply a lack of confidence in their methods but it's a mind-bogglingly complex process that produces their temperature figures; certainly compared to sticking a thermometer in a cow field and looking at it every now and again.
When all's said and done, it seems clear that we just need to improve the models by collecting more data (not less, as seems to be advocated in here).
interesting to hear a scientist using the denier word. i have a strange longing to meet either a climate scientist or one of those eco mentalists that likes to throw the denier insults around. unfortunately there does not seem to be many on the east coast of scotland, though i might get lucky and bump into that clown attp in edinburgh one day. ). There are so many factors that their combined effect can be greater than the sum of the individual elemenst.It's also worth bearing in mind how the satellite temperature data is reached. Obviously RSS would imply a lack of confidence in their methods but it's a mind-bogglingly complex process that produces their temperature figures; certainly compared to sticking a thermometer in a cow field and looking at it every now and again.
When all's said and done, it seems clear that we just need to improve the models by collecting more data (not less, as seems to be advocated in here).
i think they will get the "den" bit out before they land on their arse spitting teeth, that is the beauty of not being an academic, i don't do ad hom tennis
you do know that it is unlikely there will ever be enough computing power on earth to realistically model the climate ? for all the papers based on reanalysis data that are out there, still no physical proof of the anthropogenic portion of the recent warming trend followed by a hiatus ,plateau,stop, halt, cease, whatever you want to call it, of said warming. the meme was, increasing levels of atmospheric CO2 would result in increasing atmospheric temperatures . the way CO2 was posited to warm the atmosphere does not allow for anything else to override it. it was supposed to be the all governing control of earths temperature. all the recent s
 te regarding natural variation is straw clutching as they get increasingly in over their heads.
durbster said:
Mr GrimNasty said:
The other thing about that graph is if you could extend it back, a lot of it would be all above the line, higher than it is now.
Here's the RSS data back to the start:http://woodfortrees.org/plot/rss/from:1978/to:2016...
Mr GrimNasty said:
Pick any long standing rural unadjusted high quality surface weather station, and the data will prove it was as warm, if not warmer than it is now, prior to the start of that graph.
Can you suggest one?Because I've looked at loads and there are very few that were warmer in the past:
http://www.ncdc.noaa.gov/temp-and-precip/divisiona...
Should I be worried?
How long have I got left?
Should I be worried by the faster jet stream that Matt McGrath reported, or should I be worried about the slower jet stream that Matt McGrath reported?
durbster said:
Mr GrimNasty said:
The other thing about that graph is if you could extend it back, a lot of it would be all above the line, higher than it is now.
Here's the RSS data back to the start:http://woodfortrees.org/plot/rss/from:1978/to:2016...
Mr GrimNasty said:
Pick any long standing rural unadjusted high quality surface weather station, and the data will prove it was as warm, if not warmer than it is now, prior to the start of that graph.
Can you suggest one?Because I've looked at loads and there are very few that were warmer in the past:
http://www.ncdc.noaa.gov/temp-and-precip/divisiona...
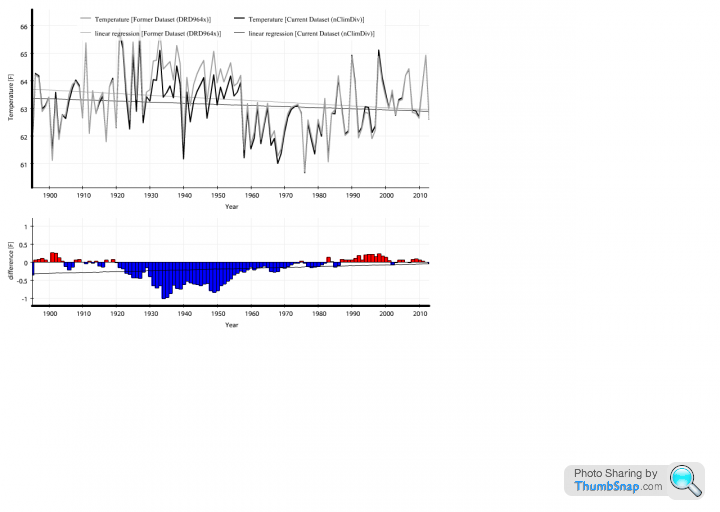
Using the Temps for the entire state of Alabama for the years 1895 to 2013 with a regression line and a 10-year slope measurement. But that, of course, is a mere bagatelle going back - as it does - to 1895. There are other examples that go back a little further than that; ones also that aren't tainted by Mannian short-centred stat analysis and cherry-picked tree rings. Like this:
http://rps3.com/Files/AGW/VOSTOK-DOMECIceCoreCompa...
I sometimes think too much time is wasted frothing at the mouth looking at temperature charts, longing for your desired outcome.
Some people forget that temperature only has 3 options - static, rise, fall.
That means there's a 33.3% chance of either occurring.
We are told that CO2 is the evil trace gas that will result in global warming.
Atmospheric CO2 has increased, so if by 33.3% chance the past 20 years had shown a significant rise in temperature, causality would be assumed to be CO2. The graphs would match but the assumption would actually be nonsense, no more than coincidence. This is the danger as I see it, in frothing at the mouth following temperature charts.
As it happens, CO2 has increased and temperature has not, but still just as likely to be by coincidence, there's just as much chance it could have dropped.
What it does seem to indicate is that CO2 is not having its predicted warming effect, yet for some reason we're still being daily bombarded with warmist fed media junk warming stories.
It's hard to reason why, but I guess there's a vast coalition of vested warmist interests that are going to die hard.
robinessex said:
Previously published in this forum by me, a computer model containing ALL the variables would, using the most powerful computer on planet earth, would take longer than Earth has existed to produce ONE answer. You should know by now that the climate is what's known as a mathmatical chaotic system, thus PAST data is of no use for future projections (predictions). So forget that line of exploration.
...and the answer would be 42...deeps said:
That means there's a 33.3% chance of either occurring.
...in a truly random system.Climate is a chaotic system but not truly random - there are driving forces that will mean change in a specific direction - it may be a long-term warming trend as we move through our current interglacial period, possibly coming out of the current ice-age in a few hundreds of thousand of years or it may be time to dip back into full frosty in the next 10k...
If we're in a natural phase that's part of the interglacial the I'd expect there to be a long-term warming trend - it's the 'looking for a reason' that's worrisome if/when the reason is wrong and we drive damaging policy from it. I have little issue with the pursuit of clean energy, reduction in pollution and wise resource usage - they're laudable goals when done in a manner that is sustainable. The short-term outlook we're all guilty of favouring has meant a bandwagon jump onto tech that's just not ready (wind, solar) and may never be viable - the cost of wind is more than the financial, it's ugly and short-term. Solar currently involves more pollution that greens like to admit and uses very rare resources at an alarming rate.
I formed an opinion back in my teens that we should be investing heavily in nuclear power stations and more so in research, I'm even more strongly of this view now but sadly the investment hasn't materialised and the UK has given up its skills.
robinessex said:
durbster said:
robinessex said:
You should know by now that the climate is what's known as a mathmatical chaotic system, thus PAST data is of no use for future projections (predictions). So forget that line of exploration.
If that's true, how did we figure out how to grow crops?Gassing Station | News, Politics & Economics | Top of Page | What's New | My Stuff