Climate change - the POLITICAL debate. Vol 3
Discussion


robinessex said:
lionelf said:
robinessex said:
This is a cover-up of the fact that NASA does not know what keeps airplanes in the air, which of course cannot be admitted.
Oh, the irony !!!
Do you steer clear of planes then? If not, why not?Oh, the irony !!!
Geddit?
lionelf said:
robinessex said:
lionelf said:
robinessex said:
This is a cover-up of the fact that NASA does not know what keeps airplanes in the air, which of course cannot be admitted.
Oh, the irony !!!
Do you steer clear of planes then? If not, why not?Oh, the irony !!!
Geddit?

durbster said:
Just on that specific point, every single temperature dateset there is shows warming. I'm curious as to why you think that isn't the case?
I had a look to remind myself.This WSJ article covers it.
http://www.wsj.com/articles/matt-ridley-whatever-h...
Shows warming from when to when? Also the presence of a minor warming trend shows nothing but the presence of a minor warming trend, these have occurred countless times over various timescales before industrialisation. There's no causality in a trend per se.
On a related matter, for the gridded near-surface data where 'they all show...' this is hardly surprising as the datasets are NOT independent.
See 'An Erroneous Statement Made By Phil Jones To The Media On The Independence Of The Global Surface Temperature Trend Analyses Of CRU, GISS And NCDC' from now-retired but then active climatologist Prof R Pielke Sr.
https://pielkeclimatesci.wordpress.com/2009/11/25/...
Regardless of any unremarkable microtrend (UAH LTT +0.11 deg C per decade) when the temperature has already (2011) fallen below the "zero emissions" scenario IPCC 1990-95 and coupled carbon-climate models are unable to predict carbon dioxide levels in 2100 to within 300 ppm, it's time for warnists to cool off. As suggested by the same IPCC
On a related matter, for the gridded near-surface data where 'they all show...' this is hardly surprising as the datasets are NOT independent.
See 'An Erroneous Statement Made By Phil Jones To The Media On The Independence Of The Global Surface Temperature Trend Analyses Of CRU, GISS And NCDC' from now-retired but then active climatologist Prof R Pielke Sr.
https://pielkeclimatesci.wordpress.com/2009/11/25/...
Prof Pielke said:
The differences between the three global surface temperatures that occur are a result of the analysis methodology as used by each of the three groups. They are not “completely independent”.
This is further explained (in) the CCSP report where it is written with respect to the surface temperature data (as well as the other temperature data sets) that
“Since the three chosen data sets utilize many of the same raw observations, there is a degree of interdependence.”
That's that sorted (again).This is further explained (in) the CCSP report where it is written with respect to the surface temperature data (as well as the other temperature data sets) that
“Since the three chosen data sets utilize many of the same raw observations, there is a degree of interdependence.”
Regardless of any unremarkable microtrend (UAH LTT +0.11 deg C per decade) when the temperature has already (2011) fallen below the "zero emissions" scenario IPCC 1990-95 and coupled carbon-climate models are unable to predict carbon dioxide levels in 2100 to within 300 ppm, it's time for warnists to cool off. As suggested by the same IPCC
IPCC TAR Ch14 said:
The climate system is a coupled non-linear chaotic system, and therefore the long-term prediction of future climate states is not possible.


...meanwhile, analysis finds July 2016 is the warmest in 136 years of record keeping. “It appears almost a certainty that 2016 also will be the warmest year on record.”
http://climate.nasa.gov/news/2479/nasa-analysis-fi...
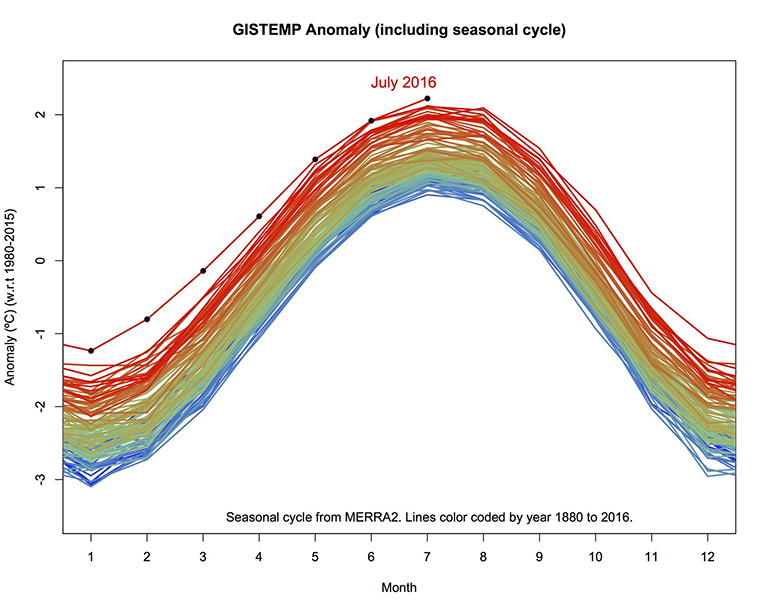
http://climate.nasa.gov/news/2479/nasa-analysis-fi...
LongQ said:
Who?
I don't know why you'd be interested in credentials on this thread  but here's an overview
http://www.haydenplanetarium.org/tyson/curriculum-...
XJ40 said:
...meanwhile, analysis finds July 2016 is the warmest in 136 years of record keeping. “It appears almost a certainty that 2016 also will be the warmest year on record.”
http://climate.nasa.gov/news/2479/nasa-analysis-fi...
That has to be one of the dodgiest graphs ever seen - right up there with "hide the decline".http://climate.nasa.gov/news/2479/nasa-analysis-fi...
Hardly a surprise I suppose.
The claims about the time extent of the records and the various sources are unlikely to look so convincing if assessed for the whole period. Certainly not to the level of a "calculated" global anomaly of an "average" temperature supposedly accurate, for political policy purposes, to 1/10th of a degree (rounded?)
Where are the error bars?
XJ40 said:
...meanwhile, analysis finds July 2016 is the warmest in 136 years of record keeping. “It appears almost a certainty that 2016 also will be the warmest year on record.”
http://climate.nasa.gov/news/2479/nasa-analysis-fi...
1. The appearance of a record temperature, even a short timescale record, confers no causality to humanshttp://climate.nasa.gov/news/2479/nasa-analysis-fi...
2. Do we know if the numbers used for this were in violation of NASA's own data quality controls as well as the Federal Data Quality Act and OMB Guidelines, bearing in mind the lessons of history:
https://climateaudit.org/2007/12/28/nasa-evasion-o...
3. A strong El Nino (natural) has contributed to 2015 and 2016. This will of course be pointed out everywhere not just on PH
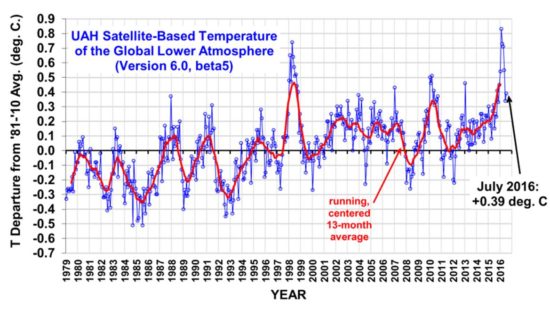
4. More context from a secondary source with primary source data in play (e.g. UAH, GISS LOTI, HADCRUT4):
https://wattsupwiththat.com/2016/08/16/july-2016-g...
5. UAH LTT satellite temps put July 2016 as only the second warmest on record
so it'll be interesting to see what the position is at the end of 20166. UAH LTT satellite data plot from Dr Roy Spencer, all three main peaks are El Nino events
LongQ said:
That has to be one of the dodgiest graphs ever seen - right up there with "hide the decline".
Hardly a surprise I suppose.
The claims about the time extent of the records and the various sources are unlikely to look so convincing if assessed for the whole period. Certainly not to the level of a "calculated" global anomaly of an "average" temperature supposedly accurate, for political policy purposes, to 1/10th of a degree (rounded?)
Where are the error bars?
Shhhh don't ask...but since you did Hardly a surprise I suppose.
The claims about the time extent of the records and the various sources are unlikely to look so convincing if assessed for the whole period. Certainly not to the level of a "calculated" global anomaly of an "average" temperature supposedly accurate, for political policy purposes, to 1/10th of a degree (rounded?)
Where are the error bars?
the near-surface temperature data comes with an accuracy of ± 0.07 deg C at the 95% confidence level in recent years.As the the previous record for July, set in 2015, is said to be beaten by 0.06 deg C in July 2016 this makes the error bar question a good one
More generally for 2016 as a whole, the next question not to ask is what impact has arisen from the nonsensical move from buoy SST temperatures to less accurate and heat-contaminated ship intakes.
turbobloke said:
LongQ said:
That has to be one of the dodgiest graphs ever seen - right up there with "hide the decline".
Hardly a surprise I suppose.
The claims about the time extent of the records and the various sources are unlikely to look so convincing if assessed for the whole period. Certainly not to the level of a "calculated" global anomaly of an "average" temperature supposedly accurate, for political policy purposes, to 1/10th of a degree (rounded?)
Where are the error bars?
Shhhh don't ask...but since you did Hardly a surprise I suppose.
The claims about the time extent of the records and the various sources are unlikely to look so convincing if assessed for the whole period. Certainly not to the level of a "calculated" global anomaly of an "average" temperature supposedly accurate, for political policy purposes, to 1/10th of a degree (rounded?)
Where are the error bars?
the near-surface temperature data comes with an accuracy of ± 0.07 deg C at the 95% confidence level in recent years.As the the previous record for July, set in 2015, is said to be beaten by 0.06 deg C in July 2016 this makes the error bar question a good one
More generally for 2016 as a whole, the next question not to ask is what impact has arisen from the nonsensical move from buoy SST temperatures to less accurate and heat-contaminated ship intakes.
Or should I not ask?
With regard to claims for recent warming from politicised sources, it's timely to offer another pointer to Fife et al.
"Overestimated global warming over the past 20 years" Fife et al, Nature Climate Change 3, 767–769 (2013)
The authors show that difference between observations and model output is even greater than earlier discrepancies for the period 1998-2012, for which the observed trend of +0.05 deg C per decade (zero in effect, given the magnitude of the ± error involved, hence The Pause) contrasts with a simulated trend of +0.21 deg C per decade which is only a factor of 4 out. Further statistical testing cited supports the finding that climate models do not succeed in simulating the data from observations.
Gassing Station | News, Politics & Economics | Top of Page | What's New | My Stuff