Climate change - the POLITICAL debate. Vol 3
Discussion


dub16v said:
The fact that you have to ask this question (re impacts) and you confuse 'weather' with 'climate' is a little telling re both your points. Here are a few examples of impacts that we're seeing already (it is by no means an exhaustive list - see links below for some useful summaries). Note also, that there are other drivers of changes to species and plant communities (e.g. land use change being an important one, particularly for birds) but in each of the cases below it is possible to disaggregate the causes.
Example impacts:
-Many species are now found further north in the UK, including some which have colonised large parts of the UK from continental Europe (see Morecroft and Speakman, 2015). These are mainly 'warm-loving' species such as damselflies, dragonflies, butterflies etc. Hickling et al (2006) provide an analysis of changes due to climate for over 300 species. Tl:dr: >200 shifted northward with changes in temperature (some also moved to lower altitudes where it is cooler).
-Also, there have been changes in the composition of some plant, microbial and animal communities, consistent with different responses to rising temperatures (ibid). Some plant species are increasing in their range e.g. bee orchid.
-Increasing river temperatures over the last three decades have led to changes in fish communities and riverine vegetation (that are important for providing shade, soil stability and filtration) (see JNCC, 2010)
-Long-term monitoring of mountain vegetation has shown a general decline in the cover and frequency of some specialist arctic-alpine lichen and plant species in mountain-top environments (e.g. dwarf willow, stiff sedge).
-Many bird populations are also moving northwards which has been proven to correspond with a periodic shift in temperature (see Thomas and Lennon, 1999).
^Those are just a few examples that spring to mind. There are various synthesis papers about that you can read e.g. JNCC (2010) (http://jncc.defra.gov.uk/page-5145), NERC impact cards (Morecroft and Speakman, 2015 - http://www.nerc.ac.uk/research/partnerships/ride/l... and the latest UK CC risk assessment (here: https://www.theccc.org.uk/tackling-climate-change/... to name a few.
Hope this is of interest/useful.
edit: dead link corrected.
this might be teaching my granny to suck eggs , but it looks like you are unaware the temperate zone expands and contracts in line with the warmer and cooler ocean cycles . if you check back in history these climate shifts have happened previously with movements of fish populations etc. the old adage nothing new under the sun applies.Example impacts:
-Many species are now found further north in the UK, including some which have colonised large parts of the UK from continental Europe (see Morecroft and Speakman, 2015). These are mainly 'warm-loving' species such as damselflies, dragonflies, butterflies etc. Hickling et al (2006) provide an analysis of changes due to climate for over 300 species. Tl:dr: >200 shifted northward with changes in temperature (some also moved to lower altitudes where it is cooler).
-Also, there have been changes in the composition of some plant, microbial and animal communities, consistent with different responses to rising temperatures (ibid). Some plant species are increasing in their range e.g. bee orchid.
-Increasing river temperatures over the last three decades have led to changes in fish communities and riverine vegetation (that are important for providing shade, soil stability and filtration) (see JNCC, 2010)
-Long-term monitoring of mountain vegetation has shown a general decline in the cover and frequency of some specialist arctic-alpine lichen and plant species in mountain-top environments (e.g. dwarf willow, stiff sedge).
-Many bird populations are also moving northwards which has been proven to correspond with a periodic shift in temperature (see Thomas and Lennon, 1999).
^Those are just a few examples that spring to mind. There are various synthesis papers about that you can read e.g. JNCC (2010) (http://jncc.defra.gov.uk/page-5145), NERC impact cards (Morecroft and Speakman, 2015 - http://www.nerc.ac.uk/research/partnerships/ride/l... and the latest UK CC risk assessment (here: https://www.theccc.org.uk/tackling-climate-change/... to name a few.
Hope this is of interest/useful.
edit: dead link corrected.
Edited by dub16v on Friday 2nd December 13:12
Edited by dub16v on Friday 2nd December 13:13
Mr GrimNasty said:
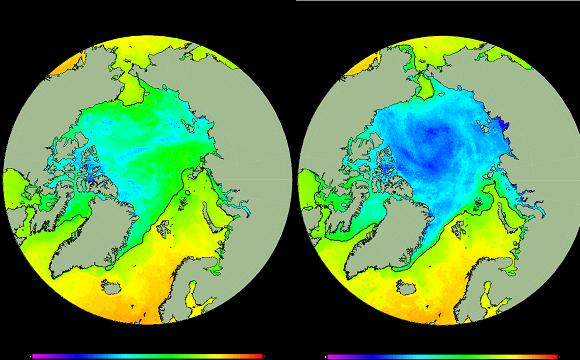
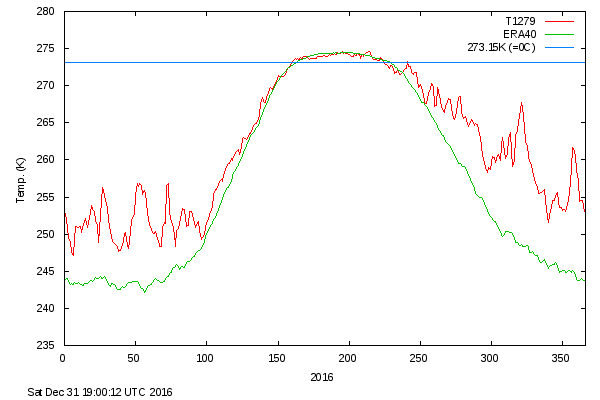
BBC has just produced a report on the 'incredible warmth' in the Arctic today, but they truncated their temperature graph 2 weeks ago. Here's why - the temperature has gone off a cliff edge - and the extreme cold in Russia/Asia is still there too!
2 weeks ago on left averaging -5C, current on the right averaging blow -20C, dark blue=-35C, yellowy-green=0C - ice extent will rapidly expand as there is loads of sea surface already at/below 0. Extent/volume is already same as last year more or less according to DMI, although the political/Greenpeace pals at NSIDC with their wonky satellite 'adjusted' to fit with the last sensor have it suspiciously lower.
It's just a slightly unusual weather event, temperature is now back in a perfectly normal range, albeit on the warm side of average and still dropping!
Up to a day or 2 either aside, it was as warm in the Arctic as today in 1959, 1962, 1965, 1966, 1967............
it wouldn't surprise me if we see an extended freezing season next spring in the arctic .2 weeks ago on left averaging -5C, current on the right averaging blow -20C, dark blue=-35C, yellowy-green=0C - ice extent will rapidly expand as there is loads of sea surface already at/below 0. Extent/volume is already same as last year more or less according to DMI, although the political/Greenpeace pals at NSIDC with their wonky satellite 'adjusted' to fit with the last sensor have it suspiciously lower.
It's just a slightly unusual weather event, temperature is now back in a perfectly normal range, albeit on the warm side of average and still dropping!
Up to a day or 2 either aside, it was as warm in the Arctic as today in 1959, 1962, 1965, 1966, 1967............
mybrainhurts said:
London424 said:
How do you read that without a subscription?Mr GrimNasty said:
It's just a slightly unusual weather event, temperature is now back in a perfectly normal range, albeit on the warm side of average and still dropping!
Up to a day or 2 either aside, it was as warm in the Arctic as today in 1959, 1962, 1965, 1966, 1967............
But in those years todays fallen temperature were warm peaks back then weren't they, so it's an odd kind of 'normal'.Up to a day or 2 either aside, it was as warm in the Arctic as today in 1959, 1962, 1965, 1966, 1967............
The UAH satellite data for November is out and as expected it was up a bit on October - rumours of plummetting temps not showing up in the global average, pretty stable since May/June. Warmest November in the record.
plunker said:
Mr GrimNasty said:
It's just a slightly unusual weather event, temperature is now back in a perfectly normal range, albeit on the warm side of average and still dropping!
Up to a day or 2 either aside, it was as warm in the Arctic as today in 1959, 1962, 1965, 1966, 1967............
But in those years todays fallen temperature were warm peaks back then weren't they, so it's an odd kind of 'normal'.Up to a day or 2 either aside, it was as warm in the Arctic as today in 1959, 1962, 1965, 1966, 1967............
The UAH satellite data for November is out and as expected it was up a bit on October - rumours of plummetting temps not showing up in the global average, pretty stable since May/June. Warmest November in the record.
plunker said:
But in those years todays fallen temperature were warm peaks back then weren't they, so it's an odd kind of 'normal'.
The UAH satellite data for November is out and as expected it was up a bit on October - rumours of plummetting temps not showing up in the global average, pretty stable since May/June. Warmest November in the record.
The plummeting temperatures are very evident in that graph - remember according to warmists El Nino was not resposible for that spike, so how did the spike drop so far already - and why were the same claims not made in 1998 - the urgency of the politics (Paris agreement) necessitated the lie, that's why.The UAH satellite data for November is out and as expected it was up a bit on October - rumours of plummetting temps not showing up in the global average, pretty stable since May/June. Warmest November in the record.
The temperature 8/9 month rate of fall is record breaking in land and satellite data, the SSTs are lagging as expected but are clearly dropping too.
2016 will be a statistical tie with 1998 - confirming no global warming for near 2 decades despite 1/3 of all CO2 ever produced by man pumped out in that time.
The arctic is perfectly normal, as I said, freak random weather ONE YEAR is nothing but freak random weather - it is probably witness to heat being transported from the oceans to the arctic and radiating to space - SSTs dropping rapidly to catch up land. Chaotic systems throw out big random deviations anyway. If there were a serious climate disruption - the situation would not spontaneously 'normalise'.
The average Arctic temperature is still not significntly different c1940 - the last warm peak.
Interesting how this view of Arctic Ice extent from 1985 gov. research is nothing like the claims made now, note the variation and sometimes low levels.
Ice volume is same as last year, extent a fraction down but increasing fantastically fast at the moment.
Dropping about 1.5C a day over an enormous area for several weeks.
Meanwhile the data tampering gets more and more ridiculous.
http://realclimatescience.com/2016/12/december-bri...
robinessex said:
plunker said:
Mr GrimNasty said:
It's just a slightly unusual weather event, temperature is now back in a perfectly normal range, albeit on the warm side of average and still dropping!
Up to a day or 2 either aside, it was as warm in the Arctic as today in 1959, 1962, 1965, 1966, 1967............
But in those years todays fallen temperature were warm peaks back then weren't they, so it's an odd kind of 'normal'.Up to a day or 2 either aside, it was as warm in the Arctic as today in 1959, 1962, 1965, 1966, 1967............
The UAH satellite data for November is out and as expected it was up a bit on October - rumours of plummetting temps not showing up in the global average, pretty stable since May/June. Warmest November in the record.

Here's another example of the shameless hypocrisy in this debate that I can't get my head around.
We have a constant and relentless stream of posts saying the data has been deliberately corrupted (decent evidence yet to be presented but hey, it's a post-fact world now so who cares ).
).
Here are some examples from the last few pages.
playground argument: is temperature data reliable or not?
If this data has been corrupted then it is completely invalid. But where is the protest against that particular post from any of the posters I've quoted above? It's the same data set and yet not person has said it's not valid.
It also makes you wonder why, after all that "torturing" of data, it's still possible to pick out chunks that don't necessarily support AGW?
It looks very much like, for some people, the data is completely acceptable when it apparently shows something they might want to see.
We have a constant and relentless stream of posts saying the data has been deliberately corrupted (decent evidence yet to be presented but hey, it's a post-fact world now so who cares
). Here are some examples from the last few pages.
mondeoman said:
So reliable it has to be "adjusted for accuracy", but only ever upwards....
LongQ said:
However, if you want to suggest that most, perhaps all of the "data" used by everyone involved with the "climate science" debate is suspect due to the requirement to interpret "measurements" of Temperature via indirect sources...
Vantagemech said:
Perhaps we will see an increase in more upwardly adjusted data to show...
turbobloke said:
With hindsight and a spot of fiddlefactoring, probably, but the fiddlefactoring after-the-fact ...
Moonhawk said:
...they could skew the data so that it appears warmer than it actually is.
don4l said:
RSS and UAH are the only suppliers of unadjusted data that I know of.
Kawasicki said:
I just can't look past the adjusted/falsified data used by the scientists.
Mr GrimNasty said:
Change the data to fit the theory.
And then, amongst it all that same data is used in an effort to suggest the planet is not actually warming e.g.Mr GrimNasty said:
Just a reminder, as we keep getting all these scare stories about the Arctic, and now the Antarctic (which was ignored because of the inconvenient record ice levels until this year's dip) - neither is any warmer than the recent past and before the supposed influence of CO2 c.1950!
...
Of course, no rational person denies the planet is warming but I have a simple question for those on the sceptic side of the ...
If this data has been corrupted then it is completely invalid. But where is the protest against that particular post from any of the posters I've quoted above? It's the same data set and yet not person has said it's not valid.
It also makes you wonder why, after all that "torturing" of data, it's still possible to pick out chunks that don't necessarily support AGW?
It looks very much like, for some people, the data is completely acceptable when it apparently shows something they might want to see.
durbster said:
It also makes you wonder why, after all that "torturing" of data, it's still possible to pick out chunks that don't necessarily support AGW?
It looks very much like, for some people, the data is completely acceptable when it apparently shows something they might want to see.
Because even with all the torturing it still fails to completely tell the whole true story, as for the data being completely acceptable, see above from Mr Grim about the cherry picking from the BBC and the Arctic temperature, ask yourself why ?It looks very much like, for some people, the data is completely acceptable when it apparently shows something they might want to see.
durbster said:
Of course, no rational person denies the planet is warming but I have a simple question for those on the sceptic side of the playground argument: is temperature data reliable or not?
Hmmmm. So, not only is the science settled and the models absolutely correct, but anyone who says otherwise is irrational? Killer argument there, blurbs, killer argument.
Kawasicki said:
durbster said:
Of course, no rational person denies the planet is warming but I have a simple question for those on the sceptic side of the playground argument: is temperature data reliable or not?
Not s won't be happy until the economy is fked and we have frozen to death , and with the bird brained mongs in the government hanging of every daft pronouncement of these climate charlatins looks like we are doomed
durbster said:
If this data has been corrupted then it is completely invalid. But where is the protest against that particular post from any of the posters I've quoted above? It's the same data set and yet not person has said it's not valid.
.
Why not provide us with the raw data and we can see?.
Oh wait, those with this data won't give it out in the raw form. Only "adjusted...... I wonder why they won't give up the data which proves they are not lying.......
Jasandjules said:
durbster said:
If this data has been corrupted then it is completely invalid. But where is the protest against that particular post from any of the posters I've quoted above? It's the same data set and yet not person has said it's not valid.
.
Why not provide us with the raw data and we can see?.
Oh wait, those with this data won't give it out in the raw form. Only "adjusted...... I wonder why they won't give up the data which proves they are not lying.......
Mr GrimNasty said:
The plummeting temperatures are very evident in that graph - remember according to warmists El Nino was not resposible for that spike, so how did the spike drop so far already - and why were the same claims not made in 1998 - the urgency of the politics (Paris agreement) necessitated the lie, that's why.
It fell back to a low in June since when it's been quite stable and reversed up a bit in fact = not plummetting.I haven't seen anyone claiming El Nino wasn't responsible for the spike. That would be a stupid thing to say, so I doubt anyone said it.
Mr GrimNasty said:
The temperature 8/9 month rate of fall is record breaking in land and satellite data, the SSTs are lagging as expected but are clearly dropping too.
The RSS land data went up 0.23 in November. Seeing as the global av went up by 0.037 that means SST cooled by a few hundredths.Fresh from entertainingly calling the rise of Trump correctly, Dilbert is having a go at Climate Change:
http://blog.dilbert.com/post/154082416051/the-non-...
"If you ask me how scared I am of climate changes ruining the planet, I have to say it is near the bottom of my worries. If science is right, and the danger is real, we’ll find ways to scrub the atmosphere as needed. We always find ways to avoid slow-moving dangers. And if the risk of climate change isn’t real, I will say I knew it all along because climate science matches all of the criteria for a mass hallucination by experts. "
Gassing Station | News, Politics & Economics | Top of Page | What's New | My Stuff