Man shot dead on M62 in pre-planned police operation
Discussion


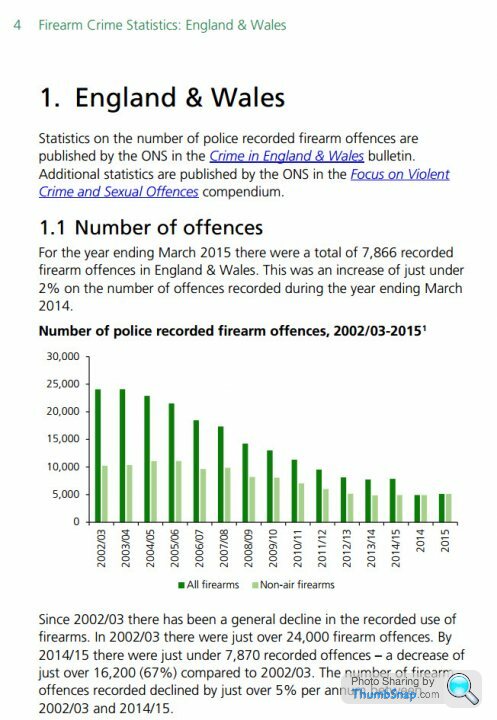
Just noticed as well, that dramatic looking chart is mainly for air rifles the actual non toy gun bars are the light green ones, not much change there is there? probably more in keeping with the police's favourite line "that's a civil matter sir"
And if I wanted an air rifle I would go to the toy shop and buy one, not dig one up.
And if I wanted an air rifle I would go to the toy shop and buy one, not dig one up.
mickmcpaddy said:
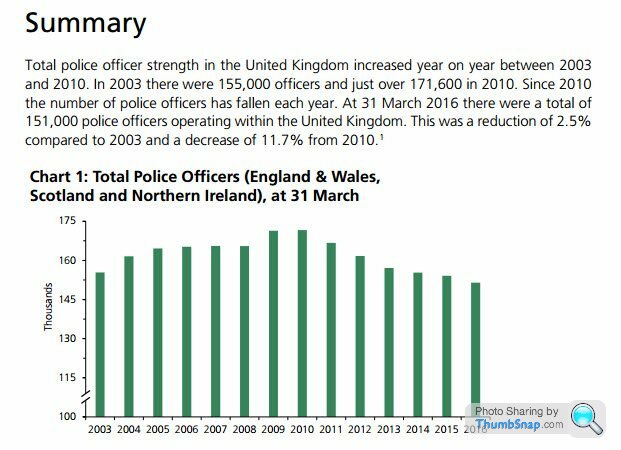
Wow a graph, that proves it then. I take it that lovely picture includes 100% of the crimes that have ever actually taken place and not just the recorded crimes like it states? Now show me a graph that shows the number of policemen employed over the same years, does it fall like your picture by any chance?
Yes a graph containing data to be assessed and weighted to form a conclusion. I did you one, too.
Edited by anonymous-user on Friday 3rd February 15:43
NickCQ said:
mickmcpaddy said:
Wow a graph, that proves it then. I take it that lovely picture includes 100% of the crimes that have ever actually taken place and not just the recorded crimes like it states? Now show me a graph that shows the number of policemen employed over the same years, does it fall like your picture by any chance?
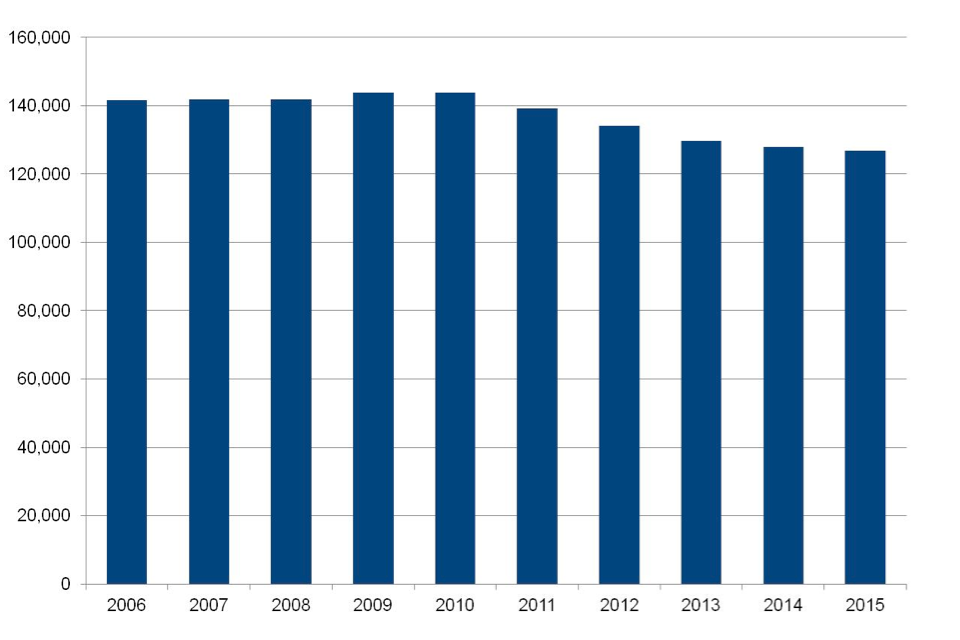
not exactlyFigure 4: Police officers, as at 31 March 2006 to 2015, England and Wales
https://www.gov.uk/government/publications/police-...
forget that I was looking at a different chart on the link, its from 2006 though, not 2002
Also it says police "workforce" not policemen.
Charts and statistics are stupid, it should be straight a forward question, have the number of police officers actually out on the beat and doing real police work preventing crimes, not sat at a desk somewhere dropped by circa 50% since 2002.
Edited by mickmcpaddy on Friday 3rd February 15:43
Edited by mickmcpaddy on Friday 3rd February 15:48
mickmcpaddy said:
Just noticed as well, that dramatic looking chart is mainly for air rifles the actual non toy gun bars are the light green ones, not much change there is there?
You're happy to use the data when it suits it seems. Only around 50% decrease... "Not much change", indeed.
The fact the majority is made-up of air rifles should give you a non-too-subtle hint...
mickmcpaddy said:
Thats over just 12 months, the gun grime graph is from 2002, I find it amazing the way people try to manipulate others with statistics.
What? Data goes back to 2006 on that graph. I'm not sure you have understood it. Maybe something happened between 2002-6 to change the overall picture substantially but I doubt it.mickmcpaddy said:
NickCQ said:
mickmcpaddy said:
Wow a graph, that proves it then. I take it that lovely picture includes 100% of the crimes that have ever actually taken place and not just the recorded crimes like it states? Now show me a graph that shows the number of policemen employed over the same years, does it fall like your picture by any chance?
not exactlyFigure 4: Police officers, as at 31 March 2006 to 2015, England and Wales
https://www.gov.uk/government/publications/police-...
forget that I was looking at a different chart on the link, its from 2006 though, not 2002
mickmcpaddy said:
Just noticed as well, that dramatic looking chart is mainly for air rifles the actual non toy gun bars are the light green ones, not much change there is there? probably more in keeping with the police's favourite line "that's a civil matter sir"
And if I wanted an air rifle I would go to the toy shop and buy one, not dig one up.
The pale green lime shows a decline of over 50% from peak, so fewer than half as many incidents during the 12 month period. I'd class that as a significant decline.And if I wanted an air rifle I would go to the toy shop and buy one, not dig one up.
NickCQ said:
La Liga said:
NickCQ said:
mickmcpaddy said:
its from 2006 though, not 2002
Nice edit. I really am a manipulative bEdited by mickmcpaddy on Friday 3rd February 15:43
 d, aren't I
Have the number of police officers actually on the beat and doing what the lay man would call doing what a police officer does reduced by about 50% since the early 2000s?
mickmcpaddy said:
Its taking too long to type the replies or edits before there are several new posts, there is a further edit above and its a simple question :-
Have the number of police officers actually on the beat and doing what the lay man would call doing what a police officer does reduced by about 50% since the early 2000s?
No, but what's your actual point? What does that have to do with 1) Whether or not firearms crime is as big a problem as you claim, 2) The firearms data presented. Have the number of police officers actually on the beat and doing what the lay man would call doing what a police officer does reduced by about 50% since the early 2000s?
I have a feeling you're going to make some totally speculative and unjust link, which will be such rubbish that I can't even speculate as to what it is.
I'm not going to link to anything but from having a good read through that data with all the pie charts it seems that in 2015 there were 94000 police officers available that you could assume would be on the beat although I'll bet about half are tied up with paperwork or court nonsense. From the other links it was about 14000 in the early part of this century wasn't it and I'll bet a much higher proportion were doing front line policing back then.
I stated in another thread I was happy to drive round without an expired MOT for 6 months because there was zero chance of getting a pull and I was right, twice. No police you see.
I stated in another thread I was happy to drive round without an expired MOT for 6 months because there was zero chance of getting a pull and I was right, twice. No police you see.
La Liga said:
mickmcpaddy said:
I'm not going to link to anything but from having a good read through that data with all the pie charts it seems that in 2015 there were 94000 police officers available that you could assume would be on the beat although I'll bet about half are tied up with paperwork or court nonsense. From the other links it was about 14000 in the early part of this century wasn't it and I'll bet a much higher proportion were doing front line policing back then.
I stated in another thread I was happy to drive round without an expired MOT for 6 months because there was zero chance of getting a pull and I was right, twice. No police you see.
I stated in another thread I was happy to drive round without an expired MOT for 6 months because there was zero chance of getting a pull and I was right, twice. No police you see.

NickCQ said:
mickmcpaddy said:
I'm not going to link to anything but from having a good read through that data with all the pie charts it seems that in 2015 there were 94000 police officers available that you could assume would be on the beat although I'll bet about half are tied up with paperwork or court nonsense. From the other links it was about 14000 in the early part of this century wasn't it and I'll bet a much higher proportion were doing front line policing back then.
I stated in another thread I was happy to drive round without an expired MOT for 6 months because there was zero chance of getting a pull and I was right, twice. No police you see.
I stated in another thread I was happy to drive round without an expired MOT for 6 months because there was zero chance of getting a pull and I was right, twice. No police you see.

mickmcpaddy said:
I'm not going to link to anything but from having a good read through that data with all the pie charts it seems that in 2015 there were 94000 police officers available that you could assume would be on the beat although I'll bet about half are tied up with paperwork or court nonsense. From the other links it was about 14000 in the early part of this century wasn't it and I'll bet a much higher proportion were doing front line policing back then.
La Liga said:
No, but what's your actual point? What does that have to do with 1) Whether or not firearms crime is as big a problem as you claim, 2) The firearms data presented.
fblm said:
Interesting thanks. Non-air gun offences are an order of magnitude higher than I would have guessed. That said, the graph is very pretty. Statistically extremely unlikely kind of pretty. It screams of being manipulated or 'smoothed'. Secondly how is it possible that airgun offences have dropped from 10,000 to zero in a decade?
Where does it say they've dropped to zero? Recorded crime isn't perfect, both in terms of it not capturing matters which aren't reported and consistency over the years, but there's some rather large scope for some margin of error in that data with the strong, clear trend.
fblm said:
mickmcpaddy said:
I stated in another thread I was happy to drive round without an expired MOT for 6 months because there was zero chance of getting a pull and I was right, twice. No police you see.
You personally drove round with no MOT of 6 months?Gassing Station | News, Politics & Economics | Top of Page | What's New | My Stuff