The Climate-Industrial Complex
Discussion


Diderot said:
Right, like I said, in that dot graph, there are 2 cherry picked aspects: the mean period and the anomalous year.
Sorry Diderot, for something to be cherry picked you need two things, firstly for the outcome to be dependent on the choices made, and for there to be no a-priori reason for the choice. The mean period is thus not cherry picked as the outcome would be much the same for pretty much any choice of baseline period representing recent climate. The anomalous year is also not cherry picked as it is this year (and so there is a reason for choosing it a-priori) and nigelfr was questioning the idea that there is global cooling now.Now if you want to demonstrate cherry picking, rather than merely making an usupported accusation, you would have to show that the choice of baseline period (within sensible limits) actually made a difference to the outcome. Note that in the case of "global cooling since 1998" and "global cooling since 2002" I was able to do exactly that by showing you get warming rather than cooling if you pick 2000 as a start date.
Edited by ludo on Wednesday 22 July 11:12
ludo said:
Diderot said:
Right, like I said, in that dot graph, there are 2 cherry picked aspects: the mean period and the anomalous year.
Sorry Diderot, for something to be cherry picked you need two things, firstly for the outcome to be dependent on the choices made, and for there to be no a-priori reason for the choice. The mean period is thus not cherry picked as the outcome would be much the same for pretty much any choice of baseline period representing recent climate. The anomalous year is also not cherry picked as it is this year (and so there is a reason for choosing it a-priori) and nigelfr was questioning the idea that there is global cooling now.Now if you want to demonstrate cherry picking, rather than merely making an usupported accusation, you would have to show that the choice of baseline period (within sensible limits) actually made a difference to the outcome. Note that in the case of "global cooling since 1998" and "global cooling since 2002" I was able to do exactly that by showing you get warming rather than cooling if you pick 2000 as a start date.
Edited by ludo on Wednesday 22 July 11:12
nonegreen said:
ludo said:
Diderot said:
Right, like I said, in that dot graph, there are 2 cherry picked aspects: the mean period and the anomalous year.
Sorry Diderot, for something to be cherry picked you need two things, firstly for the outcome to be dependent on the choices made, and for there to be no a-priori reason for the choice. The mean period is thus not cherry picked as the outcome would be much the same for pretty much any choice of baseline period representing recent climate. The anomalous year is also not cherry picked as it is this year (and so there is a reason for choosing it a-priori) and nigelfr was questioning the idea that there is global cooling now.Now if you want to demonstrate cherry picking, rather than merely making an usupported accusation, you would have to show that the choice of baseline period (within sensible limits) actually made a difference to the outcome. Note that in the case of "global cooling since 1998" and "global cooling since 2002" I was able to do exactly that by showing you get warming rather than cooling if you pick 2000 as a start date.
Edited by ludo on Wednesday 22 July 11:12
For instance, I could design a statistical experiment now to determine whether this years minimum sea ice extent (which will happen in September) was unusually small, using all of the data up until now as the baseline for comparison. This is all a-priori design as I haven't observed this Septembers ice extent data yet, on the very reasonable grounds that it hasn't happened yet.
ludo said:
nonegreen said:
ludo said:
Diderot said:
Right, like I said, in that dot graph, there are 2 cherry picked aspects: the mean period and the anomalous year.
Sorry Diderot, for something to be cherry picked you need two things, firstly for the outcome to be dependent on the choices made, and for there to be no a-priori reason for the choice. The mean period is thus not cherry picked as the outcome would be much the same for pretty much any choice of baseline period representing recent climate. The anomalous year is also not cherry picked as it is this year (and so there is a reason for choosing it a-priori) and nigelfr was questioning the idea that there is global cooling now.Now if you want to demonstrate cherry picking, rather than merely making an usupported accusation, you would have to show that the choice of baseline period (within sensible limits) actually made a difference to the outcome. Note that in the case of "global cooling since 1998" and "global cooling since 2002" I was able to do exactly that by showing you get warming rather than cooling if you pick 2000 as a start date.
Edited by ludo on Wednesday 22 July 11:12
For instance, I could design a statistical experiment now to determine whether this years minimum sea ice extent (which will happen in September) was unusually small, using all of the data up until now as the baseline for comparison. This is all a-priori design as I haven't observed this Septembers ice extent data yet, on the very reasonable grounds that it hasn't happened yet.
nonegreen said:
ludo said:
nonegreen said:
ludo said:
Diderot said:
Right, like I said, in that dot graph, there are 2 cherry picked aspects: the mean period and the anomalous year.
Sorry Diderot, for something to be cherry picked you need two things, firstly for the outcome to be dependent on the choices made, and for there to be no a-priori reason for the choice. The mean period is thus not cherry picked as the outcome would be much the same for pretty much any choice of baseline period representing recent climate. The anomalous year is also not cherry picked as it is this year (and so there is a reason for choosing it a-priori) and nigelfr was questioning the idea that there is global cooling now.Now if you want to demonstrate cherry picking, rather than merely making an usupported accusation, you would have to show that the choice of baseline period (within sensible limits) actually made a difference to the outcome. Note that in the case of "global cooling since 1998" and "global cooling since 2002" I was able to do exactly that by showing you get warming rather than cooling if you pick 2000 as a start date.
Edited by ludo on Wednesday 22 July 11:12
For instance, I could design a statistical experiment now to determine whether this years minimum sea ice extent (which will happen in September) was unusually small, using all of the data up until now as the baseline for comparison. This is all a-priori design as I haven't observed this Septembers ice extent data yet, on the very reasonable grounds that it hasn't happened yet.
ludo said:
nonegreen said:
ludo said:
nonegreen said:
ludo said:
Diderot said:
Right, like I said, in that dot graph, there are 2 cherry picked aspects: the mean period and the anomalous year.
Sorry Diderot, for something to be cherry picked you need two things, firstly for the outcome to be dependent on the choices made, and for there to be no a-priori reason for the choice. The mean period is thus not cherry picked as the outcome would be much the same for pretty much any choice of baseline period representing recent climate. The anomalous year is also not cherry picked as it is this year (and so there is a reason for choosing it a-priori) and nigelfr was questioning the idea that there is global cooling now.Now if you want to demonstrate cherry picking, rather than merely making an usupported accusation, you would have to show that the choice of baseline period (within sensible limits) actually made a difference to the outcome. Note that in the case of "global cooling since 1998" and "global cooling since 2002" I was able to do exactly that by showing you get warming rather than cooling if you pick 2000 as a start date.
Edited by ludo on Wednesday 22 July 11:12
For instance, I could design a statistical experiment now to determine whether this years minimum sea ice extent (which will happen in September) was unusually small, using all of the data up until now as the baseline for comparison. This is all a-priori design as I haven't observed this Septembers ice extent data yet, on the very reasonable grounds that it hasn't happened yet.

nonegreen said:
Very interesting. Its amazing how terms can be adopted accross disciplines. Another example is "in denial" Basically a term used by pshchotherapists to explain away their client frustrations, yet now frequently used by left wing biggots to apply negative labels to those telling the truth. A-priori is a philosophical term used to describe original thought as opposed to thoughts and ideas developed. Clearly the statistics industry has misunderstood the meaning when making its adaptation. Its not unusual.
Actually, the statistical interpretations seem more in line with the etymologies of a-priori ‘from what is before’ and a-posteriori ‘from what comes after’ than the philosophical interpretations; the dividing line between the "before" and the "after" in statistics is the observation of the data. So a-priori statistical knowledge is "innate" knowledge of the domain (e.g. you know precipitation is non-negative as rain generally falls down rather than up) and a-posteriori knowledge is what you know from experience, having looked at the data, e.g. "its been pissing it down lately".ludo said:
Diderot said:
Right, like I said, in that dot graph, there are 2 cherry picked aspects: the mean period and the anomalous year.
Sorry Diderot, for something to be cherry picked you need two things, firstly for the outcome to be dependent on the choices made, and for there to be no a-priori reason for the choice. The mean period is thus not cherry picked as the outcome would be much the same for pretty much any choice of baseline period representing recent climate. The anomalous year is also not cherry picked as it is this year (and so there is a reason for choosing it a-priori) and nigelfr was questioning the idea that there is global cooling now.Now if you want to demonstrate cherry picking, rather than merely making an usupported accusation, you would have to show that the choice of baseline period (within sensible limits) actually made a difference to the outcome. Note that in the case of "global cooling since 1998" and "global cooling since 2002" I was able to do exactly that by showing you get warming rather than cooling if you pick 2000 as a start date.
Edited by ludo on Wednesday 22 July 11:12
Diderot said:
ludo said:
Diderot said:
Right, like I said, in that dot graph, there are 2 cherry picked aspects: the mean period and the anomalous year.
Sorry Diderot, for something to be cherry picked you need two things, firstly for the outcome to be dependent on the choices made, and for there to be no a-priori reason for the choice. The mean period is thus not cherry picked as the outcome would be much the same for pretty much any choice of baseline period representing recent climate. The anomalous year is also not cherry picked as it is this year (and so there is a reason for choosing it a-priori) and nigelfr was questioning the idea that there is global cooling now.Now if you want to demonstrate cherry picking, rather than merely making an usupported accusation, you would have to show that the choice of baseline period (within sensible limits) actually made a difference to the outcome. Note that in the case of "global cooling since 1998" and "global cooling since 2002" I was able to do exactly that by showing you get warming rather than cooling if you pick 2000 as a start date.
Edited by ludo on Wednesday 22 July 11:12

ETA: and I rather doubt that the proxy data has monthly resolution, so it is moot anyway.
Edited by ludo on Wednesday 22 July 18:23
Guam said:
ludo said:
Guam said:
ludo said:
Diderot said:
Yes but what is so significant about the period 1961 - present?
Nothing particularly I expect, other than that it represents the recent past. Do you suppose it makes a big difference to the plot if the start and end dates of the baseline period were changed by say five years? I wouldn't have thought so. If the outcome is insensitive to the choice of start and end dates (i.e. unlike the "global cooling from 1998 and 2002, err... but not 1999, 2000 or 2001" thing), then an accusation of cherry picking is a bit feeble as it wouldn't make any difference.Do you notice the way they hide the details of baseline period away in the small print to try and fool the reader into not considering it?

Edited by ludo on Wednesday 22 July 08:09
I am not sure how you can interpret "[diderot]Yes but what is so significant about the period 1961 - present?[/diderot] [ludo]Nothing particularly I expect[/ludo]" as suggesting in any way that the data prior to 1961 was significantly different to the data post 1961, taken at face value, it indicates the exact opposite.
Guam said:
and that the extension of the timescale over some other abitrary timescale prior to 1961 would not impact the plot due to a a potential change in the mean data (simplisticly speaking) except by foreshortening the timescale to exclude prior data.
sorry, again your comment is too ambiguous for me to give a meaningful answer. As I said, I would expect that if you were to vary the start and end dates by five years or so it would make little difference to the plot, for the simple reason that a thirty year mean is fairly stable and isn't going to change much with some tinkering with start and end dates in the absence of a very strong long term trend.Guam said:
Can you explain if so, why what holds in one direction (foreshortening) doesnt hold in the other (extending)?
I'm still not too sure what you mean, however there is one very big difference between trends and means computed over long and short windows, which is statistical significance. The error bars (uncertainty) on a mean of a long window will be very much smaller than for a short window (they decrease proportional to root n, where n is the number of observations). Likewise for an OLS trend line, a very much stronger trend is required to achieve statistical significance for a short trend than for a long trend. The reason that climatologists don't normally look at trends as short as 10 years is that mostly they are not statistically significant. A trend of thirty years on the other hand is long enough to be confident of the existence of a long term trend above the noise, as the error bars on the a in f(x) = ax + b do not include zero.If a trend is not statistically significant, that means it may be simply the natural variability is such that it resembles a trend by chance. It is that that permits cherry picking, where the effects of natural vairiability are asserted to be a real trend.
Guam said:
ludo said:
ask a statistica;l question, you'll get a statistical answer. If it doesn't suit your argument, tough luck. If you want to make arguments based on trends that are not statistically significant, feel free, but they won't carry much weight.
Utter utter tripe as a response and you know it, You And Nige accuse TB of trying to mislead people on a near daily basis, well time you looked in the mirror Ludo.Cheers

nigelfr said:
turbobloke said:
Meanwhile global warming sure is causing problems with the weather, we need even more cooling and fast.
http://news.bbc.co.uk/1/hi/world/americas/6286484....
FM, TB you're getting sooo desperately boring. Still trying to prove that the Earth is cooling? http://news.bbc.co.uk/1/hi/world/americas/6286484....
Here's the June (latest published) world weather anomaly:

draw your own conclusions.
http://lwf.ncdc.noaa.gov/oa/climate/research/2009/...
ETA: Blib, I hope this is helpful for you

Edited by nigelfr on Sunday 19th July 18:13
However, as it was my response to TB's post that woke the slumbering beast, I feel slightly responsible so let me give my take on the issue. Oh and the reason I used the dot plot are manifold:
- complaints that the temp plots are too off putting
- to show clearly the cherry pick in TB's original post picking South America
- for Blib
I suspect that Diderot is trying to bang the old "but the climate is always changing, what's normal?" drum. Yeah, yeah, I know I should have more respect for him and give him the benefit of the doubt, but he seems to be very attached to that idea.
The 1961-1990 baseline is probably an arbitrary choice:IIRC NOAA also do a 1901-2000 baseline. If you look at all the temp indices on woodfortrees, you will see that between them have 3 different baselines. (Probably why WUWT supporters think GISS exaggerates temp anomalies, they haven't realised that it's baseline is cooler.)However, although the baselines are different, all the indices have roughly the same shape.
The above figure was taken from http://www.woodfortrees.org/notes where you can also find the baseline periods for each index.
As Ludo says, offsetting a plot by a fixed amount, which is what you would get if you use a different baseline period, doesn't affect the trend. And it's the long term trend that we're interested in (excluding the cherry pickers).
Same old from the same faithful sources.
Other global cooling reports in 2009 from around the world, clearly missed or forgotten as inconvenient truth:
A severe cold snap in Thailand prompted authorities to declare an emergency zone across more than half of the country covering 42 of 76 provinces
Freezing to death in Romania
Freezing to death in Poland and Belgium
Freezing to death in India
Coldest start to summer in 100 years
More
2008 had similar.
China cold wave takes toll on economy
So many reports of the impact of global cooling you'd need blind faith to miss them.
Now with El Nino the odds are high and getting higher for more porkies about manmade warming from summer 2009 which is in fact natural just like the rest.

ludo said:
Guam said:
ludo said:
ask a statistica;l question, you'll get a statistical answer. If it doesn't suit your argument, tough luck. If you want to make arguments based on trends that are not statistically significant, feel free, but they won't carry much weight.
Utter utter tripe as a response and you know it, You And Nige accuse TB of trying to mislead people on a near daily basis, well time you looked in the mirror Ludo.Cheers

turbobloke said:
Same old from the same faithful sources.
Other global cooling reports in 2009 from around the world, clearly missed or forgotten as inconvenient truth:
A severe cold snap in Thailand prompted authorities to declare an emergency zone across more than half of the country covering 42 of 76 provinces
Freezing to death in Romania
Freezing to death in Poland and Belgium
Freezing to death in India
Coldest start to summer in 100 years
More
2008 had similar.
China cold wave takes toll on economy
So many reports of the impact of global cooling you'd need blind faith to miss them.
Now with El Nino the odds are high and getting higher for more porkies about manmade warming from summer 2009 which is in fact natural just like the rest.
Shock news from TB:Northern hemisphere gets colder weather in Winter. Orbital variation to blame.Other global cooling reports in 2009 from around the world, clearly missed or forgotten as inconvenient truth:
A severe cold snap in Thailand prompted authorities to declare an emergency zone across more than half of the country covering 42 of 76 provinces
Freezing to death in Romania
Freezing to death in Poland and Belgium
Freezing to death in India
Coldest start to summer in 100 years
More
2008 had similar.
China cold wave takes toll on economy
So many reports of the impact of global cooling you'd need blind faith to miss them.
Now with El Nino the odds are high and getting higher for more porkies about manmade warming from summer 2009 which is in fact natural just like the rest.
And as for the late start to Summer in Canada this year: look at the blue dots in the plot from earlier, surprise, surprise: there are some over Canada and the US.
But as been endlessly repeated: stop looking at the weather.
TB you are such a kidder: try this on for size... Now that the La Nina has finished, maybe the deniers will stop going on about global cooling.
Come on TB, level with us: just for how many years have you been saying that the world's cooling?
Guam said:
Incidentally Ludo you or Nige found the cause of that supposed 2 feet rise in sea level between 350 and 500 ad yet?
Or are the Archeaolgists talking b ks?
ks?
Well Guam: you're the one who claims that even with modern methods it's impossible to measure sea level accurately, so why are you now claiming that it's possible to measure accurately global sea level rise between AD 350-500?Or are the Archeaolgists talking b
ks?ETA http://wattsupwiththat.com/2009/07/22/9507/#more-9...
I see at WUWT they are discussing sea level rises: can we expect to see a comment from you there saying it's all b
ks?Edited by nigelfr on Wednesday 22 July 21:32
Shock news - winter and summer temperatures hitting or breaking cold - not hot - records over about 100 years, taking in most of industrialisation across a 14H (Hansen) timescale.
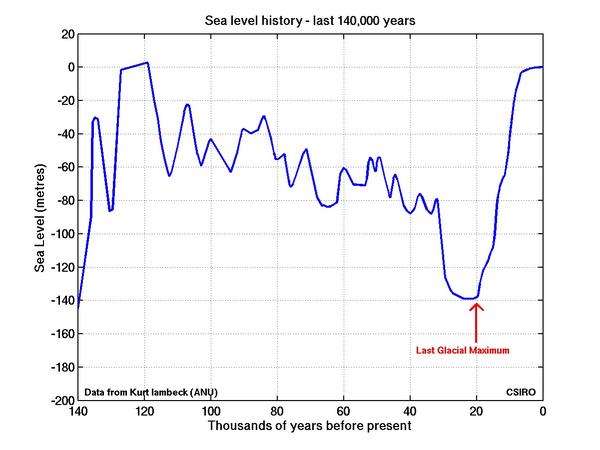
We must have had that chart (origin cited, concerns over accuracy should be directed to the source) in the previous sea level thread, if not it's a useful reminder of natural interglacial sea level changes. Trend analysts and quasi-religious soothsayers might like to consider what's likely to happen next, a 7 metre Al Gore ribtickler rise, or something else.
We must have had that chart (origin cited, concerns over accuracy should be directed to the source) in the previous sea level thread, if not it's a useful reminder of natural interglacial sea level changes. Trend analysts and quasi-religious soothsayers might like to consider what's likely to happen next, a 7 metre Al Gore ribtickler rise, or something else.
Gassing Station | News, Politics & Economics | Top of Page | What's New | My Stuff