Japan Fukushima nuclear thread
Discussion


Globs said:
llewop said:
I'm being thick: AGW?
Not sure where you got your cost estimate from, not that it matters, but somewhat out from the figures I've seen.
AGW = Anthropogenic Global WarmingNot sure where you got your cost estimate from, not that it matters, but somewhat out from the figures I've seen.
That cost estimate was from some website or video I watched a while ago, it was one figure of many though.
It's not going to be cheap as it's fecking huge and dangerous - have you any estimates?
I think they patched it up not so long ago:
Looking again at the Chernobyl pictures it does seem that we have nothing to fear from the Japanese ones, a meltdown almost seems small potatoes compared to this:
It is striking however that we have lived through a long period where a reactor goes 'pop' or 'fizz' often enough to keep the widespread adoption of nuclear power a matter of concern. This leads me to think that most of the 'bad press' is generated by the operators themselves in mis-handling or mis-designing those plants. For instance if the RMBK didn't have such a huge positive void coefficient (a defect 'ignored'/operated around until the disaster) and if TEPCO has not put their (backup) generators of the beach we'd be much better placed for power.
your Chernobyl piccies are of the western wall stabilisation - which was completed about 3 years ago (all that shiny yellow structure) - essentially: taking the weight of the roof off the western wall. Regarding NSC (New Safe Confinement) I have an idea of the current cost estimate but can't say other than your figure is probably too high.
You are right: the operators have way too much 'history' of self inflicted 'bad press' but we live and (hopefully) learn. People and the environment recover: people live and work again in Hiroshima and Nagasaki and at Chernobyl.
llewop said:
You are right: the operators have way too much 'history' of self inflicted 'bad press' but we live and (hopefully) learn. People and the environment recover: people live and work again in Hiroshima and Nagasaki and at Chernobyl.
Is it just these operators Llewop? Japan has a very poor record only behind Russia which for a small but developed country is not good. If China and India were to have the same records on a per population basis then things would not be good at all. The scary numbers are that background radiation from man made sources rests at approx 3% of the total at the moment and in terms of a f
 k up that we cannot put right however much money we throw at it, it's up beyond all the global warming bks etc that we get fed.
I'm all for nuclear generation as I believe it is our future but with 100 odd radiation leaks of one form or another over the past sixty years who makes that call on whether something is an acceptable risk? Accidents with radiation, whilst each event can be looked at as non life threatening in it's own right, are cumulative.
If we are going to increase the number of facilities worldwide then we need to show that we are better capable of holding it in the can so to speak before the undeveloped countries have a go at it.
MOTORVATOR said:
The scary numbers are that background radiation from man made sources rests at approx 3% of the total at the moment and in terms of a fk up that we cannot put right however much money we throw at it, it's up beyond all the global warming bks etc that we get fed.
The 3% contribution from man made sources you are quoting is almost entirely from medical procedures. The contribution from bomb test fallout these days is ~0.2% and from power plant releases is at least an order of magnitude smaller. k up that we cannot put right however much money we throw at it, it's up beyond all the global warming bks etc that we get fed.Edited by hairykrishna on Thursday 31st March 09:46
hairykrishna said:
MOTORVATOR said:
The scary numbers are that background radiation from man made sources rests at approx 3% of the total at the moment and in terms of a fk up that we cannot put right however much money we throw at it, it's up beyond all the global warming bks etc that we get fed.
The 3% contribution from man made sources you are quoting is almost entirely from medical procedures. The contribution from bomb test fallout these days is ~0.2% and from power plant releases is at least an order of magnitude smaller. k up that we cannot put right however much money we throw at it, it's up beyond all the global warming bks etc that we get fed.MOTORVATOR said:
llewop said:
You are right: the operators have way too much 'history' of self inflicted 'bad press' but we live and (hopefully) learn. People and the environment recover: people live and work again in Hiroshima and Nagasaki and at Chernobyl.
Is it just these operators Llewop? There have been enough events/incidents or releases from all over the world that no one can claim a clean sheet. But that is also true for other industries - there is plenty of history of other activities that are replicated around the world as countries develop - hopefully the lessons that are learnt are also shared to mitigate future risks.
hairykrishna said:
MOTORVATOR said:
The scary numbers are that background radiation from man made sources rests at approx 3% of the total at the moment and in terms of a fk up that we cannot put right however much money we throw at it, it's up beyond all the global warming bks etc that we get fed.
The 3% contribution from man made sources you are quoting is almost entirely from medical procedures. The contribution from bomb test fallout these days is ~0.2% and from power plant releases is at least an order of magnitude smaller. k up that we cannot put right however much money we throw at it, it's up beyond all the global warming bks etc that we get fed.Edited by hairykrishna on Thursday 31st March 09:46

Is there anywhere that actually gives the exact figures for all releases in the past years? I know the background has reduced considerably in recent years due to cessation of nuclear weapons testing when it was up at a claimed 7% at one time but it's hard to track down real facts.
llewop said:
MOTORVATOR said:
llewop said:
You are right: the operators have way too much 'history' of self inflicted 'bad press' but we live and (hopefully) learn. People and the environment recover: people live and work again in Hiroshima and Nagasaki and at Chernobyl.
Is it just these operators Llewop? There have been enough events/incidents or releases from all over the world that no one can claim a clean sheet. But that is also true for other industries - there is plenty of history of other activities that are replicated around the world as countries develop - hopefully the lessons that are learnt are also shared to mitigate future risks.

MOTORVATOR said:
If that's right Hairy then I have been given a severe lesson in not believing spouted envirofacts without checking myself.
Is there anywhere that actually gives the exact figures for all releases in the past years? I know the background has reduced considerably in recent years due to cessation of nuclear weapons testing when it was up at a claimed 7% at one time but it's hard to track down real facts.
UNSCEAR reports are the place to look for the most authoritative assessments of background dose you're likely to find. They're a bit of a slog for quick reference though. This US rad protection site I just googled seems fairly on the money; http://www.doh.wa.gov/ehp/rp/factsheets/factsheets...Is there anywhere that actually gives the exact figures for all releases in the past years? I know the background has reduced considerably in recent years due to cessation of nuclear weapons testing when it was up at a claimed 7% at one time but it's hard to track down real facts.
Given my experience of the occasional debate with anti nuclear types (I'm not saying you are one!) the 3% figure you quote is most likely the 'man made dose for someone who hasn't had any diagnostic X-rays'. The faulty leap in reasoning is assuming that the only medical, and non weapon/nuke plant, contribution is diagnostic X-rays. Unfortunately this figure seems to pop up all over the place, even on sites that should know better!
MOTORVATOR said:
What concerns me is when the Chinese decide to make one their cheap copies which falls apart in 2 years but is cheap enough to just replace with another. That and the Indian call centre response when they get a leak.
a fair concern that i think many share - sharing technology and good practice is a way to try and bypass them making the same mistakes all over again. It is one of the reasons I am where I am is to try bring into play best practice in RP and to change safety cultures for the better.hairykrishna said:
MOTORVATOR said:
If that's right Hairy then I have been given a severe lesson in not believing spouted envirofacts without checking myself.
Is there anywhere that actually gives the exact figures for all releases in the past years? I know the background has reduced considerably in recent years due to cessation of nuclear weapons testing when it was up at a claimed 7% at one time but it's hard to track down real facts.
UNSCEAR reports are the place to look for the most authoritative assessments of background dose you're likely to find. They're a bit of a slog for quick reference though. This US rad protection site I just googled seems fairly on the money; http://www.doh.wa.gov/ehp/rp/factsheets/factsheets...Is there anywhere that actually gives the exact figures for all releases in the past years? I know the background has reduced considerably in recent years due to cessation of nuclear weapons testing when it was up at a claimed 7% at one time but it's hard to track down real facts.
Given my experience of the occasional debate with anti nuclear types (I'm not saying you are one!) the 3% figure you quote is most likely the 'man made dose for someone who hasn't had any diagnostic X-rays'. The faulty leap in reasoning is assuming that the only medical, and non weapon/nuke plant, contribution is diagnostic X-rays. Unfortunately this figure seems to pop up all over the place, even on sites that should know better!
Your right about figures being all over the place, I've just found one site quoting UK as 14% medical and that site you quote shows 19% for all man made sources but I guess must be centred around the US.
So mixing global and local figures probably doesn't tell us anything on the basis there is probably little medical effect added in some places but shedloads in more developed places.
MOTORVATOR said:
Your right about figures being all over the place, I've just found one site quoting UK as 14% medical and that site you quote shows 19% for all man made sources but I guess must be centred around the US.
So mixing global and local figures probably doesn't tell us anything on the basis there is probably little medical effect added in some places but shedloads in more developed places.
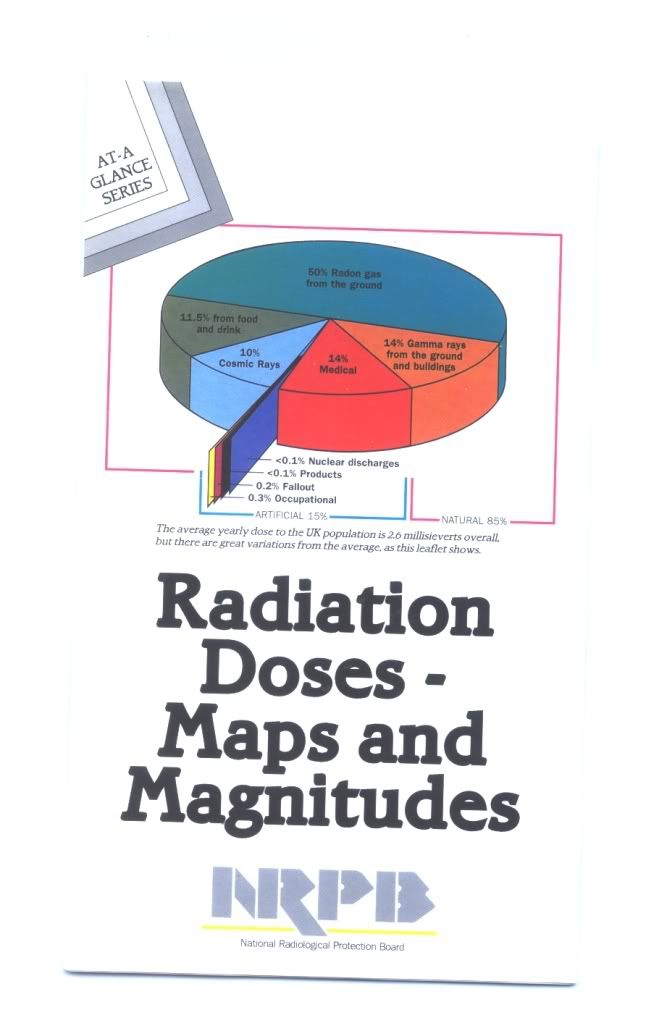
Back in the days the Health Protection Agency was the NRPB they used to have a nice pie-chart breaking it down, which I can't seem to track down on their HPA'd website, the nearest I've found from a quick look is this:So mixing global and local figures probably doesn't tell us anything on the basis there is probably little medical effect added in some places but shedloads in more developed places.
http://www.hpa.org.uk/Topics/Radiation/Understandi...
...on that basis: I'm glad I don't eat brazil nuts!

Safety upgrades.
http://edition.cnn.com/2011/WORLD/asiapcf/03/30/ja...
An interesting thought is whether they just came up with the plan overnight or whether it was already there and not implemented previously due to cost / benefit analysis.
Hindsight is a wonderful thing for the critic, but I wonder what the cost of this is going to be and whether, had they done it earlier, they may still have had a few viable reactors, minimal clean up costs, a few less displaced citizens and a fishing fleet on the doorstep.
llewop said:
Back in the days the Health Protection Agency was the NRPB they used to have a nice pie-chart breaking it down, which I can't seem to track down on their HPA'd website, the nearest I've found from a quick look is this:
http://www.hpa.org.uk/Topics/Radiation/Understandi...
...on that basis: I'm glad I don't eat brazil nuts!
I think you have also hit on a site that explains Americans.http://www.hpa.org.uk/Topics/Radiation/Understandi...
...on that basis: I'm glad I don't eat brazil nuts!
UK average annual radiation dose 2.7 mSv
USA average annual radiation dose 6.2 mSv
llewop said:
Back in the days the Health Protection Agency was the NRPB they used to have a nice pie-chart breaking it down, which I can't seem to track down on their HPA'd website, the nearest I've found from a quick look is this:
http://www.hpa.org.uk/Topics/Radiation/Understandi...
...on that basis: I'm glad I don't eat brazil nuts!
The advantage of never throwing anything away;http://www.hpa.org.uk/Topics/Radiation/Understandi...
...on that basis: I'm glad I don't eat brazil nuts!
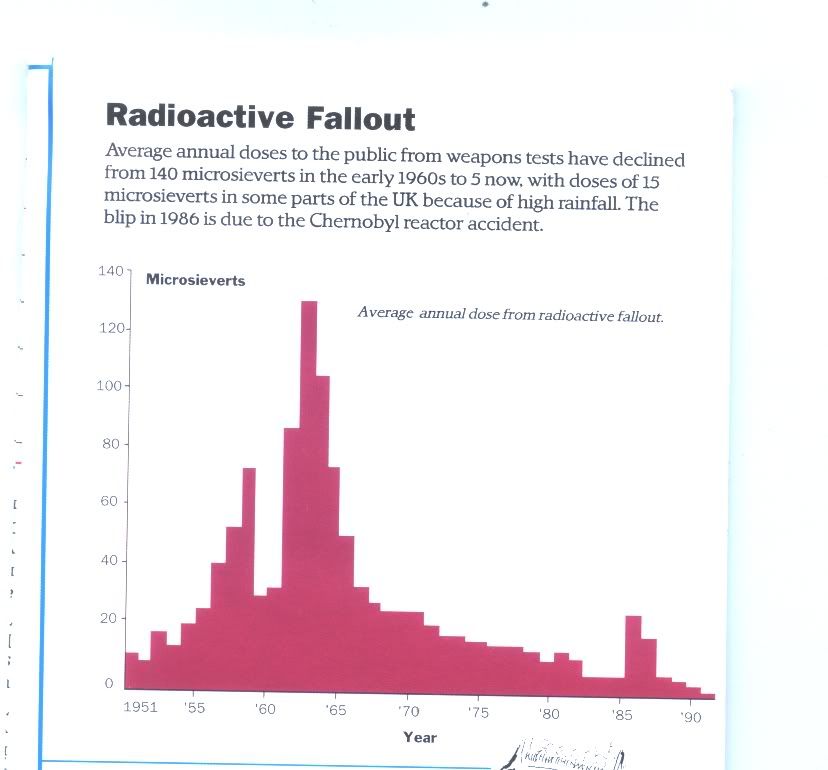
Sadly the leaflet's a bit big to lend itself to easy scanning. Here's the fallout graph;
hairykrishna said:
llewop said:
Back in the days the Health Protection Agency was the NRPB they used to have a nice pie-chart breaking it down, which I can't seem to track down on their HPA'd website, the nearest I've found from a quick look is this:
/snip
...on that basis: I'm glad I don't eat brazil nuts!
The advantage of never throwing anything away;/snip
...on that basis: I'm glad I don't eat brazil nuts!
/snip
Sadly the leaflet's a bit big to lend itself to easy scanning. Here's the fallout graph;
/snip
MOTORVATOR said:
Not too sure how helpful a pie chart is on a local basis. Don't radon concentrations vary by five or six multiples across the globe skewing the charts all over the place?
Yes, that's the UK average pie chart. Live in Cornwall and your dose is >7mSv a year. Ramsar in Iran and you might get 40. I thought the question in the context of this thread was whether man made contributes a significant fraction of background? That's only going to go down as a percentage if you live somewhere that gives you 10's of mSv of Radon dose.hairykrishna said:
MOTORVATOR said:
Not too sure how helpful a pie chart is on a local basis. Don't radon concentrations vary by five or six multiples across the globe skewing the charts all over the place?
Yes, that's the UK average pie chart. Live in Cornwall and your dose is >7mSv a year. Ramsar in Iran and you might get 40. I thought the question in the context of this thread was whether man made contributes a significant fraction of background? That's only going to go down as a percentage if you live somewhere that gives you 10's of mSv of Radon dose.I guess what it actually means is that any additional radiation added is probably irrelevant to us but more of a problem if you live in a high background area to start with. Less of a fraction of the whole which is a false comfort as it is actually adding to a higher figure to start with.
Just makes me even more wary of any figures being compared with background without being clear on where.
MOTORVATOR said:
Sorry Hairy I wasn't knocking it, all useful information. I was typing out loud as I was thinking that percentages don't mean a lot when if you half the radon then suddenly medical provides 28% instead of 14% if you see what I mean.
I guess what it actually means is that any additional radiation added is probably irrelevant to us but more of a problem if you live in a high background area to start with. Less of a fraction of the whole which is a false comfort as it is actually adding to a higher figure to start with.
Just makes me even more wary of any figures being compared with background without being clear on where.
True, quoting a percentage without reference to the normal background is fairly useless. Adding a few microsieverts a year is going to make bugger all difference wherever you live though. It's worth remembering that nobody's managed to demonstrate that there's any increased cancer risks at these levels (i.e. less than ~100mSv). All of the limits are based on linear no threshold, extrapolated from high dose acute stuff.I guess what it actually means is that any additional radiation added is probably irrelevant to us but more of a problem if you live in a high background area to start with. Less of a fraction of the whole which is a false comfort as it is actually adding to a higher figure to start with.
Just makes me even more wary of any figures being compared with background without being clear on where.
hairykrishna said:
MOTORVATOR said:
Sorry Hairy I wasn't knocking it, all useful information. I was typing out loud as I was thinking that percentages don't mean a lot when if you half the radon then suddenly medical provides 28% instead of 14% if you see what I mean.
I guess what it actually means is that any additional radiation added is probably irrelevant to us but more of a problem if you live in a high background area to start with. Less of a fraction of the whole which is a false comfort as it is actually adding to a higher figure to start with.
Just makes me even more wary of any figures being compared with background without being clear on where.
True, quoting a percentage without reference to the normal background is fairly useless. Adding a few microsieverts a year is going to make bugger all difference wherever you live though. It's worth remembering that nobody's managed to demonstrate that there's any increased cancer risks at these levels (i.e. less than ~100mSv). All of the limits are based on linear no threshold, extrapolated from high dose acute stuff.I guess what it actually means is that any additional radiation added is probably irrelevant to us but more of a problem if you live in a high background area to start with. Less of a fraction of the whole which is a false comfort as it is actually adding to a higher figure to start with.
Just makes me even more wary of any figures being compared with background without being clear on where.
Don't know that anyone can quantitfy it precisely.
We may well have a case here of a very minor increase of something actually killing us all to death.... a bit like CO2.
Gassing Station | News, Politics & Economics | Top of Page | What's New | My Stuff