LONG-TERM EQUITY STRATEGY - 2016 RESULT
Discussion


This topic has been posted, just in case it may be useful, for anyone wondering about long-term direct equity investment.
....................................................................................................
Probably like many novice equity investors, I began by buying and selling shares in small companies.
Why do we often start with the strange notion, that small companies can grow big, but big are already big, so might be
near their limit? There were some quick profits, but it all became very time consuming. I then changed strategy completely, and began buying shares in large companies. My preference being for FTSE 100 internationals, particularly defensive, non-cyclical businesses. The international business aspect, obviously achieves both overseas markets and foreign exchange exposure. The non-cyclical part helps greatly during market downturns.
My change seemed to progress well and fortunately, I had also created a simple performance monitoring graph system (chart 2) , which remains in use today. The important aspect being, it displays performance compared to the FTSE All-Share Index.
Those annual charts turned out to be crucial, because either through luck or skill, they showed that my fund was repeatedly outperforming the market. A decision was therfore made, to keep the core holdings unchanged, until repeated under-performance occurred. My portfolio therefore became a long-term fund.
Learning along the way, has shown me that even big companies can have plenty of growth, and also that dividends
form an important part of overall performance. In some instances, total dividends received have even exceeded
the original cost of the share purchase. There are of course exceptions, but generally there must be lower risk for investors in large companies. A recent example was the BP disaster. Dividends reduced but the payments continued. Smaller oil companies would have become insolvent under those circumstances.
Chart 1.
I show this chart first, because although interesting, particularly during 2016, it does not help with decision making, but it is a reminder that downs and ups are inevitable. For anyone who might worry about losing their money, don't buy equities. Fortunately the ups were 30 weeks and the downs only 22 weeks. This chart also emphasises the importance of being 'in the market'. The unexpected two weeks of massive rises, was of course the market reacion to the reduced value of sterling. The downs could be a worry, but Chart 2 helps deal with that concern.

....................................................................................................
Chart 2.
This is the important one, because it shows weekly progress directly compared to the market average.
(I do now realise that my choice of red and green, may not be good for everyone to see. Please say if you want that changed.)
Every calendar year has a new chart, starting at 0%.
The blue dash line shows changes in the annual dividends total. The data is based on company dividend announcements, so that explains why the increases usually occur during March and July.
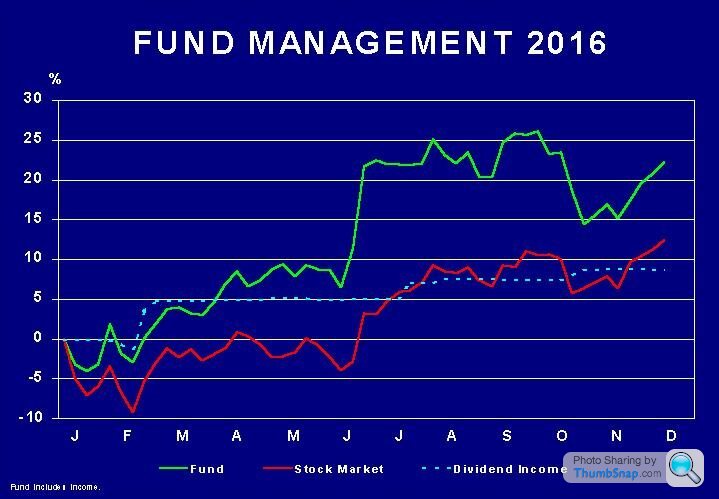
The fund has dividends included after they have been received.
There is an All-Share Index including dividends, but I think it is full year dividends, so although technically I am not
comparing like-for-like, in 2016 the fund would still have won.
Sterling devaluation was obviously the important event during 2016 for investors. During the early summer, I was
quite happy being ahead of the market with the trading range between 5% and 10%. Most unexpectedly, the fund
suddenly moved up a gear, touching 25%, and finished at 22%, the largest increase since 2005.
2016 RESULTS SUMMARY
Fund Performance = +22•17%
FTSE All-Share Index = +12•45%
Total Dividend Income = + 8.75%
There were only 2 transactions during the year;
- Both were takeovers, so no fund transaction costs were incurred.
- 1. Aquisition of BG by Shell.
- 2. Aquisition of Cable & Wireless by Liberty Global.
The Shell takeover has been remarkable for the BG shareholders. Value up 52% and income up 364%.
Costs, fees & charges;
Only one expense was incurred during 2016. ISA provider administration fee = £30 +VAT.
HOLDINGS
Companies in the fund = 24
Combined revenue of companies = £711 billion
Combined pre-tax profit = £45 billion
Total number of people employed = 2,363,023
....................................................................................................
HISTORY

29 year annual average; Fund = 14.16% (incl. dividends).
29 year annual average; Market = 5.25%
For those who like commercial tracker funds, then the red bars provide an idea of the annual performance achieved.
This chart does emphasise how important non-cyclical holdings are during the inevitable market downturns. There have been 9 down years, but the fund only dipped on 5 occasions and even then, only once has it been more than 10% down.
...................................................................................................
You probably know the quatation by Mr Warren Buffet about long-term investment.
"In the 20th century, the United States endured two world wars and other traumatic and expensive military conflicts; the Depression; a dozen or so recessions and financial panics; oil shocks; a flu epidemic; and the resignation of a disgraced president. Yet the Dow rose from 66 to 11,497. Why didn't everyone become wealthy? They were dancing in and out of the market, that's why."
....................................................................................................
That's it.
Hopefully of interest, and good wishes for a successful 2017 investment year.
Jon39 said:
2016 RESULTS SUMMARY
Fund Performance = +22•17%
FTSE All-Share Index = +12•45%
Total Dividend Income = + 8.75%
What do you mean by Total Dividend Income = + 8.75%? Does this mean that total Dividend income over 2016 was 8.75% of your fund value at the start of 2016? And why does the dotted blue line on your graph drop below 0?
CarlosFandango11 said:
What do you mean by Total Dividend Income = + 8.75%? Does this mean that total Dividend income over 2016 was 8.75% of your fund value at the start of 2016? And why does the dotted blue line on your graph drop below 0?
The dotted blue line traces the percentage change, in the total of all annual dividend income being received (% of pounds). At the end of 2016, the total income was 8.75% higher than at the start of 2016. The Shell takeover of BG obviously helped with that increase, as mentioned.
Why did it drop below zero? - I could look up the actual circumstances, but probably a company reduced, or cut their dividend. Therefore the new dividend figure going in (perhaps zero), would be less than the corresponding previous figure dropping out, therefore reducing the overall dividend total.
Edited by Jon39 on Thursday 12th January 11:53
Gassing Station | Finance | Top of Page | What's New | My Stuff