Car Survival Rate Analysis
Discussion


Car_Nut said:
By the next day we had this (you will see this curve a lot):
Anyway I have also carried out the big sum and have produced the survival curve for all cars on the UK's roads or that are SORNed that were constructed between 2001 and 2015, I will call this the survival rate reference curve:

Considering the amount of data involved, I am surprised that the curve is not smooth - any ideas? My best guess at present is the that 2008-9 financial crush changed the car type mix (as we have already seen there is a disparity in the survival rates between different types of cars).
To return to our reference year of 2003, the big numbers are as follows:
First Registrations: 2,646,056
2003 Built cars surviving: 1,822,891
2003 Built cars still taxed: 126,729
2003 Built cars SORNed: 1,696,162
Surviving: 68.89%
Taxed: 64.10%
SORN: 4.79%
Think your numbers are mixed up there?Anyway I have also carried out the big sum and have produced the survival curve for all cars on the UK's roads or that are SORNed that were constructed between 2001 and 2015, I will call this the survival rate reference curve:
Considering the amount of data involved, I am surprised that the curve is not smooth - any ideas? My best guess at present is the that 2008-9 financial crush changed the car type mix (as we have already seen there is a disparity in the survival rates between different types of cars).
To return to our reference year of 2003, the big numbers are as follows:
First Registrations: 2,646,056
2003 Built cars surviving: 1,822,891
2003 Built cars still taxed: 126,729
2003 Built cars SORNed: 1,696,162
Surviving: 68.89%
Taxed: 64.10%
SORN: 4.79%
Edit, funnily enough, both our main cars are from 2003!
Fascinating thread. Truly a great read too.
Only the other day I had a look at Golf mk4 mileage as recorded by members on the owners club and came up with a record - I was convinced that 200,000 was actually quite high mileage. It seems the cars seem to be lasting and as you correctly identify, they only get scrapped if something expensive fails.
Just for cross-reference, here's my (somewhat minor in contrast to your research) post:
Username, Mileage, Engine details where stated.
lanant - 341,000 - 2.0 Gti
deanogl - 326,000 - gttdi110
awesome-andi - 319,000 - pd130
Time76 - 314,000 - 90
- 300,000 miles -
minitdi - 283,000 - 110 ahf
ooleybrah - 275,000 - alh
psituning - 269,000 - 1.9tdi
dopiaza - 269,000 - arl
Jason M Parry - 265,000 - tdi pd150
Dataflow - 255,000
Kingvag - 246,000 - tdi130
shearsy - 242,000
Flapperjack76 - 240,000
Lewis Heaton - 236,000 - diesel
volksfan - 235,000 - tdi 130
Dougal - 235,000 - tdi 110
paulstjohndennis - 234,000
Zola - 229,000
gusco - 228,000 - tdi130
natural_born_dubber - 228,000 - 1.9 tdi
Vagwinner - 222,000 - 1.9tdi
mfrench29 - 209,000
LukeW - 208,000 - TDi 90
Vdubsgarage - 205,000 - tdi110
Pablo - 200,000 - 1.8t
- 200,000 miles -
hogwarden - 194,000 - V6 4Motion
ChrisBCFC - 194,000 - gt tdi
Lorcy - 188,000 - GT110
Alehin86 - 186,000 - 1.8t - Hybrid
Adam Oxley - 183,000 - gt tdi
JD66 - 180,000
Ben h - 178,000 - 1.8t - Full Stage 2 Original Turbo
Spud84 - 177,000 - 1.8t
Micky94 - 172,000 - 1.9tdi
C7 JFW - 175,000 - V6 4Motion
Regyboy - 167,250
Paul616 - 160,000 - 1.9 gt tdi
Chris_Wales - 153,000 - 1.9tdi - Hybrid
James Brook - 148,000 - V6 4Motion
Franko180 - 146,600 - 1.8T
General85 - 142,000 - pd130
Tom White - 144,000 - 1.8T
leemcalbanicoll - 141,000
tylerama - 137,000
Adam Jonezy - 136,000 - PD100
Edvardo - 135,000
Listensqueak - 131,000 - V6 4Motion
Diesel - 128,000 - tdi130
S-Star - 124,000 - 1.8t
tryantlers - 121,000 - 1.9tdi
JoeMk4 - 120,000 - 1.8t
Craig6700 - 105,000
- 100,000 miles -
Guybrush said:
Apols if it's been mentioned, but I suppose the scrappage scheme a while back has made a bit of a 'blip' in the figures.
^ I was just going to suggest that as the cause of the blips, but it was implemented 2009 and affected cars ten years and older - so 1999 registrations and outside the range of the graph.It's odd that it's survival of 2008 and 2012 registered cars that show the blips - I'm not aware of any schemes that would affect registrations from those years.
I know from discussions with an independent garage owner that there was a change in attitudes to car maintenance post-2008, he saw a significant reduction in routine servicing and a corresponding increase in reactive repairs. It would be interesting to see the survival of the 2008 registered cohort in more detail on a year-by-year basis. Is it s steady decline or is there a tipping point? it could be that the mix of purchases reflected a change in models, or it could be that buyers were stretching themselves financially to purchase vehicles and let the maintenance slip.
I'm also intrigued to see if the dataset supports reputational analysis, eg. taking an engine with an established bad reputation and seeing if that's supported by the data and whether improvement/development of the design changes are reflected in the data. With a personal interest, the PSA 1.6 HDi "diesel of doom" would be an obvious candidate.
AMG V12 said:
Perhaps I'm in the minority but I found your posts very interesting and well written! I look forward to more in the future.
I do love messing about with excel and government raw data so please accept this post as confirmation that you are not alone in finding it interesting.OP what I would prefer is if rather than bloody great edited screenshots hosted in thumbsnap you actualy used the table facility that the PH forum has
| GE DATA | Seats | Referendum data | Seats | Leave | Remain | % Leave | GE Equivilent |
| East Midlands | 46 | East Midlands | 40 | 38 | 2 | 0.95 | 44 |
| Eastern | 58 | East | 47 | 42 | 5 | 0.89 | 52 |
| London | 73 | London | 33 | 5 | 28 | 0.15 | 11 |
| NI | 18 | Northern Ireland | 1 | 0 | 1 | 0.00 | 0 |
| North East | 29 | North East | 12 | 11 | 1 | 0.92 | 27 |
| North West | 75 | North West | 39 | 32 | 7 | 0.82 | 62 |
| Scotland | 59 | Scotland | 32 | 0 | 32 | 0.00 | 0 |
| South East | 84 | South East | 67 | 43 | 24 | 0.64 | 54 |
| South West | 55 | South West | 38 | 28 | 10 | 0.74 | 41 |
| wales | 40 | Wales | 22 | 17 | 5 | 0.77 | 31 |
| West Midlands | 59 | West Midlands | 30 | 29 | 1 | 0.97 | 57 |
| Yorkshire and the Humber | 54 | Yorkshire and The Humber | 21 | 18 | 3 | 0.86 | 46 |
| Total Area MP's | 650 | Total Referendum Areas | 382 | 263 | 119 | 0.69 | 423 |
Car_Nut said:
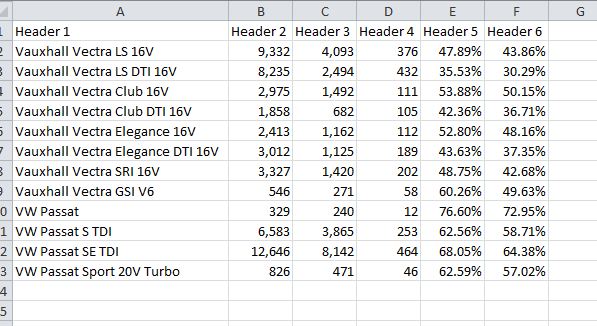
A promised, I have looked up the data for some more Vectra variants. At the same time I decided that I had not done enough analysis of the Passat, either. The extra info is as follows (apologies for what the website does to my tables, but hopefully they are understandable):
Vauxhall Vectra LS 16V 9,332 4,093 376 47.89% 43.86%
Vauxhall Vectra LS DTI 16V 8,235 2,494 432 35.53% 30.29%
Vauxhall Vectra Club 16V 2,975 1,492 111 53.88% 50.15%
Vauxhall Vectra Club DTI 16V 1,858 682 105 42.36% 36.71%
Vauxhall Vectra Elegance 16V 2,413 1,162 112 52.80% 48.16%
Vauxhall Vectra Elegance DTI 16V 3,012 1,125 189 43.63% 37.35%
Vauxhall Vectra SRI 16V 3,327 1,420 202 48.75% 42.68%
Vauxhall Vectra GSI V6 546 271 58 60.26% 49.63%
VW Passat 329 240 12 76.60% 72.95%
VW Passat S TDI 6,583 3,865 253 62.56% 58.71%
VW Passat SE TDI 12,646 8,142 464 68.05% 64.38%
VW Passat Sport 20V Turbo 826 471 46 62.59% 57.02%
The PH Table format works brilliantly within an xls sheetVauxhall Vectra LS 16V 9,332 4,093 376 47.89% 43.86%
Vauxhall Vectra LS DTI 16V 8,235 2,494 432 35.53% 30.29%
Vauxhall Vectra Club 16V 2,975 1,492 111 53.88% 50.15%
Vauxhall Vectra Club DTI 16V 1,858 682 105 42.36% 36.71%
Vauxhall Vectra Elegance 16V 2,413 1,162 112 52.80% 48.16%
Vauxhall Vectra Elegance DTI 16V 3,012 1,125 189 43.63% 37.35%
Vauxhall Vectra SRI 16V 3,327 1,420 202 48.75% 42.68%
Vauxhall Vectra GSI V6 546 271 58 60.26% 49.63%
VW Passat 329 240 12 76.60% 72.95%
VW Passat S TDI 6,583 3,865 253 62.56% 58.71%
VW Passat SE TDI 12,646 8,142 464 68.05% 64.38%
VW Passat Sport 20V Turbo 826 471 46 62.59% 57.02%
With your data in an xls sheet
add in an additional column in front of every column
Then add | x 2 in front of every cell in every column and same again in the first blank column after the data
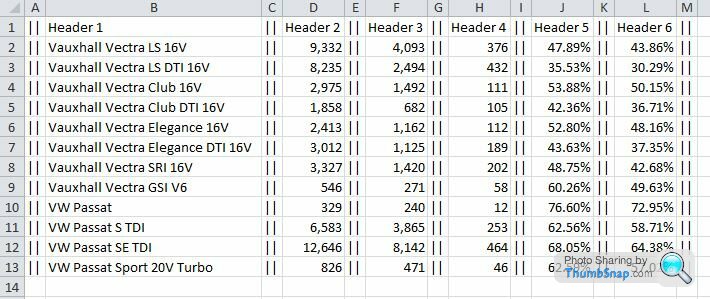
Then copy it all into a post on here
| Header 1 | Header 2 | Header 3 | Header 4 | Header 5 | Header 6 |
| Vauxhall Vectra LS 16V | 9,332 | 4,093 | 376 | 47.89% | 43.86% |
| Vauxhall Vectra LS DTI 16V | 8,235 | 2,494 | 432 | 35.53% | 30.29% |
| Vauxhall Vectra Club 16V | 2,975 | 1,492 | 111 | 53.88% | 50.15% |
| Vauxhall Vectra Club DTI 16V | 1,858 | 682 | 105 | 42.36% | 36.71% |
| Vauxhall Vectra Elegance 16V | 2,413 | 1,162 | 112 | 52.80% | 48.16% |
| Vauxhall Vectra Elegance DTI 16V | 3,012 | 1,125 | 189 | 43.63% | 37.35% |
| Vauxhall Vectra SRI 16V | 3,327 | 1,420 | 202 | 48.75% | 42.68% |
| Vauxhall Vectra GSI V6 | 546 | 271 | 58 | 60.26% | 49.63% |
| VW Passat | 329 | 240 | 12 | 76.60% | 72.95% |
| VW Passat S TDI | 6,583 | 3,865 | 253 | 62.56% | 58.71% |
| VW Passat SE TDI | 12,646 | 8,142 | 464 | 68.05% | 64.38% |
| VW Passat Sport 20V Turbo | 826 | 471 | 46 | 62.59% | 57.02% |
B'stard Child said:
The PH Table format works brilliantly within an xls sheet
With your data in an xls sheet
add in an additional column in front of every column
Then add | x 2 in front of every cell in every column and same again in the first blank column after the data
Then copy it all into a post on here
Thanks for taking the time to produce such an excellent tutorial Son of Alan, it is greatly appreciated. Is there a similar trick for Excel graphs, please, for it is with these that I will be mainly concerned from now?With your data in an xls sheet
add in an additional column in front of every column
Then add | x 2 in front of every cell in every column and same again in the first blank column after the data
Then copy it all into a post on here
| Header 1 | Header 2 | Header 3 | Header 4 | Header 5 | Header 6 |
| Vauxhall Vectra LS 16V | 9,332 | 4,093 | 376 | 47.89% | 43.86% |
| Vauxhall Vectra LS DTI 16V | 8,235 | 2,494 | 432 | 35.53% | 30.29% |
| Vauxhall Vectra Club 16V | 2,975 | 1,492 | 111 | 53.88% | 50.15% |
| Vauxhall Vectra Club DTI 16V | 1,858 | 682 | 105 | 42.36% | 36.71% |
| Vauxhall Vectra Elegance 16V | 2,413 | 1,162 | 112 | 52.80% | 48.16% |
| Vauxhall Vectra Elegance DTI 16V | 3,012 | 1,125 | 189 | 43.63% | 37.35% |
| Vauxhall Vectra SRI 16V | 3,327 | 1,420 | 202 | 48.75% | 42.68% |
| Vauxhall Vectra GSI V6 | 546 | 271 | 58 | 60.26% | 49.63% |
| VW Passat | 329 | 240 | 12 | 76.60% | 72.95% |
| VW Passat S TDI | 6,583 | 3,865 | 253 | 62.56% | 58.71% |
| VW Passat SE TDI | 12,646 | 8,142 | 464 | 68.05% | 64.38% |
| VW Passat Sport 20V Turbo | 826 | 471 | 46 | 62.59% | 57.02% |
Car_Nut said:
Thanks for taking the time to produce such an excellent tutorial Son of Alan, it is greatly appreciated.
Not a problem at all - the forum has a functionality that very few have and it's well worth usingMy issue with the way you were doing it as an image meant that the pictures had to be exactly the same size for the data to flow in matched columns
Car_Nut said:
Is there a similar trick for Excel graphs, please, for it is with these that I will be mainly concerned from now?
Graphs I don't believe there is but copying and pasting into paint and uploading as an image is easy enough Car_Nut said:
STATISTICAL ANALYSIS OF CAR SURVIVAL
This work began as a contribution to the “Everyday cars that are starting to disappear” thread, born out of frustration that, interesting though most of posts were, they were entirely subjective in nature, and a consequent desire to introduce a degree of rigour and objective measurement to the process. What was intended to be a discrete post grew to the extent that I became guilty of the heinous crime of threadjacking. I was suggested by Seek that this subject was best split out to become something that could be referenced discretely, and that I copied my posts across. My apologies for the inordinate time that it has taken me to do this, but I have become incredibly busy. In consequence, my posts are likely to become rather sporadic for at least the next two to three months: unfortunately, car statistics take second place to earning my daily crust.
Excellent work Car_Nut.This work began as a contribution to the “Everyday cars that are starting to disappear” thread, born out of frustration that, interesting though most of posts were, they were entirely subjective in nature, and a consequent desire to introduce a degree of rigour and objective measurement to the process. What was intended to be a discrete post grew to the extent that I became guilty of the heinous crime of threadjacking. I was suggested by Seek that this subject was best split out to become something that could be referenced discretely, and that I copied my posts across. My apologies for the inordinate time that it has taken me to do this, but I have become incredibly busy. In consequence, my posts are likely to become rather sporadic for at least the next two to three months: unfortunately, car statistics take second place to earning my daily crust.
As stated it deserves a thread of it's own.
I was wondering what happened to the car data.
I'm glad you went through with this thread as while some many say it's not for them.
Others, like me can appreciate the time and effort that's gone into making them.
Will be following this as I find the car survival quite interesting as there are plenty of once common cars that are disappearing.
I'm glad you went through with this thread as while some many say it's not for them.
Others, like me can appreciate the time and effort that's gone into making them.
Will be following this as I find the car survival quite interesting as there are plenty of once common cars that are disappearing.
 t like this.
FAMILY HATCHBACK SURVIVAL
This is a greatly expanded update of my earlier analysis, which only covered the Ford Focus, Honda Civic, Peugeot 307 & 308, Renault Megane, Vauxhall Astra, and the VW Golf). This is now a reasonably comprehensive analysis of the segment, within my self-imposed constraint of sixteen model lines. I have also brought it up to the standard of my later work.
The analysis is based on the official Government data published by the DfT, which is only available fully from 2001 onwards. Hence this forms the start date for this survey. All figures are quoted as at 31 December 2015.
The sixteen models considered in this analysis are:
One interesting by product of this exercise was to spot that there are literally thousands of Megane convertibles around 15 years old that are SORNed. Given that the snapshot was taken on 31 December 2015, some of these will have been laid up for the Winter, but one suspects that most are much-loved cars that are sitting quietly rotting in front gardens, awaiting miraculous resurrections.
I have, however, retained all hatchback performance variants: this is PH after all! In any case, in these days of subtle graduations from slightly warm hatches to full fat road burners, where does one draw the line?
Given that graphs with more than eight lines become difficult to read, the initial graphical analysis splits the cars into two groups of cars (marque names A-K, and M-Z). Where appropriate, the top and bottom performing few models are then presented together for comparison.
Lets start by looking at the numbers of first registrations, for the two groups.
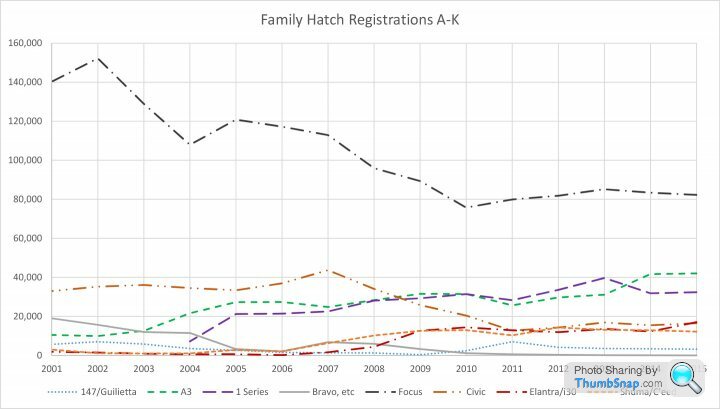
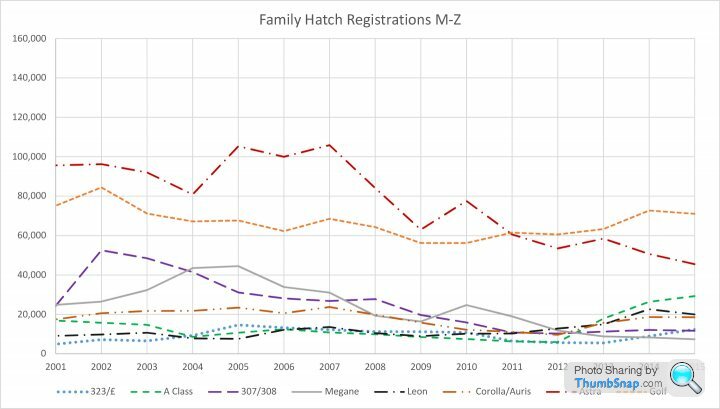
I believe these two graphs to be self-explanatory.
As the majority of the models in the family hatch market segment have been included, and indeed the overwhelming majority in sales terms, we can make a reasonably close estimate of the total number of family hatchbacks registered in each year, by adding the figures for the sixteen models considered together:

In general, over the period, there has been a modest downward sales trend: sales declining by 12.5% between 2001 and 2015. There are other trends within this overall picture, however. For the models considered sales peaked in 2002 before declining by 32.7% to the bottom of the market in 2012. Sales then recovered after 2012, by 16.9% to 2015.
There are a number theories that we could advance for the curve. Family hatchbacks are often cited as the fiercest part of the battleground between manufacturers, that competition has not only been from within the sector but from without it as it has been squeezed between the increasing size and habitability of Superminis, and increased aspirations for premium cars. It can be seen the main fall in sales occurred between 2007 and 2011, it therefore could be argued that in the 2008 financial crash, and its fall-out, a proportion of former family hatchback buyers traded downwards to the Supermini segment.
What is clear is that there has been a change in buying habits within the segment as can be seen in the next graph, which is limited to cars that managed to achieve 35,000 new registrations in any year of our period:

As I am sure that all of us have observed on the roads, buyers have shifted from the traditional models towards those perceived by the buying public as having more prestigious badges, and to a lesser extent, the new economy brands from Korea. Of the dominant triumvirate at the start of the period, only the Golf has managed to maintain its share of the market segment, the decline of the Astra since 2010 has been rapid, however, although the Focus has lost much of its dominance, it remains top dog, for now at least. French cars have also experienced progressive decline over the period: is the Peugeot-GM Europe merger a case of tying oneself to a corpse? The gainers have been the “prestige brands”, and the Koreans.
There are some glitches with the 2015 data: there appears to have been a change of collection methodology in 2015, which is always the bane of analysis, but the practice of pre-registration might also be having a distorting impact on the data (applies to several recent years).
Pre-registration is an interesting issue: in the case of almost all of these cars the SORN rate for 2015 cars is some way above that for 2014 cars, and in the years leading up to this. It should be stressed that there are other possible explanations, other than pre-registration, for this phenomenon (not least the first registration and sale process); however, I still find the following first year SORN rates interesting as a possible indicator of who it appears might have been maintaining market share artificially through pre-registrations at the end of 2015 (I start to look a bit askance at anything with a first year SORN rate of more than a third of a percent):
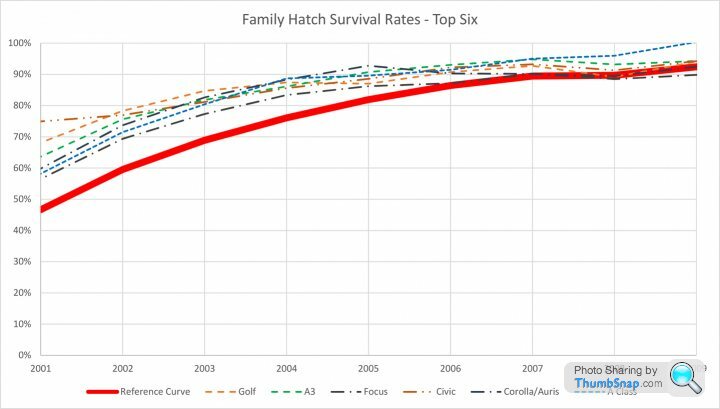
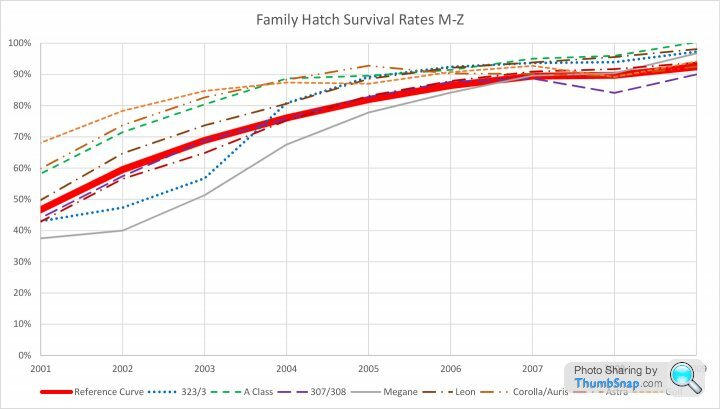
Moving onto survival rates the graphs for the 2001 to 2014 period for the two groups are as follows:
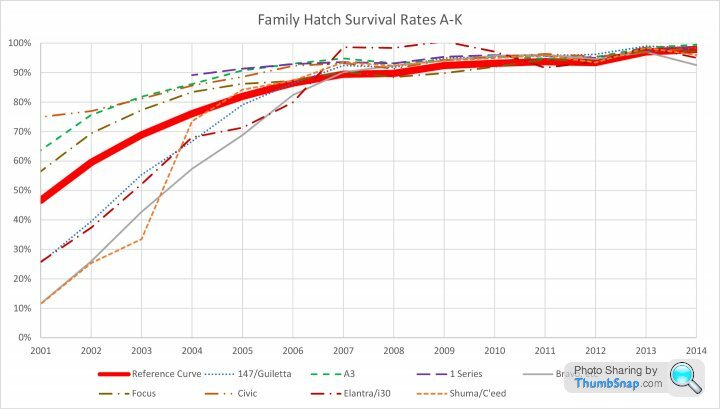

As nothing much interesting happens in the 2009 to 2014 period, as one would expect, this second graph zooming into the 2001 to 2009 period is a bit clearer.
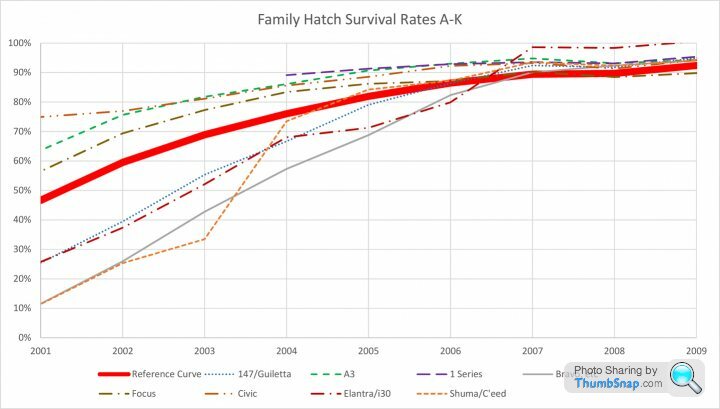
Overall, it can be seen that battle for supremacy in the survival stakes is between the Golf and the Civic (but see comments below), closely pursued by the Audi A3, but whereas Golfs eventually start to pass on to the great car park in the sky, Civics just seem to keep going on and on, with no evidence of a ‘death curve’ yet emerging, unlike anything else in the class. The effect is even more marked when one looks at the number that are still taxed and on the roads: once they get more than six years old the SORN rate is far lower than anything else bar the Golf, the Golf manages to hang on until after thirteen years the rate of increase of Golf SORNing rate markedly exceeds that of the Civic, whose surviving examples are more likely to be still earning their keep.
The top three are pursued closely by a gaggle that is, in fairly clear order the Corolla, the Mercedes A-Class, and the Focus. All of whom achieve creditable survival rates that are comfortably above the Reference Curve. On current trends, the BMW 1 Series might well be on course to supplant the Civic at the top, but as the model range was only introduced in 2004, the earliest examples are not yet old enough for ‘top of the class’ consideration, given the high standards achieved by the top six whose comparative performance can be seen here:

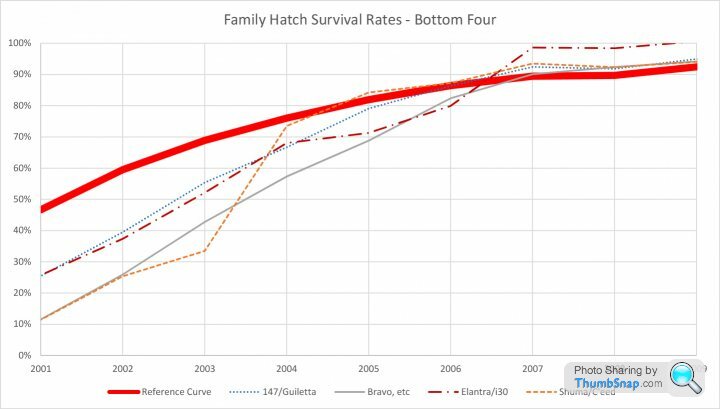
Leaving out the boring stuff in the middle, we come to the worst performing four: two closely matched Italo-Korean pairs screaming to oblivion, vying for the accolade of Britain’s worst surviving hatchback. Bad though the record of Alfa 147 and the Hyundai Elantra are, the Kia Shuma and the original Fiat Bravo/Brava beat them, with the Kia’s 11.45% survival rate just edging out the Fiat’s 11.55% survival rate at fourteen years old. These are truly dreadful records, made still worse by the above average survival record of the class as a whole. To date this pair have the worst survival rate yet examined in any class. This quartet even manage to make the survival performance of the Renault Megane 2 look relatively good, itself a pretty dreadful performer.
SORN rates are interesting: by the time that we get to the oldest cars in our survey the Toyota Corolla has a similar SORN rate to the Civic, but I would suggest that this is commentary on both the famously rapacious Toyota spare parts prices and the undesirability of the Corolla, so that broken Corollas are thrown away, not put aside to repair when times are propitious. Using the logic of perceived desirability to their owners it is not surprising to discover that, at fourteen years old, the Mercedes A-Class has the greatest absolute percentage of original registrations SORNed (7.1%), and the that Alfa-Romeo 147 has the greatest likelihood of survivors being SORNed: a whopping 25.3%. For comparison, the figures for the Civic are just 3.7% and 5.0% respectively. (Headline stat a new Leon is almost as likely to be SORNed as a fourteen year old Civic!).
In my earlier assessments of survival rates, based on a small sample of each, I predicted survival rates for 2003 for the Focus, Golf, and Astra of 81.2%, 81.1%, and 69.2% respectively. In fact, the actual rates were 77.3%, 84.7%, and 64.8%, the biggest issue was overstating the relative survival rate of the Focus, as a result of being too interested in the performance and top spec variants, which as we have seen tend to survive better.
As we have captured the overwhelming majority of cars in this segment we can thus show the overall survival rate curve for the segment as a whole.

We can see that, as one would expect, as a group family hatches survive a little better than the average for Britain’s car population as a whole. The relative difference between the two graphs widens as the cars age, widening exponentially from a 1% for seven year old cars to over 13% for fourteen year old cars.
Looking at each model in greater detail:
Alfa-Romeo 147 & Giulietta – it is disappointing to see the poor survival rate of the 147, having seemed a jolly little thing renting one in Italy, possibly because of the special frisson that one gets driving an Alfa in Italy. Although, even with the rose-tinted view that this gave, it never seemed to be a quality car. Its survival performance is pretty dreadful, with the “death curve” starting at only eight years and an ever increasing proportion of the survivals dying every year thereafter, until between thirteen and fourteen years of age over 35% of the survivors become scrap metal. If Alfista want a decent 147 for their collection they need to act soon. It is far too early to project the Giulietta survival rate.
Audi A3 – given that the A3 is effectively a premium version of the VW Golf, it is perhaps a little surprising that the A3 clearly lags Golf survival once the cars are more than a decade old, with a margin that increases over time, although the fact that the A3 gets the earlier generation change to the new VW Group platform slightly complicates the comparison. For 2001 cars, the gross survival rate differential between the two cars is 4.5%, which equates to a 6.5% higher probability of survival for the Golf. At present, there appears to be no great difference in survival rate at the transition between the First and Second Generation A3s. Naturally, it is too early to give an opinion on the Third Generation survival rate.
BMW 1 Series – given that there are relatively few 2011 F20/F21s and few 2012 registered E81/E87s, the transition between the two models should become easy to call, unfortunately the survival rate is still much too high at this relatively young age to assess the issue. The prospects appear excellent for the E81/E87 to set a new benchmark for longevity in the class, the survival rate for the earliest 2004 cars being 1.72% (gross) above that of 2004 Golfs, equivalent to a 1.97% higher probability of survival. But we will need a couple more years of data to confirm this, and the 1 Series’ survival rate is not suddenly going to tip into a screaming death curve (one can always hope as age has not leant any enchantment to the 1 Series’ pug-ugly looks in my view). So at present 1 Series owners can sit comfortably in the knowledge that not only is have a good chance of becoming the best surviving car in its market segment, but it is right up there as a contender for the coveted title of Britain’s ugliest car.
Fiat Bravo/Brava, Stilo & Bravo – Fiat deserve to be congratulated, in that they managed to replace the original Bravo/Brava, a real contender for the title of Britain’s worst surviving car with the Stilo a car that appears to have an equally poor survival rate: at the transition between the two models not a waver can be seen in what is not so much a “death curve”, but near vertical plunge to extinction. This is a real achievement in a perverse sort of way. The oldest surviving cars in our survey died at a rate of 55.5% of the surviving stock per annum. Given that these were figures for the end of 2015, this is definitely the last call for all those who want to save a UK Bravo/Brava to show future generations. When we viewed our present house, over ten years ago, the remains of one was in the garage, which was being sold off bit by bit on eBay: the son of the house had one on which some vital electrical component had failed and he had worked out that it was cheaper to buy another complete car to get the component that he wanted, and then make money selling other bits of it off on eBay. It is also the time for anyone who wants to save a Stilo for posterity to act. The new Bravo had not yet entered its death curve on the 2016 DfT figures, but was just at the point where one would expect one to start: when the 2017 figures, which should run to the end of 2016, are released by the DfT in couple of weeks’ time this will be one to watch. As we will see with the Panda, Fiat can do much better than this.
Ford Focus – a very solid performance in the PH survival stakes, across all incarnations of the Focus, showing the progress that Ford has made over the past two decades. The survival rate for Focuses over ten years old appears set to exceed that of the Golf, once the Golf Mk 4 drops off the end of our graph (see below). The only fly in the ointment is that it appears that the survival rate of the Mk 2 Focus is not quite up to that of the Mk 1, with the survival rate dropping by approximately 3% across the transition, although we what we do not yet know is whether the Mk 2 will follow the same “death curve” as the Mk 1. It is too early to yet call the Mk 2 to Mk 3 transition.
Honda Civic – given that the Sixth Generation Civic only appears for part of one year right at the beginning of our analysis, and formed only a minority of sales in that year one needs to be fairly tentative in one’s comments. However, I have disaggregated the Sixth and Seventh Generation figures out for 2001: the Sixth Generation had a 71.4% survival rate and the Seventh a 75.4% survival rate. Furthermore, the probability of a survivor being SORNed is 8.9% and 4.5% respectively. Accordingly, although both sets of figures are creditable, it would seem that the Seventh Generation represented an improvement over the Sixth, and the failure of the Civic to enter a ‘death curve’ as opposed to natural wastage is not the result of the Sixth Generation propping the tail of the figures up, indeed the contrary applies. The Seventh to Eighth Generation transition appears smooth. On present trends, it would appear as if a majority of Seventh and Eighth Generation Civics will still be on the roads on their twentieth birthdays, which will be some achievement.
Hyundai Elantra & i30 – another manufacturer who can do far better, as we will see when we get to the Getz (which has one of the best survival rates in its market segment). The Elantra just misses out from being the third worst survivor in its market segment: its 25.75% survival rate for 2001 cars is edged out by the Alfa 147s 25.45% rate. But at least 21.6% are taxed and on the road, as opposed to 19.0% for the Alfa. But that is the good news, at the transition between the Elantra and the first Generation i30, the i30 is performing even worse. This is another model for which we will need another year or two’s worth of figures to confirm the trend, but at the end of 2015 the earliest i30s are doing worse, even than Kias and Fiats of equivalent age: were the trend to continue it would mean that for all practical purposes early i30s would be extinct inside thirteen years. But let’s wait to see what this month’s figures show….
Kia Shuma, Cerato & C’eed – it is undoubtedly a good thing that Kias are now merely re-styled Hyundais, as Kia cars’ survival record as a unique manufacturer is the second worst of any that I have examined to date, only Daewoo beating it, and is consistently poor across all models examined (so far), as we will see in due course. Hopefully, current Kias will survive better, although personally I would want to see some evidence of it before slapping any money down on one. The Shuma’s 11.45% survival rate for 2001 registered cars is the worst of any car that I have examined in detail to date, and much as one would want to make excuses for it, it must be indicative of a fundamental build that was not equipped for durability in British conditions. The only positive thing that one can say is that 9.02% of all 2001 registered Shumas were taxed at the end of 2015, as opposed to 8.83% of Fiat Bravo/Bravas, which I would suggest indicates that the inherent survivability of the Kia is higher than the Fiat, but that Fiat owners are more attached to their cars. Fortunately, the Kia Cerato appears a much better prospect, at the transition between it and the Shuma, the step appears to be of the order of 20% gross, which means that an eleven-year-old Cerato is approximately 60% more likely to survive than a Shuma, which is an encouraging sign. The oldest Ceratos just dip under the Standard Reference Curve with what appears to be the start of steepening ‘death curve’, again another year or two of data will be required to see if its survival rate can keep in touch with that cars such as the Vauxhall Astra and Renault Megane. Although the transition between the Cerato and the C’eed is somewhat uneven, broadly, the C’eed appears to share the improved survival performance of the Cerato.
Mazda 323 & 3 – the 323 BH has just about the weirdest survival curve of anything that I have seen: make of it what you want, generally it is well below average, almost Megane-bad but then perks up for the oldest models to hit the Standard Reference Curve. Let’s call it as below average. All versions of the Mazda3 perform well, achieving above average survival rates, and on a par with the better surviving cars in the market segment.
Mercedes A Class – a good performance from the W168, putting it a clear fourth in the PH survival stakes in the market segment. But the transition to the W169 resulted in a drop in the survival rate at the transition with the W168 of around 2.5% gross, equivalent to a decrease of around 2.8% in survival probability at the transition. While survival rate of the W169 is still good, and well up with ‘best in class’, its ‘death curve’ commences at only six years old, albeit gently. Naturally, it is still far too soon to assess the survival performance of the, radically different, W176.
Peugeot 307 & 308 – a solid performance, with the survival rate pinned almost exactly to the overall reference trend line. A consistent performance across the transition between the 307 and 308, although it appears that the survival rate for the 307 might be around 4% better than that for the 308 as the cars approach the end of their first decade, so the long-term survival performance might drop a little as the 308s age.
Renault Megane – not a good survival performance; however, it seems that the main problem with survival rates afflicted the Megane 2, and the early signs are that the Megane 3 might well be more durable, although one needs to exercise caution when attempting to link a high survival rate in the first few years to long-term durability. The Megane 1 is already rare on our roads, with the Megane 2 are set to follow it over the next few years, most of which are now no longer shaking their backsides! The survival rate dropped by 15-20% gross at the transition between the Megane 1 and the Megane 2, which given that the survival rate of Megane 1 is not particularly impressive means that at thirteen years a Megane 1 has around twice the survival rate of a Megane 2.
Seat Leon – as one would expect the Golf’s Spanish sister, lags some way below both of its German sisters, but is pinned closely to the average survival rate curve for the market segment. The transition between the First and Second generations appears reasonably smooth, lacking the downward blip of the Mk 4 to 5 transition for the Golf, possibly all of those crashed First Generation Leon Cupras has kept the First Generation survival rate down? A competent and unremarkable performance: a Leon is bit more likely to survive than a 307 or an Astra.
Toyota Corolla & Auris – zzzzzzzzzzzzzzz, sorry fell asleep thinking too deeply about the Toyota Corolla. As with other Toyota models, an impressive survival rate for the earlier models in the survey, drops off sharply for cars built after the mid-2000s: 2005 in the case of the Corolla. Is this enough, can I move on please? Alright then, key stat: one had to buy a post-2009 Auris to buy a Corolla/Auris with a better survival rate than a 2005 Corolla, as at 31 December 2015.
Vauxhall Astra – Some might regard the Astra’s performance in the PH survival stakes as symptomatic of the car itself: average, competent, and unspectacular. The Astra’s survival rate is pinned closely to the Standard Reference Curve, but lags the class average. The survival rate appears to be unchanged by the regenerations from Mk IV to Mk V.
Volkswagen Golf – It is clear that there are two distinct curves to the graph, with that up to the last full year of Mk 4 sales in 2003, having a higher trend than that from 2005 onwards (the first full year of Mk 5 sales). This is no surprise to me, having ownership experience either side of the Mk 4/5 divide, I have been of the opinion for some years that the durability and quality of components used reached a high point with the Mk 4, and that the Mk 5 was part of the start of a drastic deterioration in underlying product quality for the VW Group as a whole. Having said that the Mk 4 is a fairly stodgy drive, in my view, whereas the Mk 5 is a lot sharper and more fun to drive – it just depends on whether one is paying for one’s own motoring or not. I predict that the overall survival rate of Golfs is likely to fall over time, as the Mk 4s fall off the end of our graph. Naturally, it is too early to comment on the relative survival rates of the Mk 6 and the Mk 7, although the Mk 6 is really just a mid-lift facelift of the Mk 5.
I will give it a couple of days for this post to be read and discussed, as necessary, then I will post the luxury car analysis, which I think is good to go as it was. There will then be a bit of a pause before I repost the Supermini analysis, as I will be swapping out the Peugeot 106 line for the 206 line, in line with the requests. To match this, I will also swap out the Hyundai Getz/i10 line for the i20 line (which at least will bump up the city car survival rate). As I am rather busy at present this might take a while.
This is a greatly expanded update of my earlier analysis, which only covered the Ford Focus, Honda Civic, Peugeot 307 & 308, Renault Megane, Vauxhall Astra, and the VW Golf). This is now a reasonably comprehensive analysis of the segment, within my self-imposed constraint of sixteen model lines. I have also brought it up to the standard of my later work.
The analysis is based on the official Government data published by the DfT, which is only available fully from 2001 onwards. Hence this forms the start date for this survey. All figures are quoted as at 31 December 2015.
The sixteen models considered in this analysis are:
- Alfa-Romeo 147/Giulietta: 147 to 2009, Guiletta 2010 to date.
- Audi A3: First Generation to 2003, Second Generation 2003 to 2012, Third Generation 2012 on.
- BMW 1 Series: E81/E87 2004 to 2012, F20/F21 2011 on.
- Fiat Bravo/Brava/Stilo/Bravo: original Bravo/Brava to 2002, Stilo 2002 to 2007, new Bravo 2007 to 2014.
- Ford Focus: Mk 1 to 2005, Mk 2 2005 to 2011, Mk 3 2011 to date.
- Honda Civic: Sixth Generation to 2001, Seventh Generation 2001 to 2005, Eighth Generation 2005 to 2011, Ninth Generation 2011 to 2015.
- Hyundai Elantra/i30: Elentra to 2006, i30 First Generation 2007 to 2012, Second Generation 2012 on (replaced 2017).
- Kia Shuma/Cerato/C’eed: Shuma to 2003 (plus 206 No. in 2004), Cerato 2004 to 2007 (only 287 No. in 2007), C’eed First Generation 2007 to 2012, C’eed Second Generation 2012 on.
- Mazda 323/3: 323 BH to 2003 (plus 130 No. in 2004), 3 BK 2004 to 2009 (plus 191 No. in 2003), 3 BL 2009 to 2013, 3 BM 2013 to date.
- Mercedes A Class: W168 to 2004, W169 2005 to 2012, W176 2012 to date.
- Peugeot 307/308: 307 2001 to 2007, 308 2007 to date.
- Renault Megane: Megane 1 to 2002, Megane 2 2002 to 2009, Megane 3 2008 to 2016.
- Seat Leon: First Generation to 2005, Second Generation 2005 to 2013, Third Generation 2013 on.
- Toyota Corolla/Auris: Corolla E120 to 2007. Auris E150 2007 to 2012, Auris E180 2012 to date.
- Vauxhall Astra: Astra Mk IV to 2004, Astra Mk V 2004 to 2010, Astra Mk VI 2010 to 2015.
- Volkswagen Golf: Mk 4 to 2004. Mk 5 2004 to 2009, Mk 6 2009 to 2014, Mk 7 2014 to date.
One interesting by product of this exercise was to spot that there are literally thousands of Megane convertibles around 15 years old that are SORNed. Given that the snapshot was taken on 31 December 2015, some of these will have been laid up for the Winter, but one suspects that most are much-loved cars that are sitting quietly rotting in front gardens, awaiting miraculous resurrections.
I have, however, retained all hatchback performance variants: this is PH after all! In any case, in these days of subtle graduations from slightly warm hatches to full fat road burners, where does one draw the line?
Given that graphs with more than eight lines become difficult to read, the initial graphical analysis splits the cars into two groups of cars (marque names A-K, and M-Z). Where appropriate, the top and bottom performing few models are then presented together for comparison.
Lets start by looking at the numbers of first registrations, for the two groups.
I believe these two graphs to be self-explanatory.
As the majority of the models in the family hatch market segment have been included, and indeed the overwhelming majority in sales terms, we can make a reasonably close estimate of the total number of family hatchbacks registered in each year, by adding the figures for the sixteen models considered together:
In general, over the period, there has been a modest downward sales trend: sales declining by 12.5% between 2001 and 2015. There are other trends within this overall picture, however. For the models considered sales peaked in 2002 before declining by 32.7% to the bottom of the market in 2012. Sales then recovered after 2012, by 16.9% to 2015.
There are a number theories that we could advance for the curve. Family hatchbacks are often cited as the fiercest part of the battleground between manufacturers, that competition has not only been from within the sector but from without it as it has been squeezed between the increasing size and habitability of Superminis, and increased aspirations for premium cars. It can be seen the main fall in sales occurred between 2007 and 2011, it therefore could be argued that in the 2008 financial crash, and its fall-out, a proportion of former family hatchback buyers traded downwards to the Supermini segment.
What is clear is that there has been a change in buying habits within the segment as can be seen in the next graph, which is limited to cars that managed to achieve 35,000 new registrations in any year of our period:
As I am sure that all of us have observed on the roads, buyers have shifted from the traditional models towards those perceived by the buying public as having more prestigious badges, and to a lesser extent, the new economy brands from Korea. Of the dominant triumvirate at the start of the period, only the Golf has managed to maintain its share of the market segment, the decline of the Astra since 2010 has been rapid, however, although the Focus has lost much of its dominance, it remains top dog, for now at least. French cars have also experienced progressive decline over the period: is the Peugeot-GM Europe merger a case of tying oneself to a corpse? The gainers have been the “prestige brands”, and the Koreans.
There are some glitches with the 2015 data: there appears to have been a change of collection methodology in 2015, which is always the bane of analysis, but the practice of pre-registration might also be having a distorting impact on the data (applies to several recent years).
Pre-registration is an interesting issue: in the case of almost all of these cars the SORN rate for 2015 cars is some way above that for 2014 cars, and in the years leading up to this. It should be stressed that there are other possible explanations, other than pre-registration, for this phenomenon (not least the first registration and sale process); however, I still find the following first year SORN rates interesting as a possible indicator of who it appears might have been maintaining market share artificially through pre-registrations at the end of 2015 (I start to look a bit askance at anything with a first year SORN rate of more than a third of a percent):
| Alfa Giulietta: | 1.61% |
| Audi A3 | 0.72% |
| BMW 1 Series | 0.57% |
| Ford Focus | 0.75% |
| Honda Civic | 0.80% |
| Hyundai i30 | 0.23% |
| Kia C’eed | 1.43% |
| Mazda3 | 0.35% |
| Mercedes A Class | 0.19% |
| Peugeot 308 | 0.88% |
| Renault Megane | 0.26% |
| Seat Leon | 3.53% |
| Toyota Auris | 0.44% |
| Vauxhall Astra | 0.65% |
| Volkswagen Golf | 0.93% |
Moving onto survival rates the graphs for the 2001 to 2014 period for the two groups are as follows:
As nothing much interesting happens in the 2009 to 2014 period, as one would expect, this second graph zooming into the 2001 to 2009 period is a bit clearer.
Overall, it can be seen that battle for supremacy in the survival stakes is between the Golf and the Civic (but see comments below), closely pursued by the Audi A3, but whereas Golfs eventually start to pass on to the great car park in the sky, Civics just seem to keep going on and on, with no evidence of a ‘death curve’ yet emerging, unlike anything else in the class. The effect is even more marked when one looks at the number that are still taxed and on the roads: once they get more than six years old the SORN rate is far lower than anything else bar the Golf, the Golf manages to hang on until after thirteen years the rate of increase of Golf SORNing rate markedly exceeds that of the Civic, whose surviving examples are more likely to be still earning their keep.
The top three are pursued closely by a gaggle that is, in fairly clear order the Corolla, the Mercedes A-Class, and the Focus. All of whom achieve creditable survival rates that are comfortably above the Reference Curve. On current trends, the BMW 1 Series might well be on course to supplant the Civic at the top, but as the model range was only introduced in 2004, the earliest examples are not yet old enough for ‘top of the class’ consideration, given the high standards achieved by the top six whose comparative performance can be seen here:
Leaving out the boring stuff in the middle, we come to the worst performing four: two closely matched Italo-Korean pairs screaming to oblivion, vying for the accolade of Britain’s worst surviving hatchback. Bad though the record of Alfa 147 and the Hyundai Elantra are, the Kia Shuma and the original Fiat Bravo/Brava beat them, with the Kia’s 11.45% survival rate just edging out the Fiat’s 11.55% survival rate at fourteen years old. These are truly dreadful records, made still worse by the above average survival record of the class as a whole. To date this pair have the worst survival rate yet examined in any class. This quartet even manage to make the survival performance of the Renault Megane 2 look relatively good, itself a pretty dreadful performer.
SORN rates are interesting: by the time that we get to the oldest cars in our survey the Toyota Corolla has a similar SORN rate to the Civic, but I would suggest that this is commentary on both the famously rapacious Toyota spare parts prices and the undesirability of the Corolla, so that broken Corollas are thrown away, not put aside to repair when times are propitious. Using the logic of perceived desirability to their owners it is not surprising to discover that, at fourteen years old, the Mercedes A-Class has the greatest absolute percentage of original registrations SORNed (7.1%), and the that Alfa-Romeo 147 has the greatest likelihood of survivors being SORNed: a whopping 25.3%. For comparison, the figures for the Civic are just 3.7% and 5.0% respectively. (Headline stat a new Leon is almost as likely to be SORNed as a fourteen year old Civic!).
In my earlier assessments of survival rates, based on a small sample of each, I predicted survival rates for 2003 for the Focus, Golf, and Astra of 81.2%, 81.1%, and 69.2% respectively. In fact, the actual rates were 77.3%, 84.7%, and 64.8%, the biggest issue was overstating the relative survival rate of the Focus, as a result of being too interested in the performance and top spec variants, which as we have seen tend to survive better.
As we have captured the overwhelming majority of cars in this segment we can thus show the overall survival rate curve for the segment as a whole.
We can see that, as one would expect, as a group family hatches survive a little better than the average for Britain’s car population as a whole. The relative difference between the two graphs widens as the cars age, widening exponentially from a 1% for seven year old cars to over 13% for fourteen year old cars.
Looking at each model in greater detail:
Alfa-Romeo 147 & Giulietta – it is disappointing to see the poor survival rate of the 147, having seemed a jolly little thing renting one in Italy, possibly because of the special frisson that one gets driving an Alfa in Italy. Although, even with the rose-tinted view that this gave, it never seemed to be a quality car. Its survival performance is pretty dreadful, with the “death curve” starting at only eight years and an ever increasing proportion of the survivals dying every year thereafter, until between thirteen and fourteen years of age over 35% of the survivors become scrap metal. If Alfista want a decent 147 for their collection they need to act soon. It is far too early to project the Giulietta survival rate.
Audi A3 – given that the A3 is effectively a premium version of the VW Golf, it is perhaps a little surprising that the A3 clearly lags Golf survival once the cars are more than a decade old, with a margin that increases over time, although the fact that the A3 gets the earlier generation change to the new VW Group platform slightly complicates the comparison. For 2001 cars, the gross survival rate differential between the two cars is 4.5%, which equates to a 6.5% higher probability of survival for the Golf. At present, there appears to be no great difference in survival rate at the transition between the First and Second Generation A3s. Naturally, it is too early to give an opinion on the Third Generation survival rate.
BMW 1 Series – given that there are relatively few 2011 F20/F21s and few 2012 registered E81/E87s, the transition between the two models should become easy to call, unfortunately the survival rate is still much too high at this relatively young age to assess the issue. The prospects appear excellent for the E81/E87 to set a new benchmark for longevity in the class, the survival rate for the earliest 2004 cars being 1.72% (gross) above that of 2004 Golfs, equivalent to a 1.97% higher probability of survival. But we will need a couple more years of data to confirm this, and the 1 Series’ survival rate is not suddenly going to tip into a screaming death curve (one can always hope as age has not leant any enchantment to the 1 Series’ pug-ugly looks in my view). So at present 1 Series owners can sit comfortably in the knowledge that not only is have a good chance of becoming the best surviving car in its market segment, but it is right up there as a contender for the coveted title of Britain’s ugliest car.
Fiat Bravo/Brava, Stilo & Bravo – Fiat deserve to be congratulated, in that they managed to replace the original Bravo/Brava, a real contender for the title of Britain’s worst surviving car with the Stilo a car that appears to have an equally poor survival rate: at the transition between the two models not a waver can be seen in what is not so much a “death curve”, but near vertical plunge to extinction. This is a real achievement in a perverse sort of way. The oldest surviving cars in our survey died at a rate of 55.5% of the surviving stock per annum. Given that these were figures for the end of 2015, this is definitely the last call for all those who want to save a UK Bravo/Brava to show future generations. When we viewed our present house, over ten years ago, the remains of one was in the garage, which was being sold off bit by bit on eBay: the son of the house had one on which some vital electrical component had failed and he had worked out that it was cheaper to buy another complete car to get the component that he wanted, and then make money selling other bits of it off on eBay. It is also the time for anyone who wants to save a Stilo for posterity to act. The new Bravo had not yet entered its death curve on the 2016 DfT figures, but was just at the point where one would expect one to start: when the 2017 figures, which should run to the end of 2016, are released by the DfT in couple of weeks’ time this will be one to watch. As we will see with the Panda, Fiat can do much better than this.
Ford Focus – a very solid performance in the PH survival stakes, across all incarnations of the Focus, showing the progress that Ford has made over the past two decades. The survival rate for Focuses over ten years old appears set to exceed that of the Golf, once the Golf Mk 4 drops off the end of our graph (see below). The only fly in the ointment is that it appears that the survival rate of the Mk 2 Focus is not quite up to that of the Mk 1, with the survival rate dropping by approximately 3% across the transition, although we what we do not yet know is whether the Mk 2 will follow the same “death curve” as the Mk 1. It is too early to yet call the Mk 2 to Mk 3 transition.
Honda Civic – given that the Sixth Generation Civic only appears for part of one year right at the beginning of our analysis, and formed only a minority of sales in that year one needs to be fairly tentative in one’s comments. However, I have disaggregated the Sixth and Seventh Generation figures out for 2001: the Sixth Generation had a 71.4% survival rate and the Seventh a 75.4% survival rate. Furthermore, the probability of a survivor being SORNed is 8.9% and 4.5% respectively. Accordingly, although both sets of figures are creditable, it would seem that the Seventh Generation represented an improvement over the Sixth, and the failure of the Civic to enter a ‘death curve’ as opposed to natural wastage is not the result of the Sixth Generation propping the tail of the figures up, indeed the contrary applies. The Seventh to Eighth Generation transition appears smooth. On present trends, it would appear as if a majority of Seventh and Eighth Generation Civics will still be on the roads on their twentieth birthdays, which will be some achievement.
Hyundai Elantra & i30 – another manufacturer who can do far better, as we will see when we get to the Getz (which has one of the best survival rates in its market segment). The Elantra just misses out from being the third worst survivor in its market segment: its 25.75% survival rate for 2001 cars is edged out by the Alfa 147s 25.45% rate. But at least 21.6% are taxed and on the road, as opposed to 19.0% for the Alfa. But that is the good news, at the transition between the Elantra and the first Generation i30, the i30 is performing even worse. This is another model for which we will need another year or two’s worth of figures to confirm the trend, but at the end of 2015 the earliest i30s are doing worse, even than Kias and Fiats of equivalent age: were the trend to continue it would mean that for all practical purposes early i30s would be extinct inside thirteen years. But let’s wait to see what this month’s figures show….
Kia Shuma, Cerato & C’eed – it is undoubtedly a good thing that Kias are now merely re-styled Hyundais, as Kia cars’ survival record as a unique manufacturer is the second worst of any that I have examined to date, only Daewoo beating it, and is consistently poor across all models examined (so far), as we will see in due course. Hopefully, current Kias will survive better, although personally I would want to see some evidence of it before slapping any money down on one. The Shuma’s 11.45% survival rate for 2001 registered cars is the worst of any car that I have examined in detail to date, and much as one would want to make excuses for it, it must be indicative of a fundamental build that was not equipped for durability in British conditions. The only positive thing that one can say is that 9.02% of all 2001 registered Shumas were taxed at the end of 2015, as opposed to 8.83% of Fiat Bravo/Bravas, which I would suggest indicates that the inherent survivability of the Kia is higher than the Fiat, but that Fiat owners are more attached to their cars. Fortunately, the Kia Cerato appears a much better prospect, at the transition between it and the Shuma, the step appears to be of the order of 20% gross, which means that an eleven-year-old Cerato is approximately 60% more likely to survive than a Shuma, which is an encouraging sign. The oldest Ceratos just dip under the Standard Reference Curve with what appears to be the start of steepening ‘death curve’, again another year or two of data will be required to see if its survival rate can keep in touch with that cars such as the Vauxhall Astra and Renault Megane. Although the transition between the Cerato and the C’eed is somewhat uneven, broadly, the C’eed appears to share the improved survival performance of the Cerato.
Mazda 323 & 3 – the 323 BH has just about the weirdest survival curve of anything that I have seen: make of it what you want, generally it is well below average, almost Megane-bad but then perks up for the oldest models to hit the Standard Reference Curve. Let’s call it as below average. All versions of the Mazda3 perform well, achieving above average survival rates, and on a par with the better surviving cars in the market segment.
Mercedes A Class – a good performance from the W168, putting it a clear fourth in the PH survival stakes in the market segment. But the transition to the W169 resulted in a drop in the survival rate at the transition with the W168 of around 2.5% gross, equivalent to a decrease of around 2.8% in survival probability at the transition. While survival rate of the W169 is still good, and well up with ‘best in class’, its ‘death curve’ commences at only six years old, albeit gently. Naturally, it is still far too soon to assess the survival performance of the, radically different, W176.
Peugeot 307 & 308 – a solid performance, with the survival rate pinned almost exactly to the overall reference trend line. A consistent performance across the transition between the 307 and 308, although it appears that the survival rate for the 307 might be around 4% better than that for the 308 as the cars approach the end of their first decade, so the long-term survival performance might drop a little as the 308s age.
Renault Megane – not a good survival performance; however, it seems that the main problem with survival rates afflicted the Megane 2, and the early signs are that the Megane 3 might well be more durable, although one needs to exercise caution when attempting to link a high survival rate in the first few years to long-term durability. The Megane 1 is already rare on our roads, with the Megane 2 are set to follow it over the next few years, most of which are now no longer shaking their backsides! The survival rate dropped by 15-20% gross at the transition between the Megane 1 and the Megane 2, which given that the survival rate of Megane 1 is not particularly impressive means that at thirteen years a Megane 1 has around twice the survival rate of a Megane 2.
Seat Leon – as one would expect the Golf’s Spanish sister, lags some way below both of its German sisters, but is pinned closely to the average survival rate curve for the market segment. The transition between the First and Second generations appears reasonably smooth, lacking the downward blip of the Mk 4 to 5 transition for the Golf, possibly all of those crashed First Generation Leon Cupras has kept the First Generation survival rate down? A competent and unremarkable performance: a Leon is bit more likely to survive than a 307 or an Astra.
Toyota Corolla & Auris – zzzzzzzzzzzzzzz, sorry fell asleep thinking too deeply about the Toyota Corolla. As with other Toyota models, an impressive survival rate for the earlier models in the survey, drops off sharply for cars built after the mid-2000s: 2005 in the case of the Corolla. Is this enough, can I move on please? Alright then, key stat: one had to buy a post-2009 Auris to buy a Corolla/Auris with a better survival rate than a 2005 Corolla, as at 31 December 2015.
Vauxhall Astra – Some might regard the Astra’s performance in the PH survival stakes as symptomatic of the car itself: average, competent, and unspectacular. The Astra’s survival rate is pinned closely to the Standard Reference Curve, but lags the class average. The survival rate appears to be unchanged by the regenerations from Mk IV to Mk V.
Volkswagen Golf – It is clear that there are two distinct curves to the graph, with that up to the last full year of Mk 4 sales in 2003, having a higher trend than that from 2005 onwards (the first full year of Mk 5 sales). This is no surprise to me, having ownership experience either side of the Mk 4/5 divide, I have been of the opinion for some years that the durability and quality of components used reached a high point with the Mk 4, and that the Mk 5 was part of the start of a drastic deterioration in underlying product quality for the VW Group as a whole. Having said that the Mk 4 is a fairly stodgy drive, in my view, whereas the Mk 5 is a lot sharper and more fun to drive – it just depends on whether one is paying for one’s own motoring or not. I predict that the overall survival rate of Golfs is likely to fall over time, as the Mk 4s fall off the end of our graph. Naturally, it is too early to comment on the relative survival rates of the Mk 6 and the Mk 7, although the Mk 6 is really just a mid-lift facelift of the Mk 5.
I will give it a couple of days for this post to be read and discussed, as necessary, then I will post the luxury car analysis, which I think is good to go as it was. There will then be a bit of a pause before I repost the Supermini analysis, as I will be swapping out the Peugeot 106 line for the 206 line, in line with the requests. To match this, I will also swap out the Hyundai Getz/i10 line for the i20 line (which at least will bump up the city car survival rate). As I am rather busy at present this might take a while.
An excellent analysis.
Looks like our family, well my, shedding choices are the correct ones. The Wife loves her 2001 MK4 Golf and as they don't rust it has got at least another ten years left in it I'd say.
I've previously shedded a MK1 Focus which, like you, I maintain is a much better car than the MK4 Golf but sadly they do rust.
I'm surprised about the Civic though as they used to rust badly. The problem with Jap cars (Honda's / Toyoya) as I see it and from trying to shed one many years ago is that they don't generally go wrong but when they do, the cost can be massive. You could have a single issue that on say a Ford or VW would cost little enough to keep a shed shedding but on a Jap car it could easily be an uneconomcal repair.
I look forward to your next installment which will hopefully include the B5.5 Passat, which I'm hoping will be included because I personally shed one and believe it will be near the top if not at the top for survivability.
I'd also really like to see the Passat in your analysis as the change from B5.5 to B6 in around 2004/05 I think will show that the B6 is where VW really dropped the ball, much more than is evidenced in the change from the MK4 to MK5 Golf. The B6 has a stupid electric handbrake that expensively fails, oil pump shaft drive problems and rusts like an old Ford, so much so it seems that VW forgot what they once knew.
Top Stating Car Nut.
It is interesting that the Land Cruiser, which is meant to be the sturdiest 4x4, at 56% and the Frontera, which is meant to be the most unreliable 4x4, at 78%.
I suspect the lack of 'cruisers is due to them being exported.
Is the number of exported vehicles available anywhere?
It is interesting that the Land Cruiser, which is meant to be the sturdiest 4x4, at 56% and the Frontera, which is meant to be the most unreliable 4x4, at 78%.
I suspect the lack of 'cruisers is due to them being exported.
Is the number of exported vehicles available anywhere?

Gassing Station | General Gassing | Top of Page | What's New | My Stuff