Rolling Road Graph - give it to me straight....
Discussion
'Lo
Had a rolling road day recently and a good day was had by all. Pretty much all the results posted (bar one or two in my opinion) were on the money, with standard cars producing the same, if not slightly less than OE quoted figures. I understand flywheel BHP figures will only ever really be an estimate, even if it's a very educated one.
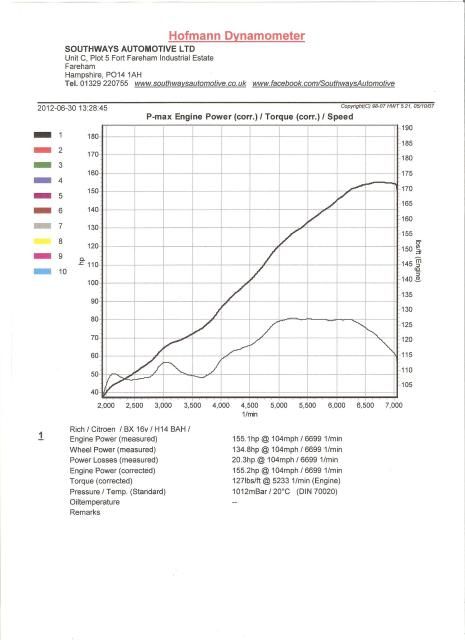
This is a scan of the printout from my own car's run, a 1991 Citroen BX with an n/a non-VVC 1.9 DOHC engine (as found in the Peugeot 405 Mi16) running a Bosch Motronic MP3.1 ECU setup. I'm wondering if there any R/R gurus who might be able to help my decifer some of it and offer their opinions.
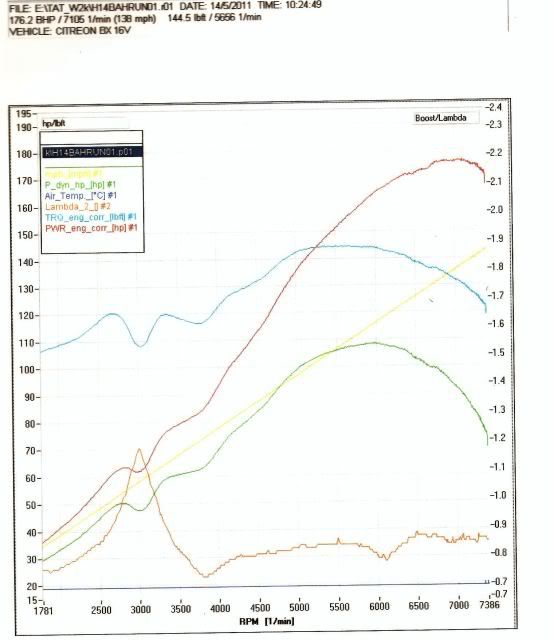
Frt wheel HP: Green
Flywheel HP: Red
Torque (lbft flywheel): Blue
AFM: Orange
Road speed: Yellow
Basically:
1) I'm interested to know what sort of characteristics the graph shows the engine has. Seems a bit odd I know, but I'd be interested to know what good and bad points others who may not be familiar with the engine can spot as my own view is clouded by knowing how the car actually drives! It stinks of fuel around 3000revs for example, but I spotted the obvious reason why. There may be many other subtle clues as to the engine's health hidden in there that I'm missing.
2) My car's original quoted power is 160bhp in the books. Obviously I'm showing 176.2bhp here, yet the engine is not really tuned. It's running a chipped ECU (always questionable of it's worth by most), a cone air filter (physically pulls noticably harder with this on) and the engine was rebuilt by me in 2005 with new rings and big ends, honed bores and a full clean and de-coke. It's always felt like one of the quicker ones I've had (I've owned 4 different cars) but these engines are normally considered difficult to extract power from without waving big bucks around, rather than 20bhp from an air filter. I've always assumed mine was healthy and the other 3 not so.
I've read some cars are over quoted new *coughTVRcough* and some are under quoted for insurance reasons, or to avoid competing with another car of the same model etc. But I can't imagine Citroen doing that with the BX, seeing as they were competing with Renault who were about to launch the 21 Turbo which had 15bhp more with it's turbo engine. PSA made a point of developing this twin cam engine which was apparently better than a turbo charged equivilent, so I can see tham over quoting if anything. However most standard cars I know that have taken to the rollers do seem to make somewhere in the 155-165bhp region.
Could the fact my engine is largely run in (118k miles) with good compression and clean ports (and all the things that came with the rebuild) mean it's potentially more free and loose, yet has decent compression result that it's actually more powerful than a new unit? But then that's assuming a manufacturer doesn't run 100 engines in succession in varying states of wear in the development stages, and then take an average BHP figure across all to print? Surely they'd do something like that?
3) The main thing I've noticed is that the wheel horse power seems very low, around 110bhp at most, and this seems to be a huge loss through the transmission if the flywheel figure is to be correct. I believe it was a self calculating rolling road, where the car was allow to run down afterwards and the rollers take the mechanical drag and covert it into numbers to calculate an estimated flywheel figure. Does this figure look wrong to anyone? The only other car I've had on the rollers (a different set of rollers) was my TVR was made 180bhp at the rear wheels, and 230bhp at the fly (est). So this is saying a FWD BX has more drag through it's cheese gearbox than a TVR running a T5 with a prop shaft, LSD and driveshafts?
Are there outside influences, such as tyre pressure and tred, gearbox/drivetrain condition etc that have enough of an impact to affect these figures.
I'm sure someone will be along to ask "what does it matter?" or something along the lines, but to anyone who's got some knowledge and is listing towards the helpful side of the shore, what do you think? Please don't be afraid to be upfront, I'm not too fussed what anyone thinks of my actual car!
Cheers
Had a rolling road day recently and a good day was had by all. Pretty much all the results posted (bar one or two in my opinion) were on the money, with standard cars producing the same, if not slightly less than OE quoted figures. I understand flywheel BHP figures will only ever really be an estimate, even if it's a very educated one.
This is a scan of the printout from my own car's run, a 1991 Citroen BX with an n/a non-VVC 1.9 DOHC engine (as found in the Peugeot 405 Mi16) running a Bosch Motronic MP3.1 ECU setup. I'm wondering if there any R/R gurus who might be able to help my decifer some of it and offer their opinions.

Frt wheel HP: Green
Flywheel HP: Red
Torque (lbft flywheel): Blue
AFM: Orange
Road speed: Yellow
Basically:
1) I'm interested to know what sort of characteristics the graph shows the engine has. Seems a bit odd I know, but I'd be interested to know what good and bad points others who may not be familiar with the engine can spot as my own view is clouded by knowing how the car actually drives! It stinks of fuel around 3000revs for example, but I spotted the obvious reason why. There may be many other subtle clues as to the engine's health hidden in there that I'm missing.
2) My car's original quoted power is 160bhp in the books. Obviously I'm showing 176.2bhp here, yet the engine is not really tuned. It's running a chipped ECU (always questionable of it's worth by most), a cone air filter (physically pulls noticably harder with this on) and the engine was rebuilt by me in 2005 with new rings and big ends, honed bores and a full clean and de-coke. It's always felt like one of the quicker ones I've had (I've owned 4 different cars) but these engines are normally considered difficult to extract power from without waving big bucks around, rather than 20bhp from an air filter. I've always assumed mine was healthy and the other 3 not so.
I've read some cars are over quoted new *coughTVRcough* and some are under quoted for insurance reasons, or to avoid competing with another car of the same model etc. But I can't imagine Citroen doing that with the BX, seeing as they were competing with Renault who were about to launch the 21 Turbo which had 15bhp more with it's turbo engine. PSA made a point of developing this twin cam engine which was apparently better than a turbo charged equivilent, so I can see tham over quoting if anything. However most standard cars I know that have taken to the rollers do seem to make somewhere in the 155-165bhp region.
Could the fact my engine is largely run in (118k miles) with good compression and clean ports (and all the things that came with the rebuild) mean it's potentially more free and loose, yet has decent compression result that it's actually more powerful than a new unit? But then that's assuming a manufacturer doesn't run 100 engines in succession in varying states of wear in the development stages, and then take an average BHP figure across all to print? Surely they'd do something like that?
3) The main thing I've noticed is that the wheel horse power seems very low, around 110bhp at most, and this seems to be a huge loss through the transmission if the flywheel figure is to be correct. I believe it was a self calculating rolling road, where the car was allow to run down afterwards and the rollers take the mechanical drag and covert it into numbers to calculate an estimated flywheel figure. Does this figure look wrong to anyone? The only other car I've had on the rollers (a different set of rollers) was my TVR was made 180bhp at the rear wheels, and 230bhp at the fly (est). So this is saying a FWD BX has more drag through it's cheese gearbox than a TVR running a T5 with a prop shaft, LSD and driveshafts?
Are there outside influences, such as tyre pressure and tred, gearbox/drivetrain condition etc that have enough of an impact to affect these figures.
I'm sure someone will be along to ask "what does it matter?" or something along the lines, but to anyone who's got some knowledge and is listing towards the helpful side of the shore, what do you think? Please don't be afraid to be upfront, I'm not too fussed what anyone thinks of my actual car!
Cheers
assuming it is not a rolling road "artifact" the first thing i'd be worried about is the massive lean excursion at 3000rpm! a recipe for detonation at that rpm.........
"coastdowns" or worse still "loss estimates" are notoriously unreliable on rolling roads, so the only figure you can probably believe (plus or minus about 5%) is the wheel power figure.
Generally, due to the high valve area, this engine is a decent performer even without extreme cams or varriable timing.
Ah, now that's exactly the sort of thing I was after! At 3000rpm, I thought it suddenly got very rich. At that point, the power tails off too, before climbing back up, so I had assumed that it was because it had got too rich? It definately stinks when you're following it!
But if I've read that wrong and it's in fact leaning out, this is something I really need to sort out. I wasn't running 99RON that day, probably a 2 week old mix of super and normal unleaded. The engine was originally intended to run with 4 star only, perhaps this is why?
But if I've read that wrong and it's in fact leaning out, this is something I really need to sort out. I wasn't running 99RON that day, probably a 2 week old mix of super and normal unleaded. The engine was originally intended to run with 4 star only, perhaps this is why?
In some sort of order.
1) No you didn't get more than stock power with a rebuild and honed liners. No stock rebuilt engine is going to achieve more than a factory fresh and carefully run-in one, especially with only half the bits renewed.
2) The torque is always the most indicative measure of any engine. You can't possibly have 145 ft lbs when stock is 133 without serious tuning mods. Scale the power back down pro rata and you get 176 x 133/145 = 161 which is exactly what it should be.
3) The rollers are clearly nowhere near accurate, including the wheel figures, so I suggest you just ignore it all.
4) The modified chip is also clearly doing more harm than good. Full power A/F should be between 12.6 and 13.0:1 so dividing by 14.7 about 0.86 to 0.88 lambda. Yours is dangerously weak low down and very rich above that especially at 3800 and 6000. It's only about right above 6500.
I suggest you put it all back to standard, which will probably save a lot of fuel and avoid the risk of blowing it up from det.
Cheers for the thoughts. I may well pop the standard chip back in it. I hadn't realised what effect this map has been having and am probably lucky that it hasn't melted something yet.
Any ideas as to why the rollers were consistant for all the other cars, yet mine was out? I don't fully understand how the rollers calculate the figures but wonder if there is something my car does that the others don't which could have thrown my reading out so much.
Using that figure, 161bhp is a figure I'd be happy with, if I knew it was accurate. And as I've already been told, the only figures that really count are times!
If I'm reading that correctly, you achieve peak power at the front wheels at about 6000RPM, yet peak power from the calculated plot is 7000RPM.
Also at 7000RPM you appear to be losing around 90bhp between measured and calculated values. At 7386 RPM the loss increases to 100bhp. Did the rolling road operator have his foot on the brakes whilst performing the coast down by any chance?
Also at 7000RPM you appear to be losing around 90bhp between measured and calculated values. At 7386 RPM the loss increases to 100bhp. Did the rolling road operator have his foot on the brakes whilst performing the coast down by any chance?
Funny you mention that....I did notice him dabbing the brakes when the wheels had slowed down to around 30mph or less (est). I thought it was odd to use the brakes, but assumed at that low speed perhaps the computer wouldn't still be calibrating, or something along those lines!
Sounds like it's not accurate then, especially given the differences between fly and wheels!
Sounds like it's not accurate then, especially given the differences between fly and wheels!
Kitchski said:
Funny you mention that....I did notice him dabbing the brakes when the wheels had slowed down to around 30mph or less (est). I thought it was odd to use the brakes, but assumed at that low speed perhaps the computer wouldn't still be calibrating, or something along those lines!
Oh dear, and you were doing so well up to this. Mike was clearly joking and of course the run was over by 30 mph. You can see so on the printout. The operator was just bringing the rollers to a halt.Mr2Mike said:
If I'm reading that correctly, you achieve peak power at the front wheels at about 6000RPM, yet peak power from the calculated plot is 7000RPM.
Peak power at the wheels will always be at a slightly lower rpm than at the flywheel because transmission losses rise exponentially with speed. When the actual wheel bhp is just starting to dip the trans losses are still rising at a higher rate so the combined total (flywheel bhp) carries on rising briefly.However when you get a set of rollers so miscalibrated that the wheel bhp is far too low and the transmission losses are wildly higher than the guidelines given on my website then this effect becomes very exaggerated and instead of the normal few hundred rpm difference we see this ridiculous 1000 plus rpm difference which is clearly nonsense.
It's very simple. Rollers like this will never be and can never be either accurate or consistent and there is no point analysing it any further. It won't even just be a constant X% error one way or the other. It'll be all over't shop at random for every run.
Just go somewhere else like to a decent Dastek setup.
Pumaracing said:
Oh dear, and you were doing so well up to this. Mike was clearly joking and of course the run was over by 30 mph. You can see so on the printout. The operator was just bringing the rollers to a halt.
Sorry to disappoint! I already knew all these facts, I just came on here and created this thread because I wanted to hear everybody else say the same thing and further boost my ego.
davepoth said:
That lambda does look a bit scary. I think you want to get that sorted out before you do any further dyno pulls.
Still looking for the original chip! It's one of those things you keep finding when looking for other things and then when you actually want it you can't find it! But once it's found it's going back in. Easy enough to change.Bit scary, this one's been in there since Jan 2006!
Just to finish off this thread as it never was originally....
I've since educated myself considerably in the world of rolling road dynometers. We've installed one at work and I've learned a great deal experimenting on my own cars and reading various articles. I'm not expert, but I'm up to speed on DIN70020 and SAE1349 and understand the machine in enough detail to be able to operate a set of rollers in a professional capacity, rather than just know a bit more than most. What a difference a year or two makes!
And to conclude the thread - the results I had received were (as others had pointed out) complete b ks. Horses
 t of the highest order! The number of inaccuracies on the graph is laughable. the view echoed by most in this thread are completely accurate.
So, tread carefully before splashing the cash is my advice to you all!
I've since educated myself considerably in the world of rolling road dynometers. We've installed one at work and I've learned a great deal experimenting on my own cars and reading various articles. I'm not expert, but I'm up to speed on DIN70020 and SAE1349 and understand the machine in enough detail to be able to operate a set of rollers in a professional capacity, rather than just know a bit more than most. What a difference a year or two makes!
And to conclude the thread - the results I had received were (as others had pointed out) complete b
 ks. Horses
 t of the highest order! The number of inaccuracies on the graph is laughable. the view echoed by most in this thread are completely accurate.
So, tread carefully before splashing the cash is my advice to you all!
Kitchski said:
Just to finish off this thread as it never was originally....
I've since educated myself considerably in the world of rolling road dynometers. We've installed one at work and I've learned a great deal experimenting on my own cars and reading various articles. I'm not expert, but I'm up to speed on DIN70020 and SAE1349 and understand the machine in enough detail to be able to operate a set of rollers in a professional capacity, rather than just know a bit more than most. What a difference a year or two makes!
And to conclude the thread - the results I had received were (as others had pointed out) complete b ks. Horses
 t of the highest order! The number of inaccuracies on the graph is laughable. the view echoed by most in this thread are completely accurate.
So, tread carefully before splashing the cash is my advice to you all!
Have you got a sheet for the car so we can laugh at how bad the one at the top is?I've since educated myself considerably in the world of rolling road dynometers. We've installed one at work and I've learned a great deal experimenting on my own cars and reading various articles. I'm not expert, but I'm up to speed on DIN70020 and SAE1349 and understand the machine in enough detail to be able to operate a set of rollers in a professional capacity, rather than just know a bit more than most. What a difference a year or two makes!
And to conclude the thread - the results I had received were (as others had pointed out) complete b
 ks. Horses
 t of the highest order! The number of inaccuracies on the graph is laughable. the view echoed by most in this thread are completely accurate.
So, tread carefully before splashing the cash is my advice to you all!
davepoth said:
Have you got a sheet for the car so we can laugh at how bad the one at the top is?
What a more realistic one for comparison perhaps?Well, some time ago I ran this when the chip was still fitted:
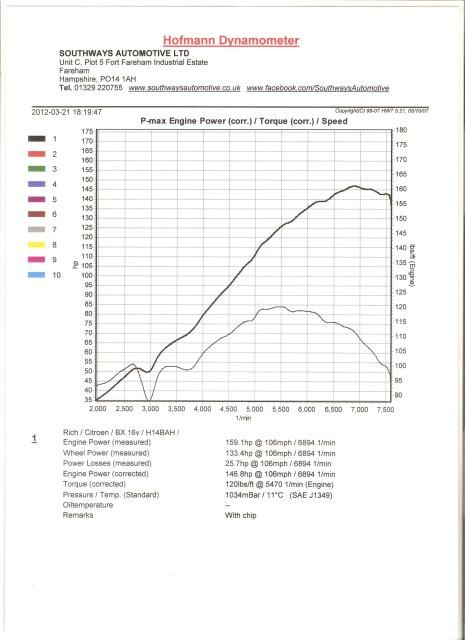
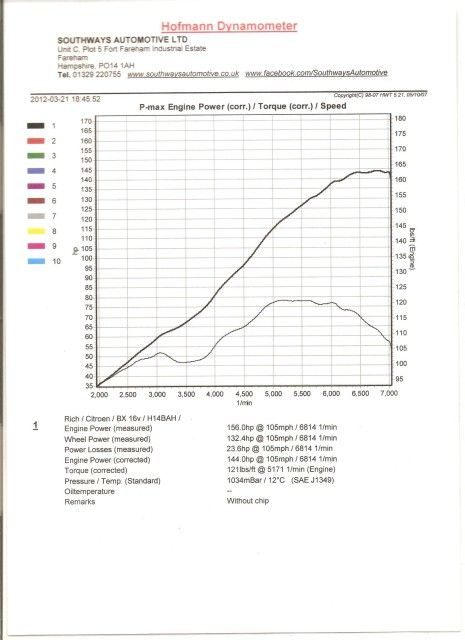
On the advice I'd received from this thread I removed it and did another run:
Today, I did another run purely in the interests of seeing how the computer calculates the temperature and atmospheric pressure readouts. I've also been running the car purely on 98/99RON fuel as opposed to regular unleaded in my first two tests:
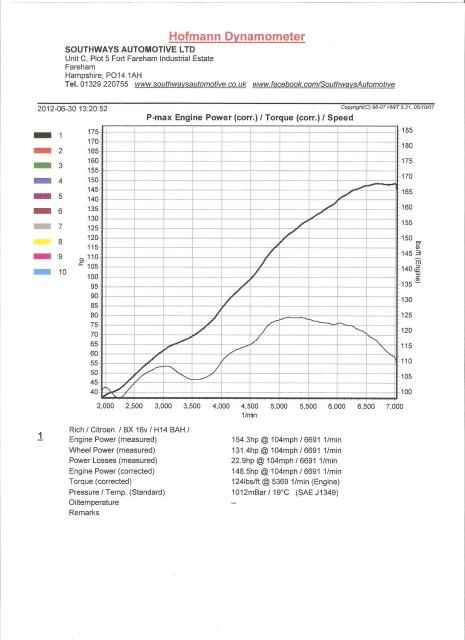
Then I did a forth run using the DIN correction factors, because originally, the car was quoted in DIN (at the time it was the recognised standard - DIN is effectively metric, SAE effectively imperial. Nowadays SAE is generally the recognised forumla.)
None of them mean all that much - WHP is really the only thing that can truly be used as a guide here, but it was interesting playing around with the settings in a controlled environment. But I guess at the end of the day, a stopwatch tells more than a rolling-road.
The only downside to these readings are that our AFR probe doesn't currently interface with the dyno-software, meaning it can't plot the AFR graph. We're using a separate AFR monitor until we get it licked with the software - with the chip on it was leaning out to 17.6 AFR at around 3000rpm. How I haven't dropped a valve in all these years I'll never know. With the mickey-mouse chip removed, we were back on track at around 12.3-12.6 all the way through the WOT rev range.
Edited by Kitchski on Saturday 30th June 22:16
I don't have any images of the graphs yet, but a mate of mine is becomming very clever with Motronic ECUs and between himself and a chap he's getting pally with in Oz, they downloaded the data from the Powerchip that was fitted at the beginning of this thread.
The guy who developed the software was called Josh, and these were his comments:
The guy who developed the software was called Josh, and these were his comments:
cleverchapinOZ said:
Thanks, that showed me where the missing byte was straight away.
I've heard some not-so-good reports about powerchips, and now I know why.
Here's the WOT target lambda table, black is powerchips and green is stock...
Not sure I'd be comfortable with a 19:1 AFR on WOT
And it doesn't look like a lot of thought was put into the part-throttle map either:
There's a few changes to the CTS bias tables, my first guess is that they're doing the "fiddle with the coolant sensor to overfuel" trick, but in software rather than a resistor on the sensor....
There's also a few tables that are trashed/scrambled in the powerchips bin.
I'll post a very crude xdf soon...
Pretty worrying stuff!I've heard some not-so-good reports about powerchips, and now I know why.
Here's the WOT target lambda table, black is powerchips and green is stock...
Not sure I'd be comfortable with a 19:1 AFR on WOT
And it doesn't look like a lot of thought was put into the part-throttle map either:
There's a few changes to the CTS bias tables, my first guess is that they're doing the "fiddle with the coolant sensor to overfuel" trick, but in software rather than a resistor on the sensor....
There's also a few tables that are trashed/scrambled in the powerchips bin.
I'll post a very crude xdf soon...
Gassing Station | Engines & Drivetrain | Top of Page | What's New | My Stuff


