Dodge Viper GTS on the rollers
Discussion


Stan Weiss said:
Stevie,
Thank you for that very valuable information.
Would you or Carl have an data logging from your runs?
Here is a revised run where maximum acceleration is never greater than .545 G's
60 Foot ET = 2.3020
330 Foot ET = 5.8242
1/8 Mile ET = 8.3982
1/8 Mile MPH = 99.5908
1000 Foot ET = 10.4558
1/4 Mile ET = 12.1548
1/4 Mile MPH = 134.4697
Try Using Rear Gear Ratio = 4.794
1/2 Mile ET = 18.049
1/2 Mile MPH = 166.67
KiloMeter ET = 20.594
KiloMeter MPH = 176.44
Mile ET = 27.864
Mile MPH = 196.65
Stan
I'm going to guess the above is a pretty good assessment of the Viper runs though. I think Puma's is still a little optimistic from a traction point of view but would depend what tyres Carl used. A really good run could well see that, getting the power down is hard thoughThank you for that very valuable information.
Would you or Carl have an data logging from your runs?
Here is a revised run where maximum acceleration is never greater than .545 G's
60 Foot ET = 2.3020
330 Foot ET = 5.8242
1/8 Mile ET = 8.3982
1/8 Mile MPH = 99.5908
1000 Foot ET = 10.4558
1/4 Mile ET = 12.1548
1/4 Mile MPH = 134.4697
Try Using Rear Gear Ratio = 4.794
1/2 Mile ET = 18.049
1/2 Mile MPH = 166.67
KiloMeter ET = 20.594
KiloMeter MPH = 176.44
Mile ET = 27.864
Mile MPH = 196.65
Stan
I've a GPS/Accel log of my car as well as ecu logs....
On mine ( 1980 UK Ford Granada ) I see brief moment above 0.5g thru gears 1-3, max a small spike to 0.59g in 2nd. But most it is around 0.5, 3-4 mid 0.4 dropping to the 0.2 range at top of 4th.
Mine would be similar weight to Carls at circa 1680kgs race weight at that time, Aero a mile off anything like as good as a Viper. Google Cd suggests 0.44-0.46 range for me, and my those runs only 255/40x17 tyres, 3.27 rear and using the T56 0.74 5th this was back in October 2010.
If I take the Race technology AX-22 GPS logs from my best run and I'm rounding a fraction as logging software only allows metric units for distance but it's negligible difference.
I'll break it down here.
60ft............2.82 at 32.36mph
330ft...........6.36 at 71.63mph
660ft...........8.97 at 103.4mph
1000ft..........11.04 at 123.4mph
1320ft..........12.65 at 141.2mph
1/2mile.........18.4 at 173.4mph
1km.............20.82 at 184.2mph
1Mile...........27.81 at 202.2mmph
Timing gear on the day listed 201.96mph as 1 mile trap, havent a clue if it gave an ET for it or not but the above seems accurate.
Stevie,
This is what I got. My simulation does not include any increase in down force with speed increase.
60 Foot ET = 2.7017
330 Foot ET = 6.3615
1/8 Mile ET = 9.0023
1/8 Mile MPH = 97.8328
1000 Foot ET = 11.0875
1/4 Mile ET = 12.7476
1/4 Mile MPH = 138.3870
Try Using Rear Gear Ratio = 4.903
1/2 Mile ET = 18.347
1/2 Mile MPH = 177.95
KiloMeter ET = 20.742
KiloMeter MPH = 186.28
Mile ET = 27.740
Mile MPH = 202.23
Below is what my simulation saw for G forces and also what I used for HP / Torque (Note these values would be as measured at the wheel).
Stan
Stevie,
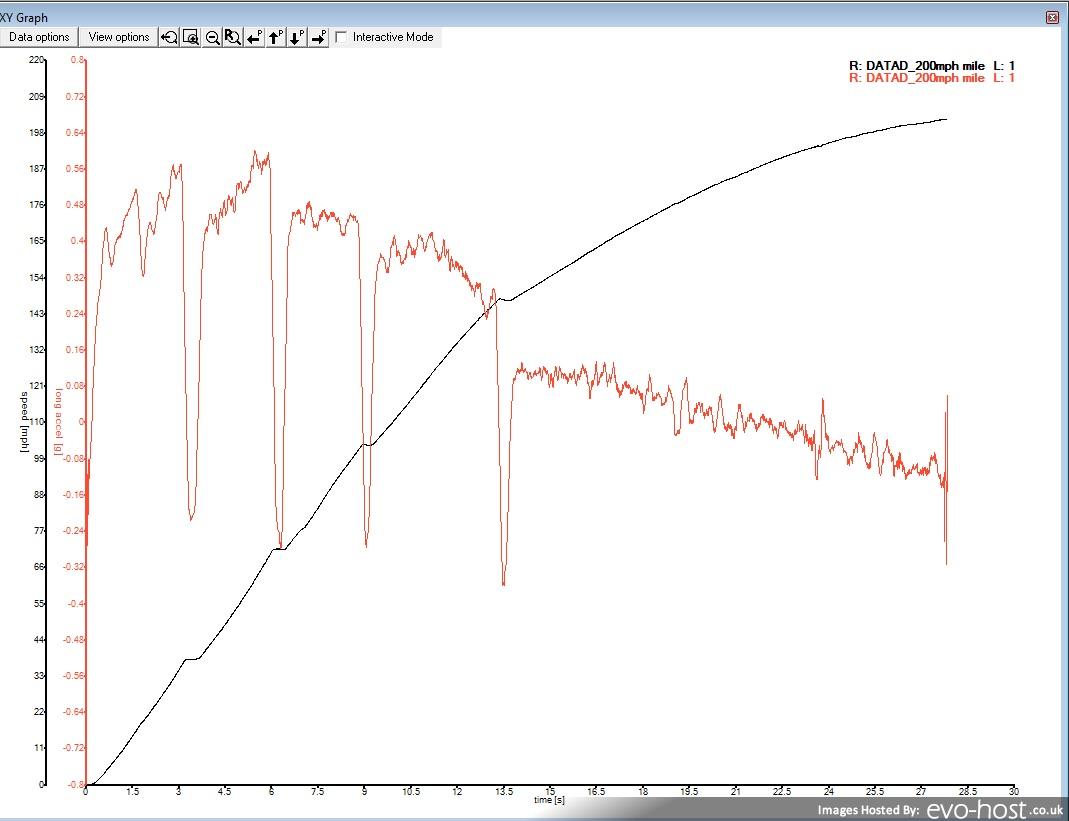
When I add some lines to your data log printout the G's in part of 5th gear look a little strange (Negative)
New HP and Torque curve. With this one I have the 202.35 @ 6590 RPM in 5th fear.
60 Foot ET = 2.4256
330 Foot ET = 6.1368
1/8 Mile ET = 8.8476
1/8 Mile MPH = 94.6708
1000 Foot ET = 10.9870
1/4 Mile ET = 12.6904
1/4 Mile MPH = 136.1634
Try Using Rear Gear Ratio = 4.951
1/2 Mile ET = 18.416
1/2 Mile MPH = 174.08
KiloMeter ET = 20.846
KiloMeter MPH = 185.06
Mile ET = 27.831
Mile MPH = 202.35
Stan
im guessing the g meter was not zeroed stan , so reading a minus at rest .? orr , thinking about it , maybe the attitude of the car was changing due to aero forces and this changed the angle of the datalogger .
obviously if its a gps logger none of this would be pertinent.
robert.
obviously if its a gps logger none of this would be pertinent.
robert.
Edited by ivanhoew on Friday 5th June 13:52
I try to keep the unit as level as possible, but could not guarantee this as there isnt actually a spirit level on it. But it does require a moment from hitting start before you're ready to race, so I assume it does calibrate during this
But obviously during a gearchange, slow ones at that, my car has the aerodynamics of a brick so there is little doubt that from wind resistance alone it would possible decelerate slightly. How much I couldnt quantify.
AX22 is a GPS logger, but there is also an inbuilt accelerometer.
Given 5th does seem to be below the zero line, the unit must not have been zero'd correctly.
stevieturbo said:
I try to keep the unit as level as possible, but could not guarantee this as there isnt actually a spirit level on it. But it does require a moment from hitting start before you're ready to race, so I assume it does calibrate during this
But obviously during a gearchange, slow ones at that, my car has the aerodynamics of a brick so there is little doubt that from wind resistance alone it would possible decelerate slightly. How much I couldnt quantify.
AX22 is a GPS logger, but there is also an inbuilt accelerometer.
Given 5th does seem to be below the zero line, the unit must not have been zero'd correctly.
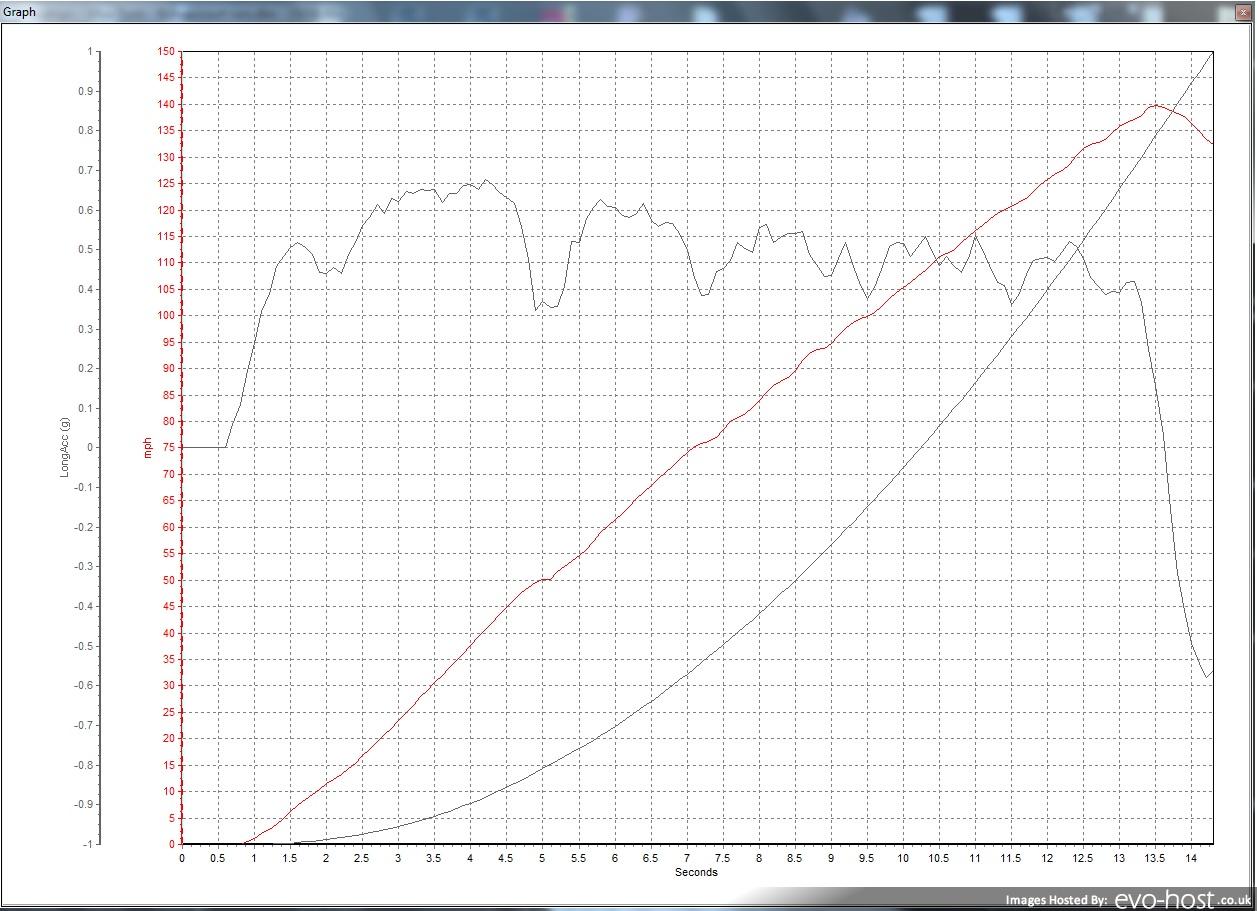
A quick eyeball of the graph gives zero accel at about -0.28, as that is the reading at the start of graph.But obviously during a gearchange, slow ones at that, my car has the aerodynamics of a brick so there is little doubt that from wind resistance alone it would possible decelerate slightly. How much I couldnt quantify.
AX22 is a GPS logger, but there is also an inbuilt accelerometer.
Given 5th does seem to be below the zero line, the unit must not have been zero'd correctly.
It would be easy to cross-check the accelerometer with the derivative of the speed.
The speed curve vs time is correct. The acceleration curve is displaced downwards by about 0.2g or even a bit more. To hit 32 mph at 60 ft and 103 mph at 660 ft the car is actually accelerating at an average of 0.58g including lost time during gear changes. That's the average! The grip is actually varying between about 0.5g and 0.75g as Stevie tries to put the power down.
I can simulate this correctly because my program takes into account all these variables including gear change time which is at least 0.4 seconds. I could tell you the real flywheel and wheel bhp but then I'd have to kill you all.
I can simulate this correctly because my program takes into account all these variables including gear change time which is at least 0.4 seconds. I could tell you the real flywheel and wheel bhp but then I'd have to kill you all.
In the real world, as I understand it from Carl and reading what Steve says (he mentions wheel spin at 190mph in certain conditions), the problem is having more power than the tyres can handle, so it is a balancing act of getting as much power down to the wheels without wheels spinning. This would mean than Stan and Dave's maths is working out, more or less, what power is being delivered to the ground in terms of the speeds and accelerations achieved, it cannot work out what the flywheel horsepower is if full throttle cannot be/isn't used. It can only work out what power at the wheel would be required to accelerate the cars in the stated times within certain guesstimated parameters. Carl said the Viper was bloody fast in stage 1 guise and in stage 2 just spun the tyres with any real throttle applied!
Peter
Peter
That's essentially correct Peter. In the first 3 gears Stevie's car is totally grip limited so the real engine power is irrelevant. It is simply above a certain amount. From 4th through 5th we get a proper bhp limited acceleration curve but it's very aero drag dependent. I can get similar curves above 110 mph with low drag / low bhp and higher drag higher bhp. My best match comes at a Cd of 0.50 and 950 bhp flywheel bhp, 826 wheel bhp.
60ft............2.84 at 32.3mph
330ft...........6.39 at 73.1mph
660ft...........8.99 at 102.9mph
1000ft..........11.06 at 122.7mph
1320ft..........12.72 at 139.4mph
1/2mile.........18.41 at 172.7mph
1km.............20.86 at 182.9mph
1Mile...........27.9 at 202.4mph
Stevie's computer:
60ft............2.82 at 32.36mph
330ft...........6.36 at 71.63mph
660ft...........8.97 at 103.4mph
1000ft..........11.04 at 123.4mph
1320ft..........12.65 at 141.2mph
1/2mile.........18.4 at 173.4mph
1km.............20.82 at 184.2mph
1Mile...........27.81 at 202.2mph
Within hundredths of a second and the odd mph through the whole curve.
Stan, I've told you what the correct algorithm is for tyre rolling radius. 0.97 times the simple calculation. That's why you get 6600 rpm @ 202 mph when it's actually 6800 rpm because you haven't adjusted this. Also your mph increments are far too low at the start because you have the wrong g force grip figure in the simulation.
Pumaracing said:
The speed curve vs time is correct. The acceleration curve is displaced downwards by about 0.2g or even a bit more. To hit 32 mph at 60 ft and 103 mph at 660 ft the car is actually accelerating at an average of 0.58g including lost time during gear changes. That's the average! The grip is actually varying between about 0.5g and 0.75g as Stevie tries to put the power down.
I can simulate this correctly because my program takes into account all these variables including gear change time which is at least 0.4 seconds. I could tell you the real flywheel and wheel bhp but then I'd have to kill you all.
Comparing to recent VBox runs, albeit a different airfield but similar 1/4 and 60ft times.I can simulate this correctly because my program takes into account all these variables including gear change time which is at least 0.4 seconds. I could tell you the real flywheel and wheel bhp but then I'd have to kill you all.
Vbox runs would suggest spells into the 0.6g range
Traction terrible here throughout entire run, but as ET and traps are similar g forces should also be similar to the other runs posted. Vbox is level at start as is clear on graph
Car is a very different engine setup with this run, dog box so shifts less distinct but ultimately lack of traction kills me every time so overall stats are similar
Stan Weiss said:
Stevie,
On this data log printout the scale is much larger and it is easier to see. There is about a .3 second gap after the start of the G's and before the MPH / timer starts. Is this what I call your roll out time?
Stan
No, that's just where I cropped the graph, I left stationary time to show the g sensor at rest.On this data log printout the scale is much larger and it is easier to see. There is about a .3 second gap after the start of the G's and before the MPH / timer starts. Is this what I call your roll out time?
Stan
Time along the bottom is always counting regardless of motion.
Although maybe time for a different thread, as this one has deviated slightly from the main topic lol
stevieturbo said:
No, that's just where I cropped the graph, I left stationary time to show the g sensor at rest.
Time along the bottom is always counting regardless of motion.
Although maybe time for a different thread, as this one has deviated slightly from the main topic lol
Stevie,Time along the bottom is always counting regardless of motion.
Although maybe time for a different thread, as this one has deviated slightly from the main topic lol
Now that I have drawn some lines it look more like .2 second.
Here is may lasts simulation
=============
___________Acceleration_and_Top_Speed_Prediction_Chart.
_________________________________Force____Aero_____Rolling__Elapsed_________Accele
RPM______MPH___Velocity__Motor_____@_____dynamic___Resist.___Time______Totalration
________________ft/sec__Torque___Wheel__Drag_-_HP____HP______(ET)__Distance_in_G's
_2174.4__0.00_____.000___151.1_____0.0______.000_____.000____.0000_____-.979__.000
_2174.4__3.14____4.606___151.1__1301.8______.002_____.465____.4255______.001__.336
>>>>---_RollOut_Ends_<->_1/4_Mile_Distance_and_ET_Starts_Now_--_0.42550
_2174.4__5.00____7.336___151.1__1301.8______.009_____.741____.2523_____1.507__.336
_
_6750.0201.47__295.486___551.9__1320.7___564.400___29.849__27.0795__5162.945__.058
_6765.9201.94__296.180___544.3__1302.5___568.391___29.920__27.4749__5279.937__.052
_6765.9201.94__296.186___544.3__1302.4___568.423___29.920__27.4782__5280.915__.052
_6800.0202.96__297.674___527.9__1263.3___577.035___30.071__28.5188__5589.940__.038
60 Foot ET = 2.8767
330 Foot ET = 6.4606
1/8 Mile ET = 8.9682
1/8 Mile MPH = 103.2630
1000 Foot ET = 10.9460
1/4 Mile ET = 12.5464
1/4 Mile MPH = 142.9461
Try Using Rear Gear Ratio = 4.624
1/2 Mile ET = 18.122
1/2 Mile MPH = 177.40
KiloMeter ET = 20.515
KiloMeter MPH = 187.21
Mile ET = 27.475
Mile MPH = 201.94
=====
I use a roll out distance of 11.75" which causes the 0.42550 second time to apss before the actual run timer starts.
Stan
Stan Weiss said:
Stevie,
Now that I have drawn some lines it look more like .2 second.
Here is may lasts simulation
___________Acceleration_and_Top_Speed_Prediction_Chart.
_________________________________Force____Aero_____Rolling__Elapsed_________Accele
RPM______MPH___Velocity__Motor_____@_____dynamic___Resist.___Time______Totalration
________________ft/sec__Torque___Wheel__Drag_-_HP____HP______(ET)__Distance_in_G's
_2174.4__0.00_____.000___151.1_____0.0______.000_____.000____.0000_____-.979__.000
_2174.4__3.14____4.606___151.1__1301.8______.002_____.465____.4255______.001__.336
>>>>---_RollOut_Ends_<->_1/4_Mile_Distance_and_ET_Starts_Now_--_0.42550
_2174.4__5.00____7.336___151.1__1301.8______.009_____.741____.2523_____1.507__.336
_
_6750.0201.47__295.486___551.9__1320.7___564.400___29.849__27.0795__5162.945__.058
_6765.9201.94__296.180___544.3__1302.5___568.391___29.920__27.4749__5279.937__.052
_6765.9201.94__296.186___544.3__1302.4___568.423___29.920__27.4782__5280.915__.052
_6800.0202.96__297.674___527.9__1263.3___577.035___30.071__28.5188__5589.940__.038
60 Foot ET = 2.8767
330 Foot ET = 6.4606
1/8 Mile ET = 8.9682
1/8 Mile MPH = 103.2630
1000 Foot ET = 10.9460
1/4 Mile ET = 12.5464
1/4 Mile MPH = 142.9461
Try Using Rear Gear Ratio = 4.624
1/2 Mile ET = 18.122
1/2 Mile MPH = 177.40
KiloMeter ET = 20.515
KiloMeter MPH = 187.21
Mile ET = 27.475
Mile MPH = 201.94
I use a roll out distance of 11.75" which causes the 0.42550 second time to apss before the actual run timer starts.
Stan
Just to further confuse...Now that I have drawn some lines it look more like .2 second.
Here is may lasts simulation
=============
___________Acceleration_and_Top_Speed_Prediction_Chart.
_________________________________Force____Aero_____Rolling__Elapsed_________Accele
RPM______MPH___Velocity__Motor_____@_____dynamic___Resist.___Time______Totalration
________________ft/sec__Torque___Wheel__Drag_-_HP____HP______(ET)__Distance_in_G's
_2174.4__0.00_____.000___151.1_____0.0______.000_____.000____.0000_____-.979__.000
_2174.4__3.14____4.606___151.1__1301.8______.002_____.465____.4255______.001__.336
>>>>---_RollOut_Ends_<->_1/4_Mile_Distance_and_ET_Starts_Now_--_0.42550
_2174.4__5.00____7.336___151.1__1301.8______.009_____.741____.2523_____1.507__.336
_
_6750.0201.47__295.486___551.9__1320.7___564.400___29.849__27.0795__5162.945__.058
_6765.9201.94__296.180___544.3__1302.5___568.391___29.920__27.4749__5279.937__.052
_6765.9201.94__296.186___544.3__1302.4___568.423___29.920__27.4782__5280.915__.052
_6800.0202.96__297.674___527.9__1263.3___577.035___30.071__28.5188__5589.940__.038
60 Foot ET = 2.8767
330 Foot ET = 6.4606
1/8 Mile ET = 8.9682
1/8 Mile MPH = 103.2630
1000 Foot ET = 10.9460
1/4 Mile ET = 12.5464
1/4 Mile MPH = 142.9461
Try Using Rear Gear Ratio = 4.624
1/2 Mile ET = 18.122
1/2 Mile MPH = 177.40
KiloMeter ET = 20.515
KiloMeter MPH = 187.21
Mile ET = 27.475
Mile MPH = 201.94
=====
I use a roll out distance of 11.75" which causes the 0.42550 second time to apss before the actual run timer starts.
Stan
The VBox run posted in the graph above as timed at strip and via VBox with 1ft rollout active ( results are close enough to say they are the same, and apparently the strip times would not activate for 1 feet hence they use that ) was as follows. I'll use VBox results mainly because strip only gave 60ft and ET/speed
60ft.......2.31 at 33.26
330ft......5.65 at 75.83mph
660ft......8.16 at 102.81mph
1000ft.....10.21 at 123.34mph
1320ft.....11.87 at 139.74mph
Not enablng that 1 foot rollout sees times increase by about 0.35s on that run, speeds vary less.
At a proper strip with decent tyres, results would be substantially different, circa 1.5s 60ft and run prob 2s or so quicker
stevieturbo said:
At a proper strip with decent tyres, results would be substantially different, circa 1.5s 60ft and run prob 2s or so quicker.
I ran a simulation with unlimited grip and your times would drop to 9.5s @ 149.7 mph.If you could slim the car down to 3000 lbs inc driver that would be 8.9s @ 155.7 mph.
Time to lash out on some wrinkle wall slicks.
Pumaracing said:
I ran a simulation with unlimited grip and your times would drop to 9.5s @ 149.7 mph.
If you could slim the car down to 3000 lbs inc driver that would be 8.9s @ 155.7 mph.
Time to lash out on some wrinkle wall slicks.
In 2008 I ran 9.85 at 145mph on ET Streets which are wrinkle walls, that was a 1.55s 60ft at Santa Pod. If you could slim the car down to 3000 lbs inc driver that would be 8.9s @ 155.7 mph.
Time to lash out on some wrinkle wall slicks.
I had trapped 149mph 2 years previous, again engine slightly different spec, although that was 10.22 run with 1.8s 60ft ( drag radials )
That run would seem to have full traction in 2, 3 and 4. 1st gear does still see some slippage, and obviously still some during launch which would be expected anyway. 1st taking to 61mph.
I thought I had GPS logs of that, but cant find them. I just have a normal ecu datalog
I've no doubt the car could go faster, more so now as it's very different to how it was then, but I've just little interest in risking breaking things to try.
Without spending a fortune or b
 dising the car ( more than it is for the running gear etc ), there's just no way weight could get that low.
Gassing Station | Engines & Drivetrain | Top of Page | What's New | My Stuff