Dodge Viper GTS on the rollers
Discussion


Steve
I have never claimed accuracy, I don't know what that is? I stand by the repeatability of testing NA on our Dynocom so we can see before and after effects and even year on year differences. Turbos are harder as the power varies so much with intake temp. As I keep saying, the rollers are a good tool.
Not sure if the SF901 we have will be accurate? As Stan said the CFs are all different, indeed the SF manual explains why power will vary depending on test mode. Hold power at X rpm will show more than transient testing which loses some to inertia and spinning up the rotating masses.
What one needs is repeatable figures taken in the same way which means chopping from one dyno to another is a waste of time re power figures but good idea if operator isn't able to cope with the car one wants to run!
In the real world it is sorted on the track, but hp isn't all is it? Car prepping, driver skills, financial input, Lady Luck etc etc one can't get rid of all the independent variables to see best power!
I hate to say it, but, if I hadn't dynoed the Viper and posted the figures, this thread may not have happened, no one would be any wiser as to whether Carls 1000 and 1500 hp claims were realistic or bull
As it is, lots of interesting input esp from AW111.
Peter
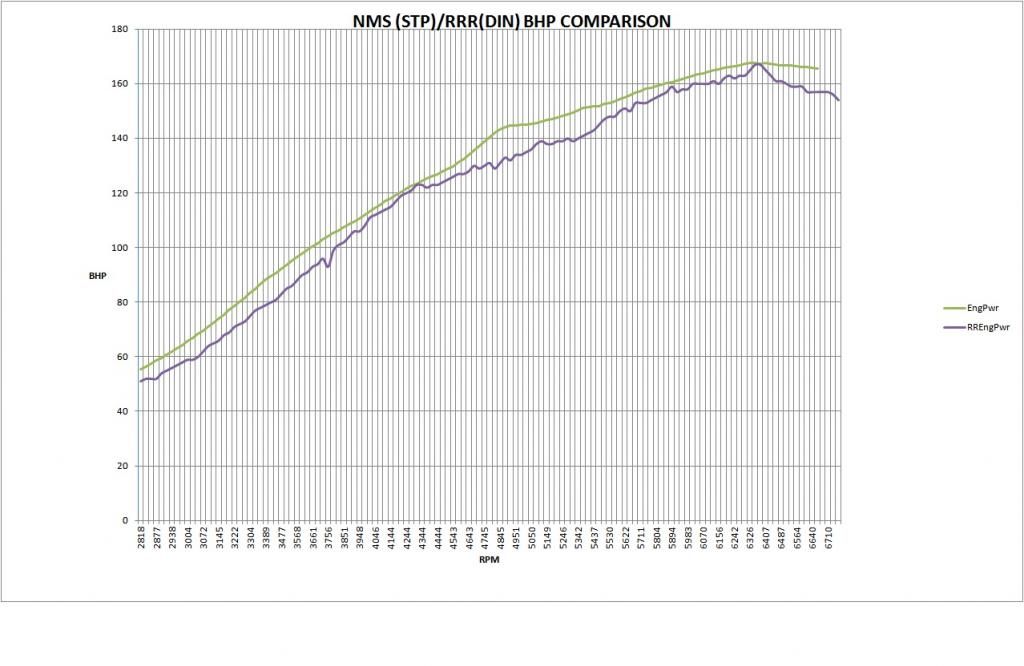
Stevie
Still not same as posting that graph as tested though I am sure if you visited NMS and had a two wheel drive we would try and do a few pulls for you which are nice to have as a record and see power delivery curve.
Peter
Stan
When I get some spare time I'll have a look. It must be in there somewhere as I can display bhp/Torque Vs time. To be honest my main concern is to get as much bhp and torque everywhere so I only tend to look at overlays. You have to remember I use this as a tool to earn a living and would get bogged down if I spent hours and hours going through all the figures for every car.
Peter
Still not same as posting that graph as tested though
I am sure if you visited NMS and had a two wheel drive we would try and do a few pulls for you which are nice to have as a record and see power delivery curve.Peter
Stan
When I get some spare time I'll have a look. It must be in there somewhere as I can display bhp/Torque Vs time. To be honest my main concern is to get as much bhp and torque everywhere so I only tend to look at overlays. You have to remember I use this as a tool to earn a living and would get bogged down if I spent hours and hours going through all the figures for every car.
Peter
Edited by PeterBurgess on Saturday 30th May 06:55
hi chaps,
An experiment i did a while ago with my sun/maha dyno , was to do a run on my 1310cc mini on 12 psi boost , then plot the results on the same graph as a run on the same boost at NMS ,where i used their superflow chassis dyno .
similarities are,
car,
tyres
tyre pressures
engine,
boost level.
time length of power run ,about the same.
... differences are
my dyno does a coast down losses measure for each run , whereas the superflow one does the losses calc for the first run , then applies that to the rest of them .
i have twin rollers , power roller gritted. sf has a single bigger diameter roller.
correction factors , mine is DIN, sf use STP.
cooling fan on ic on my setup , not so much at nms.
no smoothing on my graph .
using shell v power in the nms runs(smoother engine) ,stock 95 octane in my dyno runs .
car 4 years older.
both dyno's measure a form of losses,..so if the losses measurement is at all representative , we should get something near the same for both dyno's....(note: i have the full calibration weights and electronics service,calibration equipment to calibrate my dyno , and its as spot on as i can make it)
here's the graph..
I have tested all sorts of strange stuff , a 1969 cooper f1 car with a alfa 3.1 v8/transaxle , 10bhp losses 250+ bhp power. to a astra with 25 bhp ,and 75 bhp losses ,with a seized brake .
my favourite example of the positive side of a coastdown loss measurement was with my motorbike .500cc turbo honda twin.
it measured 115 bhp at the wheel , and 135bhp at the crank . i thought it was wheelspinning , so sprayed sticky stuff on the tyre ,and had another go .
this time , i had 98 bhp at the wheel ... but at the crank , i still had 135 bhp , since the dyno had measured the losses ,and the increased sticky drag from the rear tyre had been measured and added to create the same total .
i was quite suprised/impressed .this is an old ram 12 dyno , and i like it .
but , as peter says ,repeatability and being able to trust the machine, is what is really important , i just thought this info might be of interest.
regards
robert.
stevesingo said:
Rototest have produced and number of articles on the web site one of which contains the graph below.
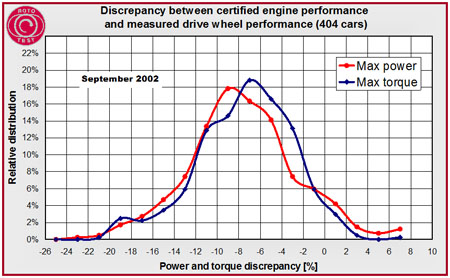
This shows the difference between claimed power and measured power at the hubs for 404 cars.
-9% for power and -8% for torque is the most common.
On the issue of FWHP and RWHP, RWHP is flawed as a means of comparing one car to another, even of the same make and model, but with different modification. There are so many things that effect the wheel/tyre interface that it is almost impossible to get exactly the same conditions. Gear used, tyre type, tyre pressure, toe, camber all effect the result.
Although a coast down loss is not representative of true transmission loss, it does give an indication of comparative losses and in that respect taking some of the above variables in to consideration. Better than a fixed added % IMO.
It mildly amuses me that every dyno operator I have met claims their dyno is accurate. It would be fun to take a car to several operators and get the results and challenge them on the accuracy. Let's see how confident they are in the defence of their dyno then.
Have you posted up the wrong graph? There is no comparison on there, it just shows two curves; one BHP, one torque as per any dyno sheet.This shows the difference between claimed power and measured power at the hubs for 404 cars.
-9% for power and -8% for torque is the most common.
On the issue of FWHP and RWHP, RWHP is flawed as a means of comparing one car to another, even of the same make and model, but with different modification. There are so many things that effect the wheel/tyre interface that it is almost impossible to get exactly the same conditions. Gear used, tyre type, tyre pressure, toe, camber all effect the result.
Although a coast down loss is not representative of true transmission loss, it does give an indication of comparative losses and in that respect taking some of the above variables in to consideration. Better than a fixed added % IMO.
It mildly amuses me that every dyno operator I have met claims their dyno is accurate. It would be fun to take a car to several operators and get the results and challenge them on the accuracy. Let's see how confident they are in the defence of their dyno then.
Where I took my car they said their dyno was correct because they put a stock new car on and it read (more or less) what the manufacturers said it would, surely this is a good comparison and standard to work to these days? Years ago maybe not....
This debate has rumbled on for years and will continue to do so because there are so many variables; weather, tyre pressure, wheel alignment etc and probably 50 more. Most of these can be measured easily enough, but how do you measure how tight a car is fastened down? AFAIK they all use ratchet straps and a more powerful car will need to be very tight so will show more frictional losses than a low powered one. Not to mention one guy might use more force to tighten it down than another....
227bhp said:
stevesingo said:
Rototest have produced and number of articles on the web site one of which contains the graph below.
This shows the difference between claimed power and measured power at the hubs for 404 cars.
-9% for power and -8% for torque is the most common.
On the issue of FWHP and RWHP, RWHP is flawed as a means of comparing one car to another, even of the same make and model, but with different modification. There are so many things that effect the wheel/tyre interface that it is almost impossible to get exactly the same conditions. Gear used, tyre type, tyre pressure, toe, camber all effect the result.
Although a coast down loss is not representative of true transmission loss, it does give an indication of comparative losses and in that respect taking some of the above variables in to consideration. Better than a fixed added % IMO.
It mildly amuses me that every dyno operator I have met claims their dyno is accurate. It would be fun to take a car to several operators and get the results and challenge them on the accuracy. Let's see how confident they are in the defence of their dyno then.
Have you posted up the wrong graph? There is no comparison on there, it just shows two curves; one BHP, one torque as per any dyno sheet.This shows the difference between claimed power and measured power at the hubs for 404 cars.
-9% for power and -8% for torque is the most common.
On the issue of FWHP and RWHP, RWHP is flawed as a means of comparing one car to another, even of the same make and model, but with different modification. There are so many things that effect the wheel/tyre interface that it is almost impossible to get exactly the same conditions. Gear used, tyre type, tyre pressure, toe, camber all effect the result.
Although a coast down loss is not representative of true transmission loss, it does give an indication of comparative losses and in that respect taking some of the above variables in to consideration. Better than a fixed added % IMO.
It mildly amuses me that every dyno operator I have met claims their dyno is accurate. It would be fun to take a car to several operators and get the results and challenge them on the accuracy. Let's see how confident they are in the defence of their dyno then.
Where I took my car they said their dyno was correct because they put a stock new car on and it read (more or less) what the manufacturers said it would, surely this is a good comparison and standard to work to these days? Years ago maybe not....
This debate has rumbled on for years and will continue to do so because there are so many variables; weather, tyre pressure, wheel alignment etc and probably 50 more. Most of these can be measured easily enough, but how do you measure how tight a car is fastened down? AFAIK they all use ratchet straps and a more powerful car will need to be very tight so will show more frictional losses than a low powered one. Not to mention one guy might use more force to tighten it down than another....
ivanhoew said:
227 , i might be wrong, but if you look at the scales of the graph , its showing the commonly found % differences in bhp/trq measurements .
Yeah I can see it now (on a proper mans computer) I was stupidly viewing on my phone. It is quite old too, I wonder if things have improved in the 13yrs since it was done.Hi Stan
Is that data you showed taken from an engine dyno?
Robert
Looks like you find what we find too about losses, ideal for comparison work, good feedback and interesting graph.
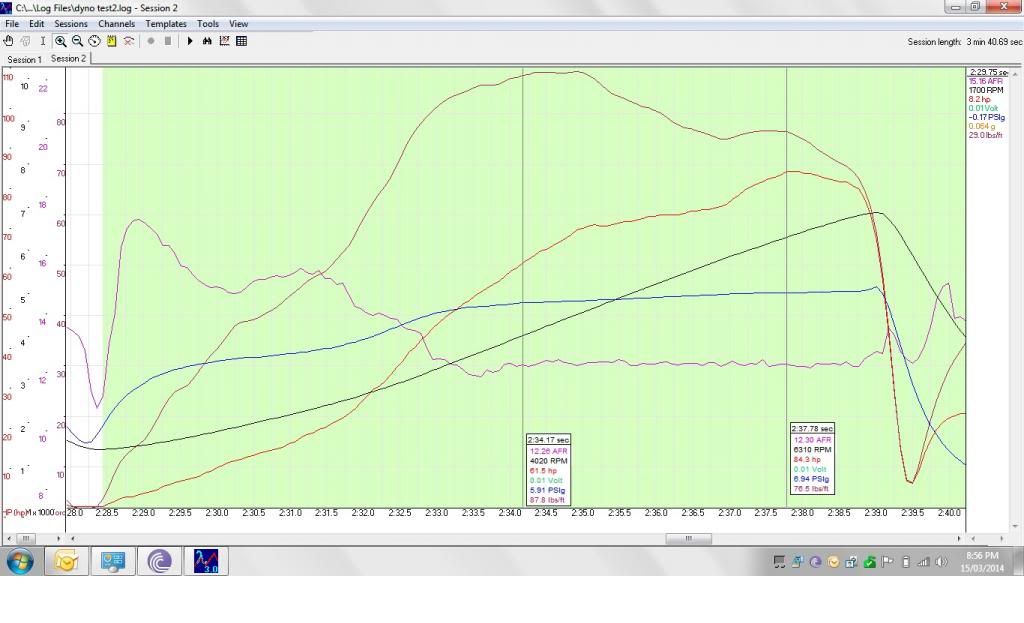
I made a muck up the other day, with the pau switched on I did a pure inertia run, absolutely crap curve and numbers! I was a little red faced but customer happy when I redid the testing 'properly'
The Rototest graph just goes to show the difficulty of trying to compare Manufacturers claimed flywheel figures with Rototest at the hub measured figures.
Peter
Is that data you showed taken from an engine dyno?
Robert
Looks like you find what we find too about losses, ideal for comparison work, good feedback and interesting graph.
I made a muck up the other day, with the pau switched on I did a pure inertia run, absolutely crap curve and numbers! I was a little red faced but customer happy when I redid the testing 'properly'
The Rototest graph just goes to show the difficulty of trying to compare Manufacturers claimed flywheel figures with Rototest at the hub measured figures.
Peter
PeterBurgess said:
Hi Stan
Is that data you showed taken from an engine dyno?
Peter
Peter,Is that data you showed taken from an engine dyno?
Peter
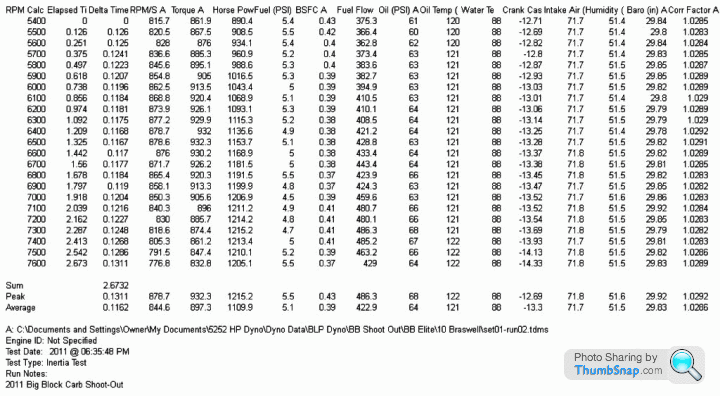
Yes the data for the BLP Inertia dyno is an engine dyno.
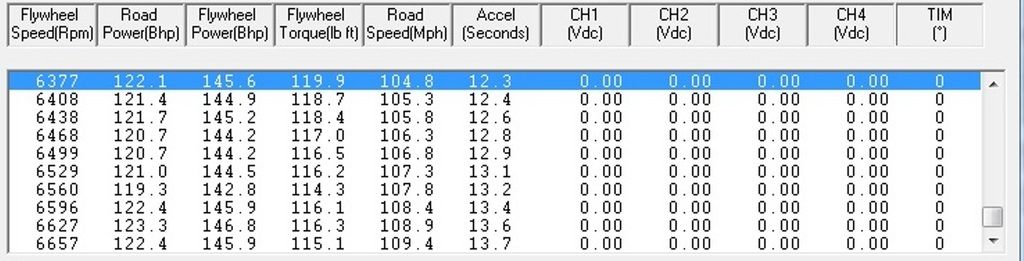
9 or 10 years ago I tried to take OBD II data that I captured during a run(s) from my own 2000 Mustang GT and use it to calculate Wheel HP and Torque. The results were less than poor. A few years later I talked a number of times with Mike Laws from BLP about what I was trying to do how their dyno worked. Using the RPM and time data from their dyno I came up with results that were very close to theirs. One of these days I will get back to using data capture information.
Stan
PS - The reason for wanting the acceleration rate is different rates will produce a small difference in the HP / Torque results.
PPS - Anyone have any data capture information either MPH and time or RPM and time that they would like to share?
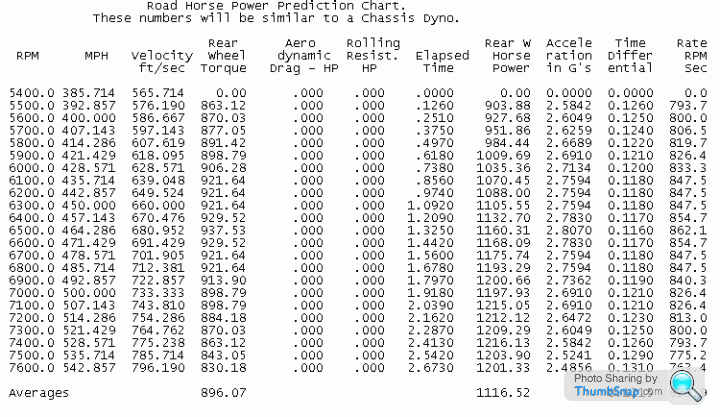
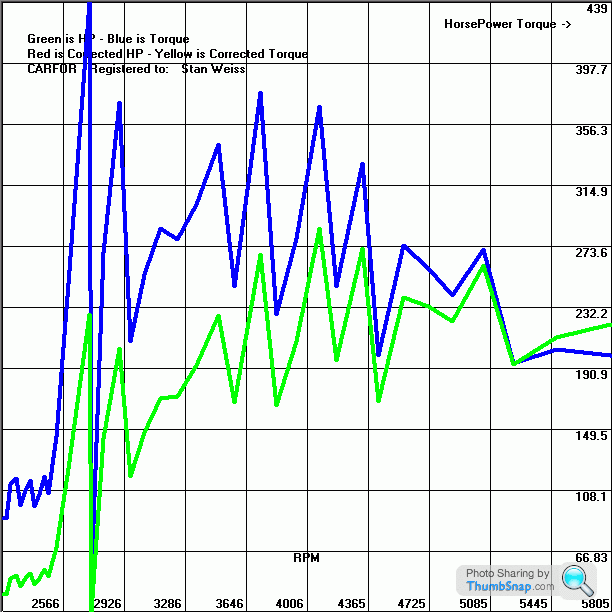
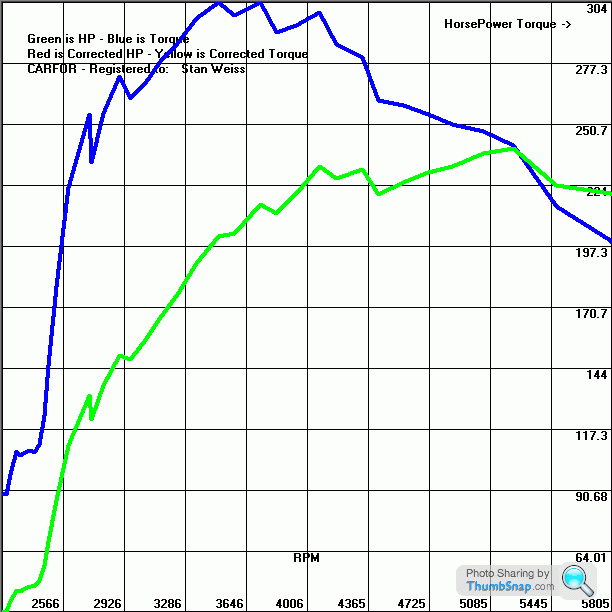
This is what I have generated from the BLP inertia dyno data.
Edited by Stan Weiss on Saturday 30th May 16:05
Edited by Stan Weiss on Saturday 30th May 16:07
PeterBurgess said:
The Rototest graph just goes to show the difficulty of trying to compare Manufacturers claimed flywheel figures with Rototest at the hub measured figures.
Manufacturer certified power figures are the closest to any truely "accurate" figure you are going to get. They will have been recorded from an engine(s) in a known condition, on a certified test system, under controlled conditions (fuel grade, temps, pressures etc, are are "steady state" values (ie, the average power over a 30sec period at that steady state)All that rototest graph tells us is that this particular setup is about 8% off. Calculating WHY it is 8% off would be an entirely more complex undertaking, involving not just the consideration of cumulative errors but systematic ones too!
In all cases, Power is just the measurement of a torque being generated at a certain velocity, and these days with solid state sensors (load cells using strain gauges etc) and high resolution digital electronics, the basic measurement error for power should be no more than 1% really, (assuming correct and current sensor / system calibration) The really big uncertainties are within the boundary conditions for such testing, and why std correction factors were established to attempt to normalise those anomalous conditions.
For reference i have just helped commission some new state of the art engine test cells, which have cost approx £2M per cell, and can control boundary conditions to 0.5degC / 0.1kPa, run on all known refference fuels, and measure EVERYTHING.
Even then, when we do a cumulative error study, we struggle to get overall accuracy better than 1% In fact, such are the issues with getting accurate and repeatable measurements on modern multi-degree-of-freedom engines, we know use cylinder thermodynamics as our primary arbiter of performance, not flywheel torque!
NewTestCells
Each cell also undergoes a "statistical normalisation study" using an extremely tightly controlled (and instrumented reference engine) so we can estimate both the magnitude and the shape of the data distribution for an individual cell!
Without wishing to sound rude, it makes me laugh when i read tuners on the net shouting about how they "found an extra 5bhp" on a 300bhp engine (1.6%) after a single run on a chassis dyno.
(as an aside, all OEM chassis dynos used single 48" rolls to help avoid tyre effects)
Max_Torque said:
Manufacturer certified power figures are the closest to any truely "accurate" figure you are going to get. They will have been recorded from an engine(s) in a known condition, on a certified test system, under controlled conditions (fuel grade, temps, pressures etc, are are "steady state" values (ie, the average power over a 30sec period at that steady state)
All that rototest graph tells us is that this particular setup is about 8% off. Calculating WHY it is 8% off would be an entirely more complex undertaking, involving not just the consideration of cumulative errors but systematic ones too!
In all cases, Power is just the measurement of a torque being generated at a certain velocity, and these days with solid state sensors (load cells using strain gauges etc) and high resolution digital electronics, the basic measurement error for power should be no more than 1% really, (assuming correct and current sensor / system calibration) The really big uncertainties are within the boundary conditions for such testing, and why std correction factors were established to attempt to normalise those anomalous conditions.
For reference i have just helped commission some new state of the art engine test cells, which have cost approx £2M per cell, and can control boundary conditions to 0.5degC / 0.1kPa, run on all known refference fuels, and measure EVERYTHING.
Even then, when we do a cumulative error study, we struggle to get overall accuracy better than 1% In fact, such are the issues with getting accurate and repeatable measurements on modern multi-degree-of-freedom engines, we know use cylinder thermodynamics as our primary arbiter of performance, not flywheel torque!
NewTestCells
Each cell also undergoes a "statistical normalisation study" using an extremely tightly controlled (and instrumented reference engine) so we can estimate both the magnitude and the shape of the data distribution for an individual cell!
Without wishing to sound rude, it makes me laugh when i read tuners on the net shouting about how they "found an extra 5bhp" on a 300bhp engine (1.6%) after a single run on a chassis dyno.
(as an aside, all OEM chassis dynos used single 48" rolls to help avoid tyre effects)
If I can ask? Are these dynos doing a fix acceleration rate variable load testing or fix load variable acceleration rate testing?All that rototest graph tells us is that this particular setup is about 8% off. Calculating WHY it is 8% off would be an entirely more complex undertaking, involving not just the consideration of cumulative errors but systematic ones too!
In all cases, Power is just the measurement of a torque being generated at a certain velocity, and these days with solid state sensors (load cells using strain gauges etc) and high resolution digital electronics, the basic measurement error for power should be no more than 1% really, (assuming correct and current sensor / system calibration) The really big uncertainties are within the boundary conditions for such testing, and why std correction factors were established to attempt to normalise those anomalous conditions.
For reference i have just helped commission some new state of the art engine test cells, which have cost approx £2M per cell, and can control boundary conditions to 0.5degC / 0.1kPa, run on all known refference fuels, and measure EVERYTHING.
Even then, when we do a cumulative error study, we struggle to get overall accuracy better than 1% In fact, such are the issues with getting accurate and repeatable measurements on modern multi-degree-of-freedom engines, we know use cylinder thermodynamics as our primary arbiter of performance, not flywheel torque!
NewTestCells
Each cell also undergoes a "statistical normalisation study" using an extremely tightly controlled (and instrumented reference engine) so we can estimate both the magnitude and the shape of the data distribution for an individual cell!
Without wishing to sound rude, it makes me laugh when i read tuners on the net shouting about how they "found an extra 5bhp" on a 300bhp engine (1.6%) after a single run on a chassis dyno.
(as an aside, all OEM chassis dynos used single 48" rolls to help avoid tyre effects)
Stan
Stan Weiss said:
If I can ask? Are these dynos doing a fix acceleration rate variable load testing or fix load variable acceleration rate testing?
Stan
OEM std chassis rolls are generally dynamic with full inertia simualation / cancellation. Because they use large AC electric motors as the load, they are programmed to negate their own inertia, but to account for the vehicle mass inertia (and on a 2wd dyno, the rotational inertia of the non spinning axle etc)Stan
It's unusual for an OEM to do any significant power testing in vehicle because it's pretty much impossible to maintain fixed boundary conditions. However, we can do vehicle vs engine dyno correlations to identify differences in performance from inlet / exhaust lines etc, but often this will use cylinder pressure measurement, rather than torque measurement.
Most chassis rolls power runs will be non steady state, with probably 30 sec to 45sec taken to do the run
Most OEM engine dyno testing will be steady state or pseudo steady state, but the complexity of modern powertrains is forcing more and more fully dynamic engine dyno testing.(to allow correlation with vehicle emissions tests, and system integration work for transmissions / hybrid systems etc) The latest cells i worked on have 575kW fully transient capability (drive & Absorb) and can do full cycle simulation. It's pretty amazing watching a >600bhp engine "do the nurburgring" in the cell 2 feet away!
Hi Stan
When we get the SF901 running and we do something interesting we'll give you the info you want. I fear chassis dyno info would be too messy
I thought the Rototest stuff was showing a population distribution based on testing 404 engines with most common -10% to -4% off the Manufacturers figures? With some 24 engines being 14% different from claimed?
Peter
Edited by PeterBurgess on Saturday 30th May 18:30
Stan Weiss said:
PPS - Anyone have any data capture information either MPH and time or RPM and time that they would like to share?
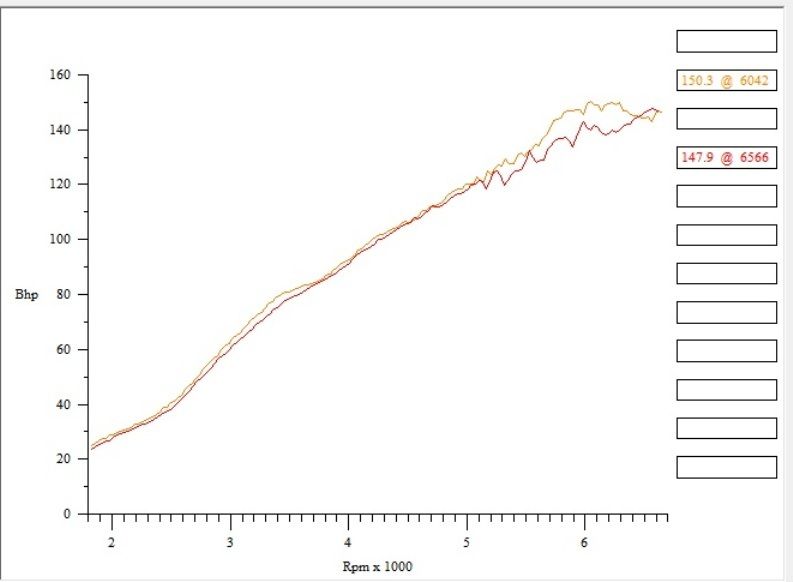
bit of rough graphing data on run times stan , all peaking around 7k, i have the innovate data logging on y machine too thats the busy graph , the other one is simply mph over time , thers are about 12 runs there , but a lot on one engine so they sit on top of each other .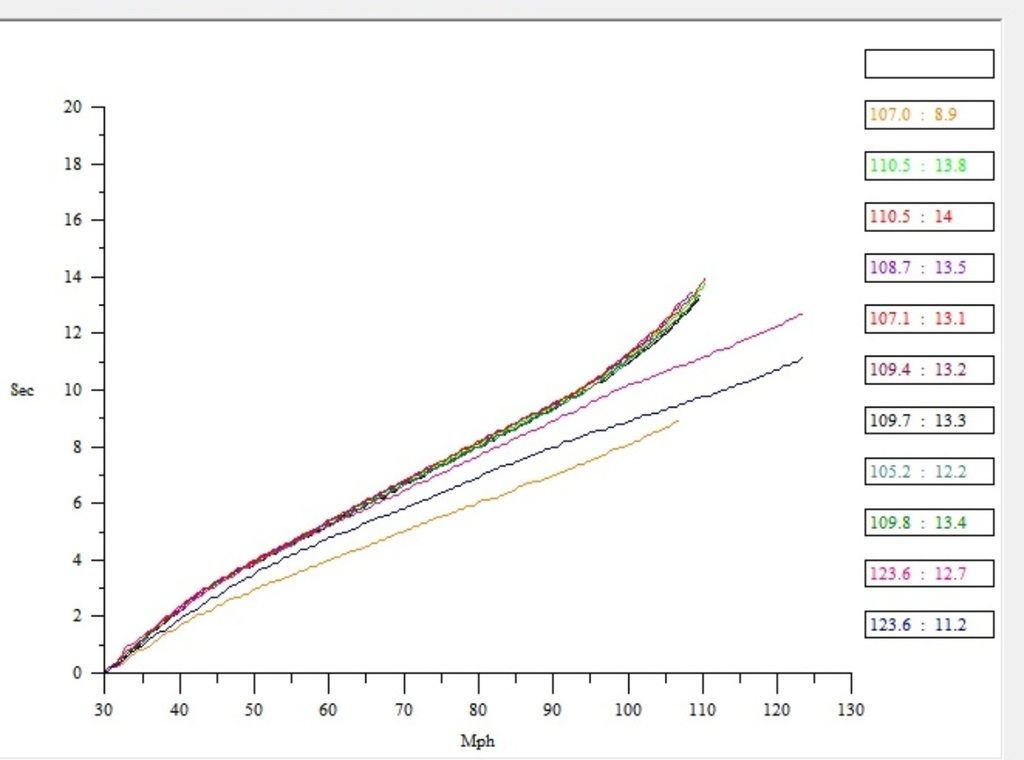
robert.
oh peter , have you played with the level of smoothing at all? i found a lot more detail on the dynocom with smoothing at level 1 i think it was , if you go too low on smoothing it just goes a bit mental(unless they have changed their software) .
bit more for you stan ,
a slice of logged run ..
and a couple of runs , not identical at the top end as i was doing some closed loop and timing stuff , but you can see the bhp ,and the times it took for two different ramp rates , i slowed ramp time down to focus on the higher ranges.
this was a 1.4 8 valve astra on lpg and low boost.
robert.
Max_Torque said:
OEM std chassis rolls are generally dynamic with full inertia simualation / cancellation. Because they use large AC electric motors as the load, they are programmed to negate their own inertia, but to account for the vehicle mass inertia (and on a 2wd dyno, the rotational inertia of the non spinning axle etc)
It's unusual for an OEM to do any significant power testing in vehicle because it's pretty much impossible to maintain fixed boundary conditions. However, we can do vehicle vs engine dyno correlations to identify differences in performance from inlet / exhaust lines etc, but often this will use cylinder pressure measurement, rather than torque measurement.
Most chassis rolls power runs will be non steady state, with probably 30 sec to 45sec taken to do the run
Most OEM engine dyno testing will be steady state or pseudo steady state, but the complexity of modern powertrains is forcing more and more fully dynamic engine dyno testing.(to allow correlation with vehicle emissions tests, and system integration work for transmissions / hybrid systems etc) The latest cells i worked on have 575kW fully transient capability (drive & Absorb) and can do full cycle simulation. It's pretty amazing watching a >600bhp engine "do the nurburgring" in the cell 2 feet away!
Thanks again!It's unusual for an OEM to do any significant power testing in vehicle because it's pretty much impossible to maintain fixed boundary conditions. However, we can do vehicle vs engine dyno correlations to identify differences in performance from inlet / exhaust lines etc, but often this will use cylinder pressure measurement, rather than torque measurement.
Most chassis rolls power runs will be non steady state, with probably 30 sec to 45sec taken to do the run
Most OEM engine dyno testing will be steady state or pseudo steady state, but the complexity of modern powertrains is forcing more and more fully dynamic engine dyno testing.(to allow correlation with vehicle emissions tests, and system integration work for transmissions / hybrid systems etc) The latest cells i worked on have 575kW fully transient capability (drive & Absorb) and can do full cycle simulation. It's pretty amazing watching a >600bhp engine "do the nurburgring" in the cell 2 feet away!
I would think with all of that data, that now and then the results surprises you.
If I can ask? At what frequency and how many channels can they log?
Stan
PeterBurgess said:
Hi Stan
When we get the SF901 running and we do something interesting we'll give you the info you want. I fear chassis dyno info would be too messy
I thought the Rototest stuff was showing a population distribution based on testing 404 engines with most common -10% to -4% off the Manufacturers figures? With some 24 engines being 14% different from claimed?
Peter
Peter,When we get the SF901 running and we do something interesting we'll give you the info you want. I fear chassis dyno info would be too messy
I thought the Rototest stuff was showing a population distribution based on testing 404 engines with most common -10% to -4% off the Manufacturers figures? With some 24 engines being 14% different from claimed?
Peter
Edited by PeterBurgess on Saturday 30th May 18:30
I must be different, because I find that part is the fun part.
Stan
Robert
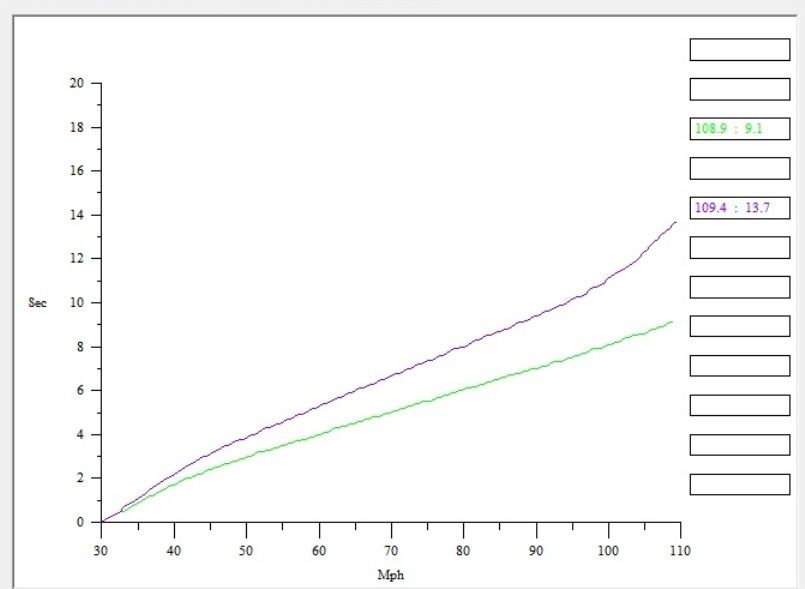
Thanks for the posts. My data collection was done on a real road logging the OBD II port. I had to use 2nd gear to not go over the speed limit by to much. Here is a graph from the raw data and then one with the data smoothed. I was thinking that the raw data should have been some what better without any smoothing.
Stan
Thanks for the posts. My data collection was done on a real road logging the OBD II port. I had to use 2nd gear to not go over the speed limit by to much.
Here is a graph from the raw data and then one with the data smoothed. I was thinking that the raw data should have been some what better without any smoothing.Stan
Gassing Station | Engines & Drivetrain | Top of Page | What's New | My Stuff