Computer simulation of vehicle performance
Discussion


Stan Weiss said:
Dave,
Great. Maybe you help me out then. Over the years I have fine tuned my logic a few times. When using normal air density it is fine. I believe when using lower air densities I any coming up low.
Air Density is 0.076501 @ 160 MPH = 1.0309367 increase
Air Density is 0.060000 @ 160 MPH = 1.0242638 increase - Shouldn't I still get the same 1.0309367 increase?
Nah mate. Ram effect is 1/2 x air density x MPH^2 so the effect will always rise and fall with barometric pressure.Great. Maybe you help me out then. Over the years I have fine tuned my logic a few times. When using normal air density it is fine. I believe when using lower air densities I any coming up low.
Air Density is 0.076501 @ 160 MPH = 1.0309367 increase
Air Density is 0.060000 @ 160 MPH = 1.0242638 increase - Shouldn't I still get the same 1.0309367 increase?
However as the air density changes so obviously do both the aero drag and also the engine bhp so the acceleration curve will be affected by both.
Aero drag in lbs at STP is CdA x V^2 x 0.00256 but as air density alters so will that 0.00256 number. As air density falls so will engine power and ram effect.
Anyway I can't be arsed with all this stuff in my own program. It just assumes STP.
Edited by Pumaracing on Tuesday 16th June 00:51
Dave/Stan,
what do you need to get an accurate power output from vehicle data?
Car- Mass, Cd & Frontal Area, or CdA, gear ratios, final drive ratio, wheel tyre combo?
Data-
60 Foot ET ?
330 Foot ET ?
1/8 Mile ET ?
1/8 Mile MPH ?
1000 Foot ET ?
1/4 Mile ET ?
1/4 Mile MPH ?
Can you do the calc for the following…
RWD
1300kg
0.33Cd
1.88m2 frontal area
CdA 0.62
1st 3.72
2nd 2.40
3rd 1.77
4th 1.26
5th 1:1
Final drive 3.15
225/45 R16 tyre
60 Foot ET 2.89
330 Foot ET 6.61
1/8 Mile ET 9.55
1/8 Mile MPH 85mph
1000 Foot ET 12.02
1/4 Mile ET 14.06
1/4 Mile MPH 111.7mph
Pumaracing said:
No worries. Anyway the computer simulation is actually more accurate than a dyno if the weight and gearing are known precisely.
Here is your 2008 run on the gearing you stated. I've left 5th as the 0.74 you previously mentioned. Dunno if that's correct.
60ft - 1.62 @ 50.5
220 yards - 6.39 @ 117.3 (115.2 @ 210 yards)
440 yards - 9.84 @ 146.1 (145.0 @ 430 yards)
880 yards - 15.43 @ 174.0 (173.5 @ 870 yards)
1 mile - 24.91 @ 202.0
I've also given you the 10 yards less mph from how I think drag strip timing gear averages things.
In practice you hit the 60 ft mark a bit quicker than simulated because of stored flywheel energy dumped into the vehicle when you drop the clutch. I don't simulate that but might add it in one day.
Seems you can just crack 200 mph in the standing mile which is nice with those aerodynamics. 202 mph to be exact. Probably a smidge less on actual timing equipment however that works but somewhere between 201.8 and 202.0.
The AX-22 quoted 202.2mph at the mile, the timing gear indicated 201.96mph.Here is your 2008 run on the gearing you stated. I've left 5th as the 0.74 you previously mentioned. Dunno if that's correct.
60ft - 1.62 @ 50.5
220 yards - 6.39 @ 117.3 (115.2 @ 210 yards)
440 yards - 9.84 @ 146.1 (145.0 @ 430 yards)
880 yards - 15.43 @ 174.0 (173.5 @ 870 yards)
1 mile - 24.91 @ 202.0
I've also given you the 10 yards less mph from how I think drag strip timing gear averages things.
In practice you hit the 60 ft mark a bit quicker than simulated because of stored flywheel energy dumped into the vehicle when you drop the clutch. I don't simulate that but might add it in one day.
Seems you can just crack 200 mph in the standing mile which is nice with those aerodynamics. 202 mph to be exact. Probably a smidge less on actual timing equipment however that works but somewhere between 201.8 and 202.0.
Edited by Pumaracing on Tuesday 16th June 13:21
A little odd that calculating based on the strip 1/4 mile, ends up with the same trap speed at the mile as the airfield runs. Albeit 2 years apart and with slightly different engines.
I guess biggest difference on airfield is the run simply lasts longer.
But certainly time, and less so speed at the 1/4 is vastly different between the two surfaces
Either way aero does kill mine so much, especially once above 170 or so.
In a couple of months if everything hangs together, I'd hope it will run around 185mph in the 1/2 mile pushing 190-200mph over 1km.
I think 200mph is a bit much to ask, but based on last year I've no doubt 190+ is achievable over standing 1km, as long as 5th gear survives.
All very interesting stuff. I'd never have believed such simulations would/could mirror reality.
stevesingo said:
Dave/Stan,
what do you need to get an accurate power output from vehicle data?
Car- Mass, Cd & Frontal Area, or CdA, gear ratios, final drive ratio, wheel tyre combo?
Data-
60 Foot ET ?
330 Foot ET ?
1/8 Mile ET ?
1/8 Mile MPH ?
1000 Foot ET ?
1/4 Mile ET ?
1/4 Mile MPH ?
Can you do the calc for the following…
RWD
1300kg
0.33Cd
1.88m2 frontal area
CdA 0.62
1st 3.72
2nd 2.40
3rd 1.77
4th 1.26
5th 1:1
Final drive 3.15
225/45 R16 tyre
60 Foot ET 2.89
330 Foot ET 6.61
1/8 Mile ET 9.55
1/8 Mile MPH 85mph
1000 Foot ET 12.02
1/4 Mile ET 14.06
1/4 Mile MPH 111.7mph
Stevie,what do you need to get an accurate power output from vehicle data?
Car- Mass, Cd & Frontal Area, or CdA, gear ratios, final drive ratio, wheel tyre combo?
Data-
60 Foot ET ?
330 Foot ET ?
1/8 Mile ET ?
1/8 Mile MPH ?
1000 Foot ET ?
1/4 Mile ET ?
1/4 Mile MPH ?
Can you do the calc for the following…
RWD
1300kg
0.33Cd
1.88m2 frontal area
CdA 0.62
1st 3.72
2nd 2.40
3rd 1.77
4th 1.26
5th 1:1
Final drive 3.15
225/45 R16 tyre
60 Foot ET 2.89
330 Foot ET 6.61
1/8 Mile ET 9.55
1/8 Mile MPH 85mph
1000 Foot ET 12.02
1/4 Mile ET 14.06
1/4 Mile MPH 111.7mph
Is this with or without any roll out? That track has no traction.
This is the quickest run from my 2000 Mustang GT 5 speed (Right / 204) on Toyo 245-45-R17 street tires. But its best 60 foot time was a 2.056.
Stan
Stan Weiss said:
Stevie,
Is this with or without any roll out? That track has no traction.
This is the quickest run from my 2000 Mustang GT 5 speed (Right / 204) on Toyo 245-45-R17 street tires. But its best 60 foot time was a 2.056.
Stan
For bog standard road tyres and a manual car, that's a bloody good 60ft.Is this with or without any roll out? That track has no traction.
This is the quickest run from my 2000 Mustang GT 5 speed (Right / 204) on Toyo 245-45-R17 street tires. But its best 60 foot time was a 2.056.
Stan
I've seen auto's do better, but it's just so difficult for a manual. Comparing to airfields etc, I'd still consider that a good 60ft for Hoosiers on an airfield for my own car.
Steviesingo's time almost sounds like normal tyres on a airfield type surface, although dont think many of them give full 1/4 stats ?
stevesingo said:
Dave/Stan,
what do you need to get an accurate power output from vehicle data?
Car- Mass, Cd & Frontal Area, or CdA, gear ratios, final drive ratio, wheel tyre combo?
Data-
60 Foot ET ?
330 Foot ET ?
1/8 Mile ET ?
1/8 Mile MPH ?
1000 Foot ET ?
1/4 Mile ET ?
1/4 Mile MPH ?
Can you do the calc for the following…
RWD
1300kg
0.33Cd
1.88m2 frontal area
CdA 0.62
1st 3.72
2nd 2.40
3rd 1.77
4th 1.26
5th 1:1
Final drive 3.15
225/45 R16 tyre
60 Foot ET 2.89
330 Foot ET 6.61
1/8 Mile ET 9.55
1/8 Mile MPH 85mph
1000 Foot ET 12.02
1/4 Mile ET 14.06
1/4 Mile MPH 111.7mph
Steve,what do you need to get an accurate power output from vehicle data?
Car- Mass, Cd & Frontal Area, or CdA, gear ratios, final drive ratio, wheel tyre combo?
Data-
60 Foot ET ?
330 Foot ET ?
1/8 Mile ET ?
1/8 Mile MPH ?
1000 Foot ET ?
1/4 Mile ET ?
1/4 Mile MPH ?
Can you do the calc for the following…
RWD
1300kg
0.33Cd
1.88m2 frontal area
CdA 0.62
1st 3.72
2nd 2.40
3rd 1.77
4th 1.26
5th 1:1
Final drive 3.15
225/45 R16 tyre
60 Foot ET 2.89
330 Foot ET 6.61
1/8 Mile ET 9.55
1/8 Mile MPH 85mph
1000 Foot ET 12.02
1/4 Mile ET 14.06
1/4 Mile MPH 111.7mph
OK, it is hard to simulate this run. Using no roll out I get
60 Foot ET = 3.0525
330 Foot ET = 6.7346
1/8 Mile ET = 9.5686
1/8 Mile MPH = 86.9256
1000 Foot ET = 12.0068
1/4 Mile ET = 14.0533
1/4 Mile MPH = 110.8472
using around 242 RWHP
Stan
stevesingo said:
Dave/Stan,
60 Foot ET 2.89
330 Foot ET 6.61
1/8 Mile ET 9.55
1/8 Mile MPH 85mph
1000 Foot ET 12.02
1/4 Mile ET 14.06
1/4 Mile MPH 111.7mph
This is not an internally consistent set of data and hence not possible to simulate. A car of that weight hitting 85 mph at 220 yards should only be doing about 105 mph at 440.60 Foot ET 2.89
330 Foot ET 6.61
1/8 Mile ET 9.55
1/8 Mile MPH 85mph
1000 Foot ET 12.02
1/4 Mile ET 14.06
1/4 Mile MPH 111.7mph
Alternatively if it really hits 111.7 at 440 yards it should be doing about 91 mph at 220 and hitting the 1/4 mile in 13.3 seconds.
I'll have to pass because the variability of the power figures necessary to juggle different parts of that acceleration curve correct is so high as to leave almost zero confidence in the results. Either these are not good numbers or the track grip was massively different in different places or the engine power kept changing.
And Stan! Oi! No you didn't get a consistent simulation out of that set of numbers. It isn't possible.
stevieturbo said:
In a couple of months if everything hangs together, I'd hope it will run around 185mph in the 1/2 mile pushing 190-200mph over 1km.
I think 200mph is a bit much to ask, but based on last year I've no doubt 190+ is achievable over standing 1km, as long as 5th gear survives.
All very interesting stuff. I'd never have believed such simulations would/could mirror reality.
To hit 185 mph at 1/2 mile you'll need about 1060 flywheel bhp and kilometre will be 195.8 mphI think 200mph is a bit much to ask, but based on last year I've no doubt 190+ is achievable over standing 1km, as long as 5th gear survives.
All very interesting stuff. I'd never have believed such simulations would/could mirror reality.
To hit 200 mph in the kilometre you'll need 1130 bhp. 1/2 mile will be 189 mph.
That assumes your slicks and 1.8g off the line. On road tyres you'll be several mph off those numbers.
Reality is just physics. Computers do physics rather nicely if the programming is correct. My program is now so complex after 25 years of adding bells and whistles to it I daren't tinker with it much further in case it achieves sentience and decides it no longer needs me.
One day the machines will rise!
Pumaracing said:
To hit 185 mph at 1/2 mile you'll need about 1060 flywheel bhp and kilometre will be 195.8 mph
To hit 200 mph in the kilometre you'll need 1130 bhp. 1/2 mile will be 189 mph.
That assumes your slicks and 1.8g off the line. On road tyres you'll be several mph off those numbers.
Reality is just physics. Computers do physics rather nicely if the programming is correct. My program is now so complex after 25 years of adding bells and whistles to it I daren't tinker with it much further in case it achieves sentience and decides it no longer needs me.
One day the machines will rise!
It's always an airfield and will not be slicks so no hope of anything remotely near 1g, just the usual 235 Toyo 888'sTo hit 200 mph in the kilometre you'll need 1130 bhp. 1/2 mile will be 189 mph.
That assumes your slicks and 1.8g off the line. On road tyres you'll be several mph off those numbers.
Reality is just physics. Computers do physics rather nicely if the programming is correct. My program is now so complex after 25 years of adding bells and whistles to it I daren't tinker with it much further in case it achieves sentience and decides it no longer needs me.
One day the machines will rise!
Strangely these gripped better last year than my old Hoosiers, I had to abort 2 runs around 170mph as I couldnt even touch the throttle with them
I did 184mph at 1km last year, but had gearbox issues so effectively lost around 120-130m of track at around 70mph after going from 2nd back into 1st, then struggling to get 3rd again.
Basically picked up 60mph in the last 600m because of the poor first 400m which was mostly 5th gear doing the work.
If I only need 1200hp or so to do it, it certainly seems a realistic proposition
Pumaracing said:
On road tyres at 0.6g off the line you'll need 1230 bhp to hit 200 mph at 1 km.
1/2 mile will be 187 mph.
Here's a question then.1/2 mile will be 187 mph.
With fixed distance and only terminal speed involved...would the simulators be able to suggest best approach to the run ?
ie. It's natural to want to launch as hard as possible, rev out in each gear, the usual foot down type approach.
On the other hand, I've found that certainly when doing speed-speed pulls, using a tall gear often generates a faster acceleration time than the same increment with a shift, eg something like 80-140 or so.
Would a lazy launch, getting into say 3, 4, 5th quicker and using more torque as opposed to rpm's to achieve the speed work better than launching and going as hard as possible the entire way.
elapsed time will be higher, but more time on track gives more time to attain a speed ? What method is more efficient ?
stevieturbo said:
Here's a question then.
With fixed distance and only terminal speed involved...would the simulators be able to suggest best approach to the run ?
ie. It's natural to want to launch as hard as possible, rev out in each gear, the usual foot down type approach.
On the other hand, I've found that certainly when doing speed-speed pulls, using a tall gear often generates a faster acceleration time than the same increment with a shift, eg something like 80-140 or so.
Would a lazy launch, getting into say 3, 4, 5th quicker and using more torque as opposed to rpm's to achieve the speed work better than launching and going as hard as possible the entire way.
elapsed time will be higher, but more time on track gives more time to attain a speed ? What method is more efficient ?
Stevie,With fixed distance and only terminal speed involved...would the simulators be able to suggest best approach to the run ?
ie. It's natural to want to launch as hard as possible, rev out in each gear, the usual foot down type approach.
On the other hand, I've found that certainly when doing speed-speed pulls, using a tall gear often generates a faster acceleration time than the same increment with a shift, eg something like 80-140 or so.
Would a lazy launch, getting into say 3, 4, 5th quicker and using more torque as opposed to rpm's to achieve the speed work better than launching and going as hard as possible the entire way.
elapsed time will be higher, but more time on track gives more time to attain a speed ? What method is more efficient ?
Maybe Dave can check this out in his simulation? I have all of your et's being slower and all of your MPH's being lower except I do have the 1 mile MPH increasing about 2.5 MPH by going from your 3.15:1 rear gear to a 3.00:1 rear gear.
Stan
Pumaracing said:
This is not an internally consistent set of data and hence not possible to simulate. A car of that weight hitting 85 mph at 220 yards should only be doing about 105 mph at 440.
Alternatively if it really hits 111.7 at 440 yards it should be doing about 91 mph at 220 and hitting the 1/4 mile in 13.3 seconds.
I'll have to pass because the variability of the power figures necessary to juggle different parts of that acceleration curve correct is so high as to leave almost zero confidence in the results. Either these are not good numbers or the track grip was massively different in different places or the engine power kept changing.
And Stan! Oi! No you didn't get a consistent simulation out of that set of numbers. It isn't possible.
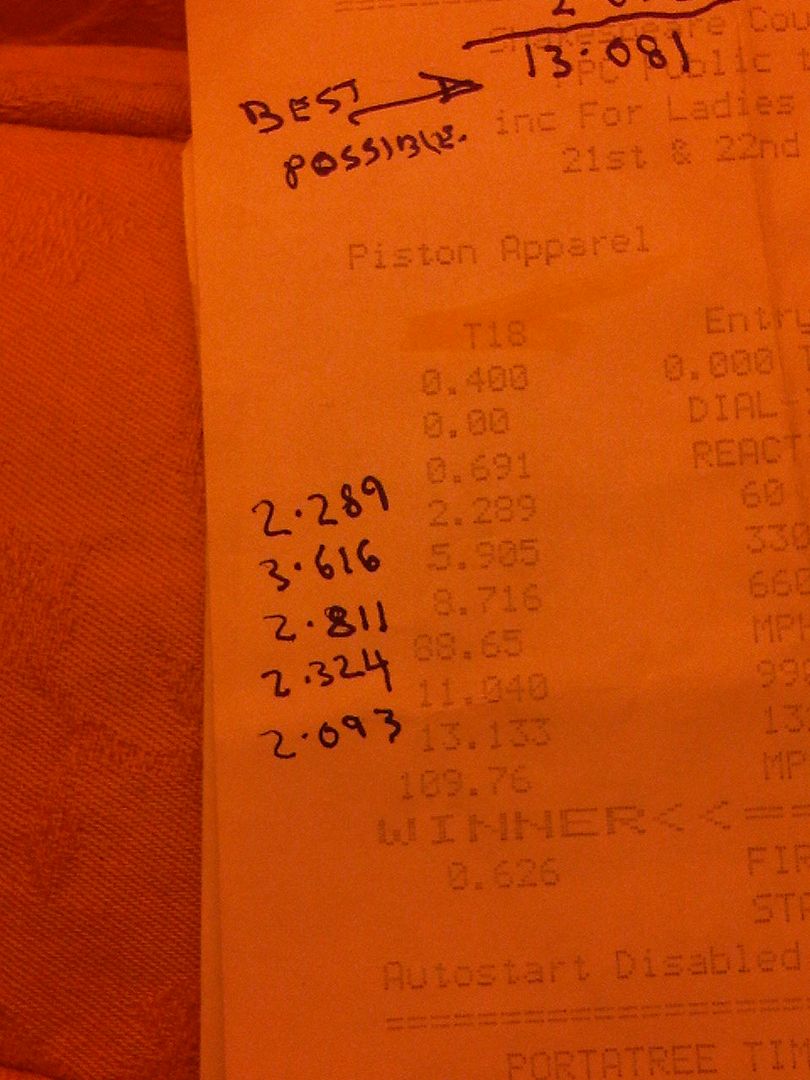
This is the first time slip from the day I posted the other time slip from. My 60 foot time was off. Alternatively if it really hits 111.7 at 440 yards it should be doing about 91 mph at 220 and hitting the 1/4 mile in 13.3 seconds.
I'll have to pass because the variability of the power figures necessary to juggle different parts of that acceleration curve correct is so high as to leave almost zero confidence in the results. Either these are not good numbers or the track grip was massively different in different places or the engine power kept changing.
And Stan! Oi! No you didn't get a consistent simulation out of that set of numbers. It isn't possible.
 In the other lane, they do not show a 60 foot time but that car ran 110.83 MPH and does show the other times and 1/8 mile.
Stan
ivanhoew said:
so chaps , is it the case that if one has a very traction limited fwd car , then drag run data is not going to allow a good sim ? i wonder if this means a sim of my turbo mini would be unviable?robert.
No. The traction can be any value at all as long as it's consistent. The simulation allows for it by taking the 60 ft time.Stan Weiss said:
Steve,
OK, it is hard to simulate this run. Using no roll out I get
60 Foot ET = 3.0525
330 Foot ET = 6.7346
1/8 Mile ET = 9.5686
1/8 Mile MPH = 86.9256
1000 Foot ET = 12.0068
1/4 Mile ET = 14.0533
1/4 Mile MPH = 110.8472
using around 242 RWHP
Stan
Sorry Stan but you're miles out. We know the basic maths in both programs agree but something is going wrong when more complex car details are entered. If you aren't allowing for engine inertia and wheel/tyre inertia then the bhp numbers are always going to be too low.OK, it is hard to simulate this run. Using no roll out I get
60 Foot ET = 3.0525
330 Foot ET = 6.7346
1/8 Mile ET = 9.5686
1/8 Mile MPH = 86.9256
1000 Foot ET = 12.0068
1/4 Mile ET = 14.0533
1/4 Mile MPH = 110.8472
using around 242 RWHP
Stan
ok doke , dave and stan , bit of data for you ..
best run to date .
165/60 12 falken tyres.
runs from a couple of years earlier ,same engine different gearing due to 10'' wheels with 165.60.10 yok 32's
705kg 1551 lbs vehicle weight.
i guess at frontal area 15.5 ft ,and 0.578 drag cf. after trying to match its performance to a sim .
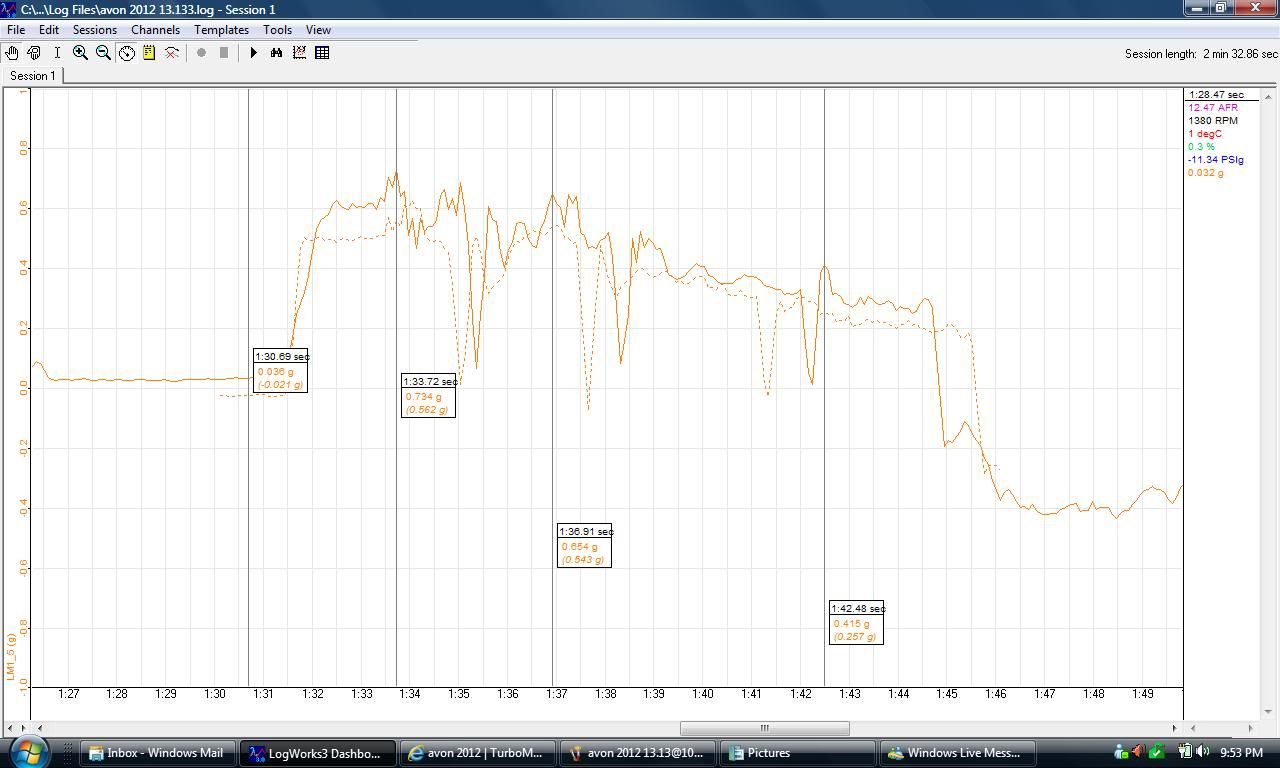
g force log
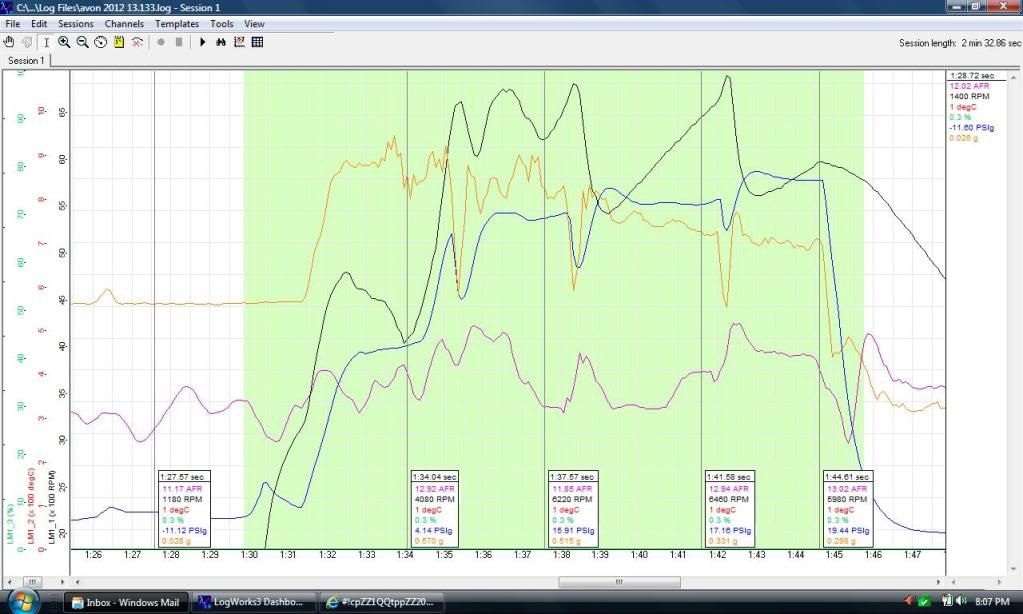
full log ..
i cross the line in 4th at around 6100rpm . pk engine power is 6800 rpm approx.
gear ratios are the clubman set
f 2.583:1 (1st), 1.711:1 (2nd), 1.250:1 (3rd) 1:1 4th.
diff is a 3.1:1.
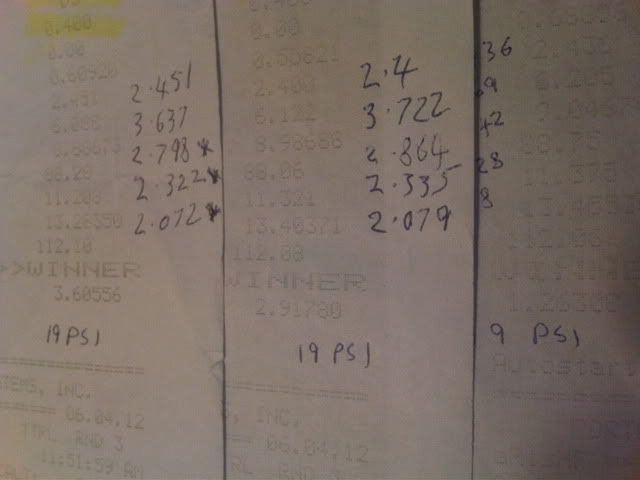
lastly i have this bit of gtech'ing from years ago in '08..
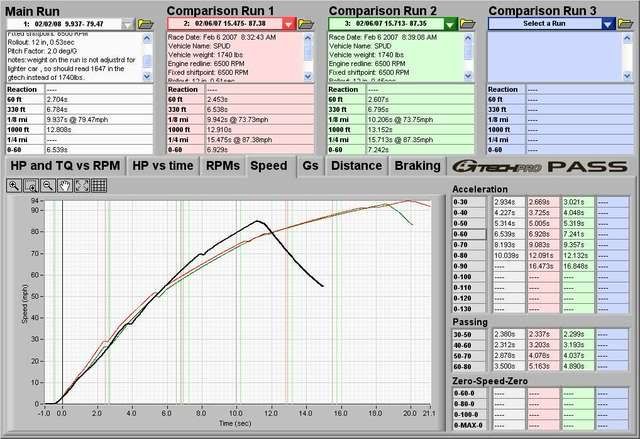
5 degrees temp so no grip , faster runs are 9 psi and straight cut box, instead of the 5.5 psi heli box slower run , oh and its 130 lbs lighter on the two faster runs, so not 1740 but 1610. (before more weight loss took place in '09) .
i have a fair bit of dyno stuff for it , so can put that up too.
when drag racing , i come off the line on 5 psi , ish , and then flick to max 19 as i go into 2nd gear , it then goes a littel erratic ,and grips into 3rd . it peaks at 23 psi on some runs on the gear change ,then settles to 19.xx psi .
thanks robert.
best run to date .
165/60 12 falken tyres.
runs from a couple of years earlier ,same engine different gearing due to 10'' wheels with 165.60.10 yok 32's
705kg 1551 lbs vehicle weight.
i guess at frontal area 15.5 ft ,and 0.578 drag cf. after trying to match its performance to a sim .
g force log
full log ..
i cross the line in 4th at around 6100rpm . pk engine power is 6800 rpm approx.
gear ratios are the clubman set
f 2.583:1 (1st), 1.711:1 (2nd), 1.250:1 (3rd) 1:1 4th.
diff is a 3.1:1.
lastly i have this bit of gtech'ing from years ago in '08..
5 degrees temp so no grip , faster runs are 9 psi and straight cut box, instead of the 5.5 psi heli box slower run , oh and its 130 lbs lighter on the two faster runs, so not 1740 but 1610. (before more weight loss took place in '09) .
i have a fair bit of dyno stuff for it , so can put that up too.
when drag racing , i come off the line on 5 psi , ish , and then flick to max 19 as i go into 2nd gear , it then goes a littel erratic ,and grips into 3rd . it peaks at 23 psi on some runs on the gear change ,then settles to 19.xx psi .
thanks robert.
Edited by ivanhoew on Wednesday 17th June 10:10
stevesingo said:
Dave/Stan,
Can you do the calc for the following…
RWD
1300kg
0.33Cd
1.88m2 frontal area
CdA 0.62
1st 3.72
2nd 2.40
3rd 1.77
4th 1.26
5th 1:1
Final drive 3.15
225/45 R16 tyre
60 Foot ET 2.89
330 Foot ET 6.61
1/8 Mile ET 9.55
1/8 Mile MPH 85mph
1000 Foot ET 12.02
1/4 Mile ET 14.06
1/4 Mile MPH 111.7mph
OK, I've had another crack at it after a night's sleep. It was quite tricky. I think there was a bit of wheel spin off the line which means the track grip and 60 ft ET is not really quite as bad as it looks so I've factored that in. I still can't quite agree the 1/8 mile speed but the rest has matched quite nicely.Can you do the calc for the following…
RWD
1300kg
0.33Cd
1.88m2 frontal area
CdA 0.62
1st 3.72
2nd 2.40
3rd 1.77
4th 1.26
5th 1:1
Final drive 3.15
225/45 R16 tyre
60 Foot ET 2.89
330 Foot ET 6.61
1/8 Mile ET 9.55
1/8 Mile MPH 85mph
1000 Foot ET 12.02
1/4 Mile ET 14.06
1/4 Mile MPH 111.7mph
60 Foot ET 2.83
330 Foot ET 6.65
1/8 Mile ET 9.56
1/8 Mile MPH 87.2mph
1000 Foot ET 11.99
1/4 Mile ET 14.03
1/4 Mile MPH 111.7mph
Flywheel bhp is 340. Wheel bhp is 289.
Gassing Station | Engines & Drivetrain | Top of Page | What's New | My Stuff