Computer simulation of vehicle performance
Discussion


stevieturbo said:
Would a lazy launch, getting into say 3, 4, 5th quicker and using more torque as opposed to rpm's to achieve the speed work better than launching and going as hard as possible the entire way.
No. You're confusing two different things. Saving a gearchange between two specific speeds might well be a good idea but over a whole run you have to change into every gear anyway. You can't go quicker by doing this earlier than usual. You want to maximise engine power delivered at all times.With low grip tyres, if your clutch is up to it, then what you want to do is launch in 2nd or even 3rd because you're just spinning away power in 1st.
thanks dave , its including the driver ,also i should add , on my fastest run , it span up on the 2nd to 3rd gear change for a good few 10th , enough to make me think i was going to take out the car in the other lane for a moment ..so the whole power is definately not getting to the ground until a little into 3rd gear .
regards
robert.
regards
robert.
Pumaracing said:
Ok Ivanhoew
Another quite tricky run to simulate compared to Stevieturbo's but I get a reasonable match at about 213 flywheel bhp, 180 ish at the wheels.
Another quite tricky run to simulate compared to Stevieturbo's but I get a reasonable match at about 213 flywheel bhp, 180 ish at the wheels.
Pumaracing said:
No. You're confusing two different things. Saving a gearchange between two specific speeds might well be a good idea but over a whole run you have to change into every gear anyway. You can't go quicker by doing this earlier than usual. You want to maximise engine power delivered at all times.
With low grip tyres, if your clutch is up to it, then what you want to do is launch in 2nd or even 3rd because you're just spinning away power in 1st.
1st gear is already tall, but I'm looking at it from a different perspective.With low grip tyres, if your clutch is up to it, then what you want to do is launch in 2nd or even 3rd because you're just spinning away power in 1st.
Yes going flat out is the best way to achieve a low elapsed time over distance.
So I'm not saying to avoid a gear, more about what is the most efficient use of each gear to achieve a high speed at the end given limited grip.
But often a lazier run can still yield good trap speeds, sometimes higher over that same fixed distance. But it will take longer. ie more time on track to achieve a speed.
If you watch some videos of a lot of big power cars doing mile runs, most are quite lazy at the start, but they hit big speeds.
I'll maybe try and do some testing over 1/2mile and see with the 2 different approaches.
Pumaracing said:
So what did the dyno say?
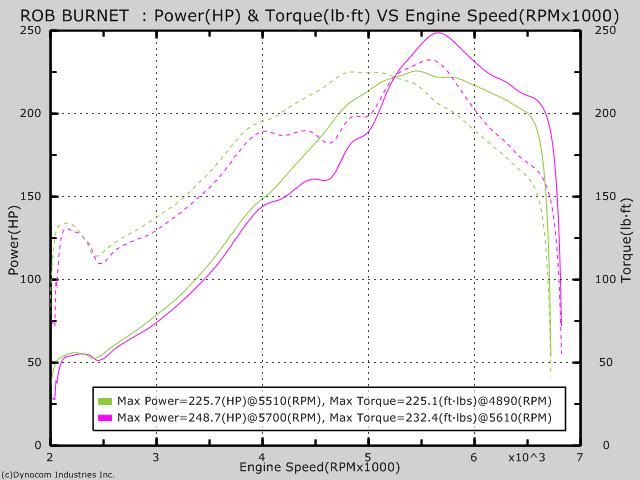
a few different chassis dyno runs ,at different places ..first off a dynocom graph ,,with erronous rpm and a big boost spike to 23 psi
there are two curves here , one on a reasonable 13.1: 1 air fuel ratio ,the smooth run ,at around 19 psi boost ,this run has the rpm wrong by about 150 to 200 rpm too low ,so needs moving to the right by that much ,you can then see it replicating part of the other run .
the other run is a poor mixture up to 4500 odd ,at up to 16:1 afr ,also it has the side pipe on to reduce back pressure , i think this shows up at the top end better on the graph .if i had the choke out fast enough ,this graph would have the highest trq of all and mimic the other better mix graph below 4k rpm .
i then did a bit of experimentation, and realised the dyno was adding 20 bhp for losses ,all the way from 0 to max revs , so i plotted the nms superflow losses(from another dyno day) onto the dynocom power at wheels .and got this ..
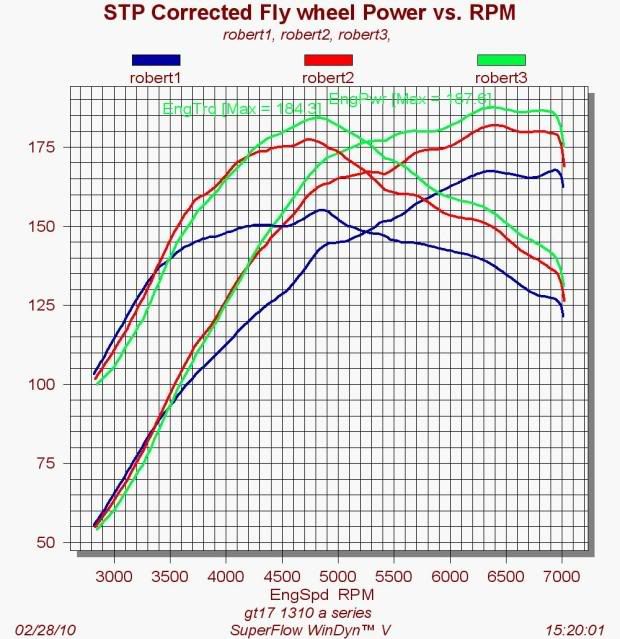
then from nms with thier new as it was then superflow chassis dyno ,
this was 3 runs 12 ,15,and 16 psi.. with no flow through ic , but shell v power.
then my chassis dyno ,calibrated to the max i can achieve,, with the 12 psi superflow runs , both dyno's doing thier own losses calc . my dyno was with ic cooling fan , but 95 unleaded.
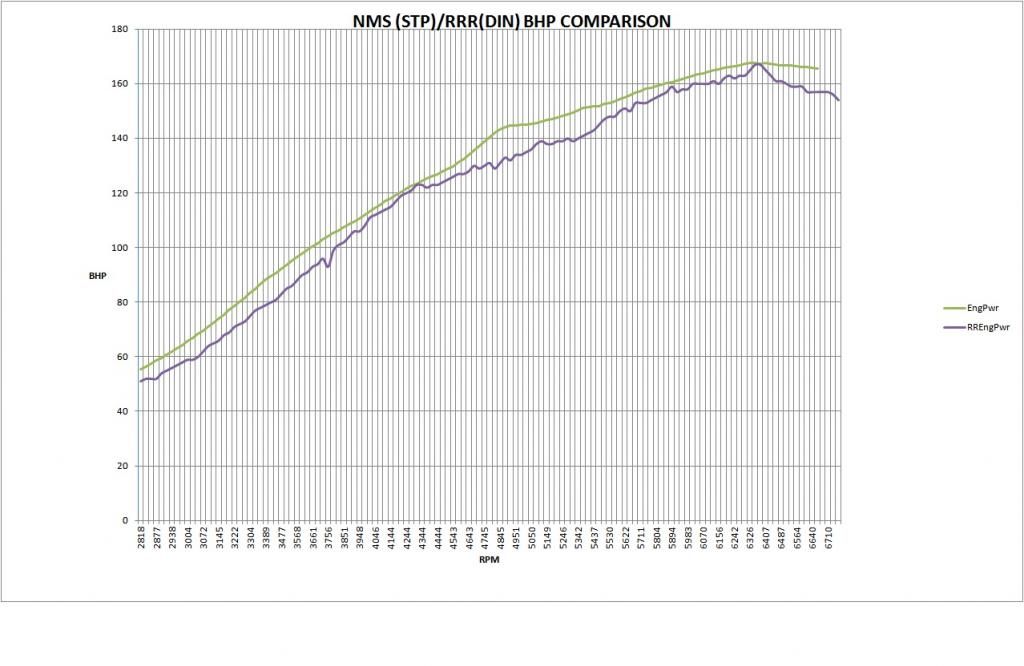
so approx 12 psi is 170bhp ,16 psi 190bhp .and appears to gain 5 bhp /psi . i think at nms with a good flow through the ic i could have hit 200.
losses work out at around 16 to 18 bhp .
note ... please apply the word THEORETICAL or APPROXIMATE any where you feel it appropriate.

regards
robert.
forgot to add , all nms and my dyno runs done with full 2'' exhaust ... the dynocom runs , and my drag racing are done with a 2.5" side pipe . this appeared to add around 18 bhp at dynocom...as shown on their graph.
Edited by ivanhoew on Wednesday 17th June 15:35
Hi Stevie
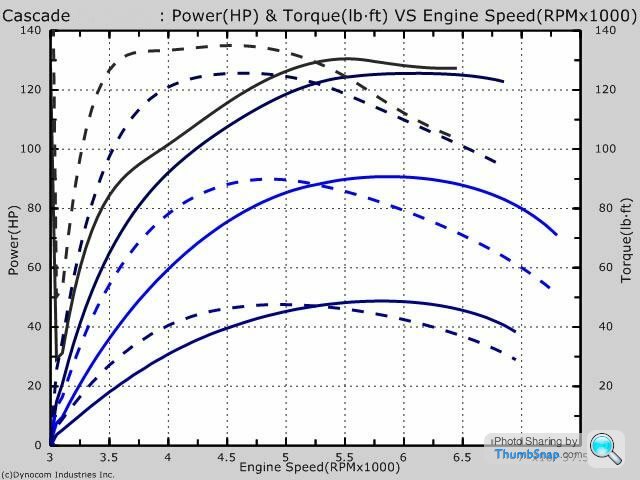
The guys who have done best in terms of championships with our heads/engines/dynoing since 1987 have prepared cascade graphs based on power curves in each gear. This can and does give rise tochanging gears at different rpms to hit best torque in each gear.
I attach a pic showing bhp/torque against mph. This can be converted to rpms in each gear. Quite often don't need to rev so high to change into higher gears.

Peter
The guys who have done best in terms of championships with our heads/engines/dynoing since 1987 have prepared cascade graphs based on power curves in each gear. This can and does give rise tochanging gears at different rpms to hit best torque in each gear.
I attach a pic showing bhp/torque against mph. This can be converted to rpms in each gear. Quite often don't need to rev so high to change into higher gears.
Peter
ivanhoew said:
a few different chassis dyno runs ,at different places ..
Phew. Lots of data. Struggling through it all though it doesn't appear to be a million miles out from the simulation prediction of 213 bhp at 19psi.Losses in Mini engines are actually quite high with the drop gears but of course you won't necessarily see those on the overrun on a chassis dyno when the engine isn't producing power. I've factored those in when I said 180 ish wheel bhp.
PeterBurgess said:
Hi Stevie
The guys who have done best in terms of championships with our heads/engines/dynoing since 1987 have prepared cascade graphs based on power curves in each gear. This can and does give rise tochanging gears at different rpms to hit best torque in each gear.
I attach a pic showing bhp/torque against mph. This can be converted to rpms in each gear. Quite often don't need to rev so high to change into higher gears.
Peter
I'm not sure what you think you're graphing there but it's complete bThe guys who have done best in terms of championships with our heads/engines/dynoing since 1987 have prepared cascade graphs based on power curves in each gear. This can and does give rise tochanging gears at different rpms to hit best torque in each gear.
I attach a pic showing bhp/torque against mph. This can be converted to rpms in each gear. Quite often don't need to rev so high to change into higher gears.
Peter
 ks. The power and torque should be the same in each gear obviously. The engine doesn't change when the gears change.
Hi Stan
Have you got a way of overlapping torque and bhp in each gear too? Ours may look odd but is what is measured on inertia dyno in gears displaying from 2000 rpm in each gear then just graphed as mph, it helps our drivers choose gear change points. Every little bit helps win championships doesn't it? We can't afford to rest on our laurels, we earn our living 'gunfighting' on the circuits every year since 1987!
Peter
Stan Weiss said:
Steve,
OK, it is hard to simulate this run. Using no roll out I get
60 Foot ET = 3.0525
330 Foot ET = 6.7346
1/8 Mile ET = 9.5686
1/8 Mile MPH = 86.9256
1000 Foot ET = 12.0068
1/4 Mile ET = 14.0533
1/4 Mile MPH = 110.8472
using around 242 RWHP
Stan
OK, it is hard to simulate this run. Using no roll out I get
60 Foot ET = 3.0525
330 Foot ET = 6.7346
1/8 Mile ET = 9.5686
1/8 Mile MPH = 86.9256
1000 Foot ET = 12.0068
1/4 Mile ET = 14.0533
1/4 Mile MPH = 110.8472
using around 242 RWHP
Stan
Pumaracing said:
OK, I've had another crack at it after a night's sleep. It was quite tricky. I think there was a bit of wheel spin off the line which means the track grip and 60 ft ET is not really quite as bad as it looks so I've factored that in. I still can't quite agree the 1/8 mile speed but the rest has matched quite nicely.
60 Foot ET 2.83
330 Foot ET 6.65
1/8 Mile ET 9.56
1/8 Mile MPH 87.2mph
1000 Foot ET 11.99
1/4 Mile ET 14.03
1/4 Mile MPH 111.7mph
Flywheel bhp is 340. Wheel bhp is 289.
Apologies for not responding sooner.60 Foot ET 2.83
330 Foot ET 6.65
1/8 Mile ET 9.56
1/8 Mile MPH 87.2mph
1000 Foot ET 11.99
1/4 Mile ET 14.03
1/4 Mile MPH 111.7mph
Flywheel bhp is 340. Wheel bhp is 289.
The data was derived from GPS, so not that great really, and the run was done on the road so the traction is not so good and it it quite tricky to get off the line.
It makes 237 RWHP 280 Fly on a DynoJet dyno.
stevesingo said:
Apologies for not responding sooner.
The data was derived from GPS, so not that great really, and the run was done on the road so the traction is not so good and it it quite tricky to get off the line.
It makes 237 RWHP 280 Fly on a DynoJet dyno.
Hmmmpf. Now he tells us. That's why the data looked so bad and the speeds were too fast for the times. If you really have about 280 bhp then you'd struggle to hit 104 mph in the 1/4 on a proper flat track. The data was derived from GPS, so not that great really, and the run was done on the road so the traction is not so good and it it quite tricky to get off the line.
It makes 237 RWHP 280 Fly on a DynoJet dyno.
stevieturbo said:
But often a lazier run can still yield good trap speeds, sometimes higher over that same fixed distance. But it will take longer. ie more time on track to achieve a speed.
This doesn't make any sense at all from a physics perspective. You can only spend more time on the track by going slower on average.However, the first few feet of track are not that important in terms of the terminal velocity at the 1/4 mile. Think about it this way. If you mess up the launch or deliberately take it easy what you've effectively done is lost a few yards at the "end" of the track in which to accelerate. But acceleration rate at the end of the track is very low so not much speed is being added there so it is of little detriment to terminal speed.
Think about it a second way. You dump the clutch too hard at the start and just sit there for 2 seconds burning rubber going nowhere. Then you lift off a touch, grip, and do a completely normal run from then on. Your ET will be 2 seconds slower than usual but your terminal speed will be the same as any other proper run. The time you wasted didn't use up any track distance.
So no, you can never reach a higher terminal speed by deliberately going slowly somewhere but you won't hurt trap speed much by being a tad slow off the line. However you can NEVER increase trap speed doing that.
Pumaracing said:
Phew. Lots of data. Struggling through it all though it doesn't appear to be a million miles out from the simulation prediction of 213 bhp at 19psi.
Losses in Mini engines are actually quite high with the drop gears but of course you won't necessarily see those on the overrun on a chassis dyno when the engine isn't producing power. I've factored those in when I said 180 ish wheel bhp.
i wonder if you could do me 3 sims dave, Losses in Mini engines are actually quite high with the drop gears but of course you won't necessarily see those on the overrun on a chassis dyno when the engine isn't producing power. I've factored those in when I said 180 ish wheel bhp.
1) 1/4 mile with some yokos and a lsd ...eg decent grip/launch , say a 1.9 60 ft ?
2)max power top speed with the right gearing , i can run down to a 2.95 diff .
3) top speed with present 3.1 gearing and 117 bhp at wheels , my normal rd 5psi setting.
muchas gracias ,
robert.
PeterBurgess said:
Hi Stevie
The guys who have done best in terms of championships with our heads/engines/dynoing since 1987 have prepared cascade graphs based on power curves in each gear. This can and does give rise tochanging gears at different rpms to hit best torque in each gear.
I attach a pic showing bhp/torque against mph. This can be converted to rpms in each gear. Quite often don't need to rev so high to change into higher gears.
Peter
PeterBurgess said:
Hi Stan
Have you got a way of overlapping torque and bhp in each gear too? Ours may look odd but is what is measured on inertia dyno in gears displaying from 2000 rpm in each gear then just graphed as mph, it helps our drivers choose gear change points. Every little bit helps win championships doesn't it? We can't afford to rest on our laurels, we earn our living 'gunfighting' on the circuits every year since 1987!
Peter
Peter,Have you got a way of overlapping torque and bhp in each gear too? Ours may look odd but is what is measured on inertia dyno in gears displaying from 2000 rpm in each gear then just graphed as mph, it helps our drivers choose gear change points. Every little bit helps win championships doesn't it? We can't afford to rest on our laurels, we earn our living 'gunfighting' on the circuits every year since 1987!
Peter
Do you have a graph of that vehicle's HP and torque in the transmissions 1:1 gear? Also what were the vehicle's transmission gear ratios?
Stan
stevesingo said:
Apologies for not responding sooner.
The data was derived from GPS, so not that great really, and the run was done on the road so the traction is not so good and it it quite tricky to get off the line.
It makes 237 RWHP 280 Fly on a DynoJet dyno.
Steve,The data was derived from GPS, so not that great really, and the run was done on the road so the traction is not so good and it it quite tricky to get off the line.
It makes 237 RWHP 280 Fly on a DynoJet dyno.
If that run had been done on a proper drag strip where you had some roll out (I used 11.75 inches) I get the following still using my 242 HP.
60 Foot ET = 2.6765
330 Foot ET = 6.3456
1/8 Mile ET = 9.1775
1/8 Mile MPH = 86.9702
1000 Foot ET = 11.6147
1/4 Mile ET = 13.6606
1/4 Mile MPH = 110.8751
Stan
Peter,
I could not find the transmission gear ratios for an MGB so I just generated 4 evenly spaced ones. I have looked at this am not sure how that was done. If you are trying to use that to come up with a starting point of where to shift then I do this. I graph wheel torque against mph and rpm against mph. I overlap them and draw lines where the wheel torque from one gear crosses the next gear. Note the tire size and rear gear ratio really do not matter (they just change the wheel torque number on the side of the graph) it is just the transmission ratios that count.
Stan
Hi Stan
I am not sure if one has an engine dyno plot one can then translate the plot to what it would be in each gear. From what I am finding the gearboxes have a dramatic effect on power delivery at the wheels in each gear. I think the situation is very complex. I can see why inertia testing with coastdowns is best done in direct top 1:1. I am hoping we are up and running with the SF901 in a couple of months so we can see if there is any relationship between wheel power and flywheel power, it has been a real eye opener commissioning the dyno. The real world is pretty hard! The spare unit we have has only been used for storage so we have to prepare it to comply with healthy and safety requirements, not a simple task! Full rewire, complete overhaul of toilet etc etc
Peter
Gassing Station | Engines & Drivetrain | Top of Page | What's New | My Stuff