F-type V6 S BHP
Discussion


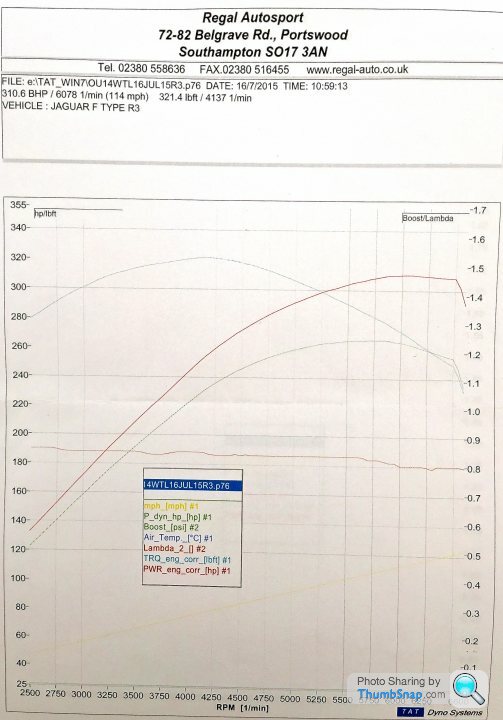
The rwhp numbers very close to what 4.2 (400bhp) engines deliver on these type of dynos, so nothing odd there imo.
The bhp figures are just an estimate, so not something you can use to compare it to the advertised bhp.
Even the last V6 dyno with about 30 rwhp less is then close.
The bhp figures are just an estimate, so not something you can use to compare it to the advertised bhp.
Even the last V6 dyno with about 30 rwhp less is then close.
Edited by avos on Saturday 18th July 13:01
jamieduff1981 said:
At the risk of stating the obvious, it could be the rolling road that's out by a country mile. They're very inaccurate at the best of times, but some are much worse than others.
Of course that could be a possibility, but they do seem to get other manufacturers cars spot on. So why would the Jag be any different. I'm sure we shall here from Jaguar very soon.Its not the rolling road as on my car there has been less than 2 bhp difference between two rolling road tests. All the parameters are the same for both cars and I hardly think both companies would spend many thousands £'s investing in a rolling road that is going to be so vastly out, do you? No, something is amiss and we aim to find out what it is.
My car is at MIRA on Monday so that is the benchmark testing facility so will be very interesting to see what that produces. I'll want a very technical explanation, rest assured.
My car is at MIRA on Monday so that is the benchmark testing facility so will be very interesting to see what that produces. I'll want a very technical explanation, rest assured.
At least that graph is a sensible shape, unlike your last one.
Your original graph breaks down at about 6000 revs whereas this one is just unexciting above 6000. Interestingly the line I'm assuming the guestimated crack BHP line doesn't seem to follow the line I'm assuming is the rear wheel measurement (that one they can measure, the other can only be guessed at) above 6K, weird. Interestingly the lambda line on this one seems flattish, which I presume is what they are supposed to be, whereas Dolittle's lambda line goes spla at roughly the point the power & torque measurements bomb.
I wish manufactures were forced to publish rear wheel power rating rather than the totally useless crank figures. Since no one can actually measure the crack figures for an engine in the car and so no one can verify the claims. Also, the crank figure is totally useless to you. You can't use the power till it pops out of the wheels and hits the road, so talking about crank figures is just pissing in the wind. They don't mean anything to anyone. Thrust is what you actually need to know, that is how fast you are going to be able to accelerate.
a8hex said:
At least that graph is a sensible shape, unlike your last one.
Your original graph breaks down at about 6000 revs whereas this one is just unexciting above 6000. Interestingly the line I'm assuming the guestimated crack BHP line doesn't seem to follow the line I'm assuming is the rear wheel measurement (that one they can measure, the other can only be guessed at) above 6K, weird. Interestingly the lambda line on this one seems flattish, which I presume is what they are supposed to be, whereas Dolittle's lambda line goes spla at roughly the point the power & torque measurements bomb.
I wish manufactures were forced to publish rear wheel power rating rather than the totally useless crank figures. Since no one can actually measure the crack figures for an engine in the car and so no one can verify the claims. Also, the crank figure is totally useless to you. You can't use the power till it pops out of the wheels and hits the road, so talking about crank figures is just pissing in the wind. They don't mean anything to anyone. Thrust is what you actually need to know, that is how fast you are going to be able to accelerate.
The measured torque, calculated horsepower and estimate flywheel horsepower all appear to be the same shape, although the calculated figure suggests a degree of optimism. Of more concern is the shape of the measured torque curve: it should be a tabletop from 3,500-5,000rpm. This one suggests that either they were failing to use full throttle, the engine was having heat soak problems, or that there is a boost leak at the bypass valve.Your original graph breaks down at about 6000 revs whereas this one is just unexciting above 6000. Interestingly the line I'm assuming the guestimated crack BHP line doesn't seem to follow the line I'm assuming is the rear wheel measurement (that one they can measure, the other can only be guessed at) above 6K, weird. Interestingly the lambda line on this one seems flattish, which I presume is what they are supposed to be, whereas Dolittle's lambda line goes spla at roughly the point the power & torque measurements bomb.
I wish manufactures were forced to publish rear wheel power rating rather than the totally useless crank figures. Since no one can actually measure the crack figures for an engine in the car and so no one can verify the claims. Also, the crank figure is totally useless to you. You can't use the power till it pops out of the wheels and hits the road, so talking about crank figures is just pissing in the wind. They don't mean anything to anyone. Thrust is what you actually need to know, that is how fast you are going to be able to accelerate.
Rear wheel power is dependent on the gear used...
ftypical said:
a8hex said:
At least that graph is a sensible shape, unlike your last one.
Your original graph breaks down at about 6000 revs whereas this one is just unexciting above 6000. Interestingly the line I'm assuming the guestimated crack BHP line doesn't seem to follow the line I'm assuming is the rear wheel measurement (that one they can measure, the other can only be guessed at) above 6K, weird. Interestingly the lambda line on this one seems flattish, which I presume is what they are supposed to be, whereas Dolittle's lambda line goes spla at roughly the point the power & torque measurements bomb.
I wish manufactures were forced to publish rear wheel power rating rather than the totally useless crank figures. Since no one can actually measure the crack figures for an engine in the car and so no one can verify the claims. Also, the crank figure is totally useless to you. You can't use the power till it pops out of the wheels and hits the road, so talking about crank figures is just pissing in the wind. They don't mean anything to anyone. Thrust is what you actually need to know, that is how fast you are going to be able to accelerate.
The measured torque, calculated horsepower and estimate flywheel horsepower all appear to be the same shape, although the calculated figure suggests a degree of optimism. Of more concern is the shape of the measured torque curve: it should be a tabletop from 3,500-5,000rpm. This one suggests that either they were failing to use full throttle, the engine was having heat soak problems, or that there is a boost leak at the bypass valve.Your original graph breaks down at about 6000 revs whereas this one is just unexciting above 6000. Interestingly the line I'm assuming the guestimated crack BHP line doesn't seem to follow the line I'm assuming is the rear wheel measurement (that one they can measure, the other can only be guessed at) above 6K, weird. Interestingly the lambda line on this one seems flattish, which I presume is what they are supposed to be, whereas Dolittle's lambda line goes spla at roughly the point the power & torque measurements bomb.
I wish manufactures were forced to publish rear wheel power rating rather than the totally useless crank figures. Since no one can actually measure the crack figures for an engine in the car and so no one can verify the claims. Also, the crank figure is totally useless to you. You can't use the power till it pops out of the wheels and hits the road, so talking about crank figures is just pissing in the wind. They don't mean anything to anyone. Thrust is what you actually need to know, that is how fast you are going to be able to accelerate.
Rear wheel power is dependent on the gear used...
The thing that intrigued me was if zoom in on the graph at look closely at the calculated rear wheel BHP figure and compare it with the guestimated crank "headline" figure the 2 graphs don't follow each other over 6K. The peak on the rw figure is at about 5850RPM after which it has a noticeable drop off before the nose dive at the end, roughly 265 down to 235, 9%. The guestimated figure on the other hand continues to go up peaking at just over 6K and then remaining much flatter than the rw figure. There is a significant difference in the slope there. Which implies that their guestimation algorithm assumes that power losses decrease with speed, is that right anyone? I'd have thought they were more likely to increase, am I missing something there?
Here you already see how odd the engine hp calculation is?
For the V6S ones, they used a drivetrain loss of about 12 to 13%, and with this v8S suddenly 15%. If you would use a % it would probably go down more with more rwhp, not the other way around.
430 rwhp on this type of dyno is high mio, but as there is no SAE or DIN correction factor mentioned for all of the dynos, it is hard to compare/interpret the rwhp numbers shown
Next to that, I though that the V8s at least would redline at 6500 rpm or so, which makes these dyno slips even harder to understand...
Anyway, am curious of what Jaguar has to say.
I'm sure you chaps are more technically minded than me or Pete so I'll let you baffle me with science! I understand a bit about what you are saying but without Regal commenting on the process and method / why's and wherefore's, I couldn't comment on it myself. All I know is that its all a bit odd!
I'm sure you did, BUT when the v6s was done was it:
A) in dynamic mode
B) in sports mode
Both the above to access the high revs properly - if not it'll simply change gear too early. Sports mode + dynamic mode together in auto will let you.
C) was the exhaust activated (surely must make it more free flowing as these cars ECUs monitor settings and adapt all the time)
D) was traction control turned off?
Edited by elementad on Tuesday 21st July 19:53
Hi Avos,
I guess you're much more used to reading these graphs than me, I've really just been looking for anomalies in the graphs. Do you know how to interpret the lambda line? I'm not sure which way is lean and rich.
Anyway, this graph like the first pair for V6S cars doesn't make sense at the top end. Jaguar are quoting peak power at 6500, at about 5800 the lambda line goes gaga. From 2500 up to there it's a beautiful straight line (with enough noise on it to show someone is actually measuring something) which it really should be, get far off that line you aren't going to be making much power, go too lean and it will roast the cats in no time.
Interestingly the rw line and the guestimate crank (gc) like diverge again, peak at the wheels is at 6K as near as damn it, but the gc figure keeps going up again! Torque and therefore both the power curves which are calculated from there (power bhp = (rpm x torque) / 5252), nose dives once the lambda figure goes haywire, which is only to be expected.
The torque figure looks like it's about 485ftlb, so 655Nm which is pretty healthy considering Jaguar are quoting 680 (I guess they aimed at 500ftlb) at the crank, a loss of less that 4%, but then I'll admit I've no idea what typical losses in torque are.
Dolittle said:
Today I put my V8 S on the same rolling road, Jags figures are about 488BHP My car achieved 506 BHP.
You would think that Jaguar use the same method to determine the V6 cars and the V8's power, so something is not right at all.
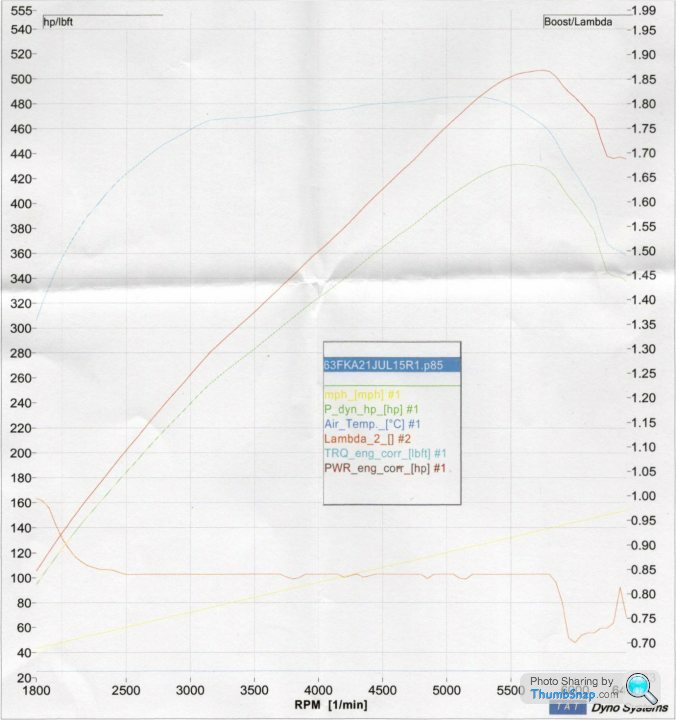
That peaks too early, and the torque curve should - literally - be a table top. That it isn't says the engine isn't giving everything it should. You would think that Jaguar use the same method to determine the V6 cars and the V8's power, so something is not right at all.
So. Heat soak?
The torque curve is also a guestimate on the dyno slip, and I have not yet seen dynos where it (almost progressively) goes up like in the v8s one shown, so the guestimated drive-train loss (engine hp/trq curves) is off obviously.
One way to explain why the rpm is off (not saying it is here, we just do not know enough about the runs) is the way the rpm is aligned/measured. At least for the (much) older boxes (am not familiar with the 8 speed one), there is no clutch converter lock-up at full power. So if the dyno operator checks the rpm by running for instance at 4 or 5000 rpm steady, and would lock this in the software, it would go wrong as with steady driving the converter does lock-up. Now under full power the actual rpm measured from the wheel speed is then of course lower.
But as said there is just to little info available to seriously judge the dyno slips.
elementad said:
I'm sure you did, BUT when the v6s was done was it:
A) in dynamic mode
B) in sports mode
Both the above to access the high revs properly - if not it'll simply change gear too early. Sports mode + dynamic mode together in auto will let you.
C) was the exhaust activated (surely must make it more free flowing as these cars ECUs monitor settings and adapt all the time)
D) was traction control turned off?
YesA) in dynamic mode
B) in sports mode
Both the above to access the high revs properly - if not it'll simply change gear too early. Sports mode + dynamic mode together in auto will let you.
C) was the exhaust activated (surely must make it more free flowing as these cars ECUs monitor settings and adapt all the time)
D) was traction control turned off?
Edited by elementad on Tuesday 21st July 19:53
Yes
Yes
&
Yes
The End
avos said:
One way to explain why the rpm is off (not saying it is here, we just do not know enough about the runs) is the way the rpm is aligned/measured.
I'd have thought that the RPM was the easiest bit to measure with an extremely high degree of accuracy. Even when I watched someone put my XK150 on a dyno they hooked the machine up to the ignition to get an RPM figure. Possibly not so easy on a modern engine, but surely there must be somewhere to accurately read it off. That was the one value I'd been fairly confident of, it's a nice electronic thing.Gassing Station | Jaguar | Top of Page | What's New | My Stuff