F-type V6 S BHP
Discussion


None of these dyno slips in here tally up for the reasons given above. The correction logarithms seem to be using an odd random regression.
Get a few V6S cars together, run them all and see what happens. Pref on a hub dyno.
When we used to build engines the change in humidity (from morning to evening) in a none environment controlled dyno chamber (Engine on bench) could give a shift in crank bhp of 5%. (Which would be 19bhp on a V6S, and thats only one variable, let along the hundreds you get from tasting cars on different days)
avos said:
Here you already see how odd the engine hp calculation is?
For the V6S ones, they used a drivetrain loss of about 12 to 13%, and with this v8S suddenly 15%. If you would use a % it would probably go down more with more rwhp, not the other way around.
430 rwhp on this type of dyno is high mio, but as there is no SAE or DIN correction factor mentioned for all of the dynos, it is hard to compare/interpret the rwhp numbers shown
Next to that, I though that the V8s at least would redline at 6500 rpm or so, which makes these dyno slips even harder to understand...
Anyway, am curious of what Jaguar has to say.
Its also be nice to have air pressure, air temp, inlet temp, gear and tyre pressure logged. There's a lot of grey area in all of this! For the V6S ones, they used a drivetrain loss of about 12 to 13%, and with this v8S suddenly 15%. If you would use a % it would probably go down more with more rwhp, not the other way around.
430 rwhp on this type of dyno is high mio, but as there is no SAE or DIN correction factor mentioned for all of the dynos, it is hard to compare/interpret the rwhp numbers shown
Next to that, I though that the V8s at least would redline at 6500 rpm or so, which makes these dyno slips even harder to understand...
Anyway, am curious of what Jaguar has to say.
avos said:
The torque curve is also a guestimate on the dyno slip, and I have not yet seen dynos where it (almost progressively) goes up like in the v8s one shown, so the guestimated drive-train loss (engine hp/trq curves) is off obviously.
One way to explain why the rpm is off (not saying it is here, we just do not know enough about the runs) is the way the rpm is aligned/measured. At least for the (much) older boxes (am not familiar with the 8 speed one), there is no clutch converter lock-up at full power. So if the dyno operator checks the rpm by running for instance at 4 or 5000 rpm steady, and would lock this in the software, it would go wrong as with steady driving the converter does lock-up. Now under full power the actual rpm measured from the wheel speed is then of course lower.
But as said there is just to little info available to seriously judge the dyno slips.
The torque curve is what the dyne actually measures, so while the dyno may be reading low or high it will get the shape right unless there's a technical problem. One way to explain why the rpm is off (not saying it is here, we just do not know enough about the runs) is the way the rpm is aligned/measured. At least for the (much) older boxes (am not familiar with the 8 speed one), there is no clutch converter lock-up at full power. So if the dyno operator checks the rpm by running for instance at 4 or 5000 rpm steady, and would lock this in the software, it would go wrong as with steady driving the converter does lock-up. Now under full power the actual rpm measured from the wheel speed is then of course lower.
But as said there is just to little info available to seriously judge the dyno slips.
While I agree that the torque curve is very flat, it ought to be absolutely horizontal if it's being limited by the engine ECU. If there were no limitation - this being a supercharged engine - I would expect to see a bell shape. This suggests the ECU has backed of a bit to a 'softer' map.
Thoughts?
ftypical said:
The torque curve is what the dyne actually measures, so while the dyno may be reading low or high it will get the shape right unless there's a technical problem.
The problem here is that the actual torque values measured are not shown, what you see already contains the (wrong) drive train losses and possibly a sea or din correction. The only actual measured figures you see in the graphs are the rwhp numbers (with or without sae or din corrections).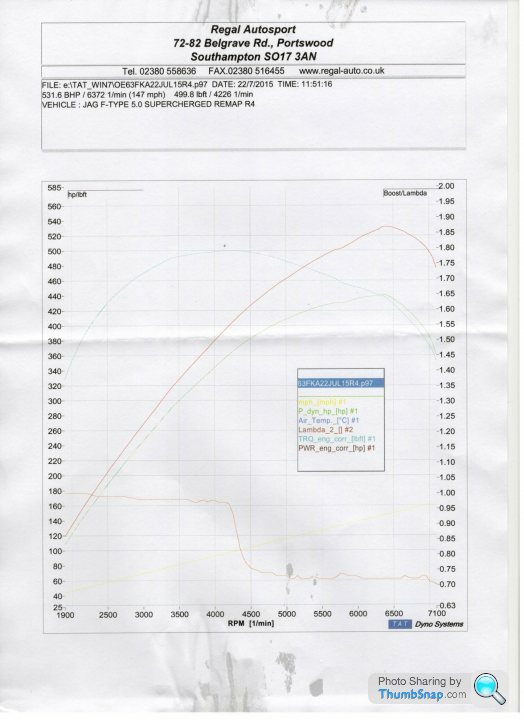
OK, I'm not sure why I'd assumed that the torque curve was a measured one.
Calculating back from the rw bhp the torque curve is still not quite flat. Eyeballing from the graph isn't the way to do things, but it look like it's about 420ftlb @ 3000 rising to about 426 @4000 before dropping down to about 400 @ 5500. So the displayed torque curve is the wrong shape.
Calculating back from the rw bhp the torque curve is still not quite flat. Eyeballing from the graph isn't the way to do things, but it look like it's about 420ftlb @ 3000 rising to about 426 @4000 before dropping down to about 400 @ 5500. So the displayed torque curve is the wrong shape.
a8hex said:
OK, I'm not sure why I'd assumed that the torque curve was a measured one.
Calculating back from the rw bhp the torque curve is still not quite flat. Eyeballing from the graph isn't the way to do things, but it look like it's about 420ftlb @ 3000 rising to about 426 @4000 before dropping down to about 400 @ 5500. So the displayed torque curve is the wrong shape.
I really wish I understood what you are saying. I guess I need to read up on this subject!Calculating back from the rw bhp the torque curve is still not quite flat. Eyeballing from the graph isn't the way to do things, but it look like it's about 420ftlb @ 3000 rising to about 426 @4000 before dropping down to about 400 @ 5500. So the displayed torque curve is the wrong shape.
The power and torque figures are related by a simple sum.
power = ( torque * rpm ) / 5252
torque = ( power * 5252 ) / rpm
Given one graph you can easily workout the other one.
The result of working out the torque curve from the rear wheel BHP figure doesn't give the same shape as the torque curve on the graph. Therefore someone is buggering around with it.
The question is whether the buggering around they are doing is correct.
I don't know, but the results it's giving are counter intuitive, at least to me they are.
a8hex said:
The question is whether the buggering around they are doing is correct.
I don't know, but the results it's giving are counter intuitive, at least to me they are.
Ok I'm being an idiot here.I don't know, but the results it's giving are counter intuitive, at least to me they are.
If the losses increase with engine speed, then you would expect the difference between measured rw numbers and the shown crank numbers to increase.
Sorry
Turkish91 said:
Interested to see where this goes... I'm leaning towards the dyno being not quite right.
Another V6s has been on a totally different companies rolling road today with similar results, Im sure those details will be up here soon. So that will be three seperate rolling roads used to date, with the same results so I doubt its the dyno.I agree there could be some fudging of the figures at Jag's end when doing all their dyno tests, no doubt done in the depths of winter under perfect conditions. Look at the B7 RS4... Weren't they claimed to have 420 fly HP and when people tested them they were only producing 380, 390 or 400 if you were really lucky?
My view is trade it in and get the V8 instead
My view is trade it in and get the V8 instead
Or is there some reason why it just won't give full performance when on a dyno rig rather than out on the road. All sort of air flow and thermal characteristics are going to be different. If that's the case an explanation would be nice to see.
Dolittle's plot on page 1 goes off tune at about 5300 and weird at 6300.
ewolg's plot again on page 1 doesn't have the lambda line, but the power peak is 500RPM below where the brochure says it should be.
ewolg's loaner's plot on page 3 looks a little bit healthier, lambda is flat and the peak is at the top for the headline figure, the rw one peaks a little early though.
Dolittle's V8 on page 3 goes off tune at 5700.
Dolittle's V8 on page 4 has a step down on the lambda at 4400 followed by a loss of torque just afterwards.
Shouldn't lambda be 0.86 for max power?
IIRC it tend to need to be slightly richer though to avoid temperature problems in cats.
a8hex said:
OK, I'm not sure why I'd assumed that the torque curve was a measured one.
Calculating back from the rw bhp the torque curve is still not quite flat. Eyeballing from the graph isn't the way to do things, but it look like it's about 420ftlb @ 3000 rising to about 426 @4000 before dropping down to about 400 @ 5500. So the displayed torque curve is the wrong shape.
Good. Now we're reading from the same song sheet... Calculating back from the rw bhp the torque curve is still not quite flat. Eyeballing from the graph isn't the way to do things, but it look like it's about 420ftlb @ 3000 rising to about 426 @4000 before dropping down to about 400 @ 5500. So the displayed torque curve is the wrong shape.

I think I already have an idea bout the big differences in drivetrain losses shown on the dyno slips, which reminds me again on why I dislike these 2 small drums per wheel dynos...
There is much more tire drag on these dynos, and then speed, the way the car is strapped to the dyno and of course tire pressure play a very big role in the measure rwhp figure.
I think that is probably the main reason, why on these dyno types, a coast down measurement will be taken, as that will decrease the variations from the mentioned influences.
However that can also mean that for instance the 2nd V8S measurement was taken either at a higher speed (different gear) or softer tires, or different way on how the car was strapped down, the actual rwhp is lower due to the extra drag, and compensated again with the coast down method resulting in a higher estimated engine hp figure.
What I dislike about a coast down method, is that you only measure the inertia power of the drive train components, and not the full power/friction losses. But considering these small drums per wheel dynos, for these its important to do the coast down, to take out the losses as mentioned.
But then you can't compare rwhp figures with other dynos and you only have an estimated engine hp figure, so my comments about the drivetrain loses are not relevant anymore, as these are not actual road drive train losses. I guess Jaguar will have some experience with these dynos and know the actual engine power, so am very curious as to what they have to say.
Personally I prefer the dynos with 1 large drum per wheel (are usually more expensive as they require a bigger hole in the ground), these will give a more realistic rwhp figure (so what you actually get down on the street), especially the ones that also have a brake to apply force on the drums (like some mustang dynos for instance) to give a more realistic figure.
Here is a nice article that shows the effect of tires on drums:
http://www.land-and-sea.com/dyno-tech-talk/roll_di...
So when is Jaguar going to comment?
Managed to check up the SAE standard that Jaguar is most likely using to derive its brochure bhp numbers . I measures gross power without any anciliaries such as water pump, steering pump, alternator, transmission, muffled exhaust system etc. Not surprisinly this gives a higher power rating than the din method but thats what you want for adverts.
It will be interesting to see whether there is a real engineering problem or its simply a difference in standards.
It will be interesting to see whether there is a real engineering problem or its simply a difference in standards.
I thought Jaguar had switched from the SAE to DIN back in the 70s which is why the quoted figures for the 4.2 XK engine dropped when they'd just fitted bigger valves and other improvements.
This is from the 2001 XKR brochure, sorry I can't find anything newer at the moment.
http://www.jag-lovers.org/brochures/xk8/xk2001s_p2...
It shows engine performance data as DIN.
I suspect that in Europe that is what manufacturers have to quote.
This is from the 2001 XKR brochure, sorry I can't find anything newer at the moment.
http://www.jag-lovers.org/brochures/xk8/xk2001s_p2...
It shows engine performance data as DIN.
I suspect that in Europe that is what manufacturers have to quote.
Gassing Station | Jaguar | Top of Page | What's New | My Stuff