Discussion


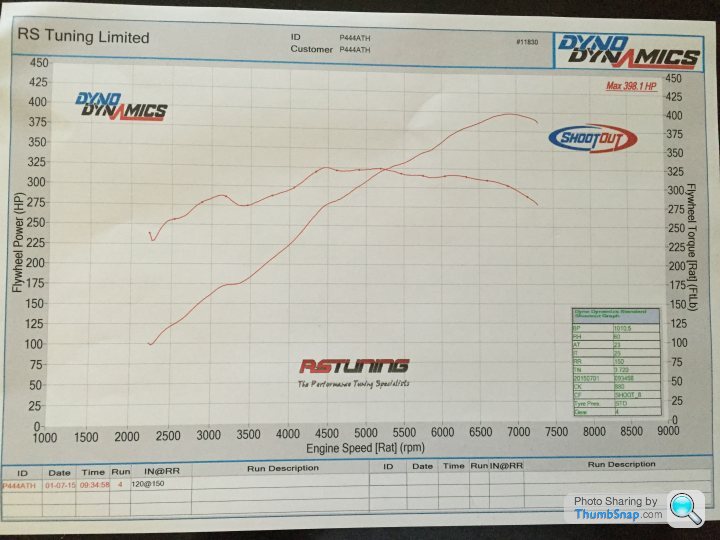
My car had previously been dynoed at 370HP before modifications. Since then myself and the previous owner have replaced the air intakes, manifolds, cats (200 cell), back box, and custom map. Work was done by DAE and both Dyno runs were on different independent dynos. Ideally it would have been the same Dyno on the same day, and today was particularly hot which probably didn't help. In any case I was pleased with an additional 28HP. Video below
http://youtu.be/iUPHpsQ4aB0
I also added some stickers for the GP this weekend - anyone else going to silverstone?

Andy
http://youtu.be/iUPHpsQ4aB0
I also added some stickers for the GP this weekend - anyone else going to silverstone?
Andy
nice wheels!
Something is very odd about your dyno result indeed.
Regardless of what the environment is doing, correction factors were created by the men in white suits to normalise all results across the globe no matter if below sea level and 15 degrees or in Denver at +30.
if i interpret the data in the corner of your graph correctly it indicates that regardless of being a hot day, the ambient air temp was below the ISO1585 reference of 25 degrees @ 23 degrees, meaning in actual fact relative to the environment your test was performed cooler than the standard, therefore the engine would be producing more power against the standard (what the factory flywheel power is rated at) and the correction factor would need to reduce recorded power to return a normalised result. The relative humidity of your test was a bit damp @ 60% so a very small amount of power would need to be added in this respect over actual recorded to return the result back to normalised. Finally the ambient pressure was slightly higher than the standard so engine producing more power than the normalised condition and needs power taking off actual recorded to return normalised result. The correction factor for the data you supply should have been 0.992 meaning for instance if the actual recorded power was 400BHP, normalised to the industry standard the figure should really be 396.8BHP.
Also odd is that despite free flowing manifolds, cats and ECU remap the power curve has plateau @ 6750 rpm where it should be still rising at the same gradient until 7500 rpm, so looking at your graph and drawing a straight line, the figure at 7500 rpm should have been 425, but also a bit odd, the test stops at 7300 rpm?
odd results and odd looking power curve shape indeed
I'm attaching the graph for ease of reference here.
Mike your observations are interesting, and thank you for the clarity on the correction factor. I'm not sure why the test stopped where it did, certainly the limiter is higher than 6750 quite a bit. The conclusion is either they didn't run the test properly, or something is retarding power at the higher end of the revs. I may take it somewhere else for another run, certainly if it did make 425 as the graph interpolated to the redline would suggest it could, that would be nice! The wheels are Projex circuit 20s.
DB9VolanteDriver said:
Maybe I can't read a graph, but power peaks at around 6800 rpm, and extended the curves to 7000 or 7500 does not produce a higher output. So, what do you see that I don't?
That's the question, as HP should keep climbing. This was a set of dyno pulls I had done on my V8V shortly after buying it. 4.3L with AM Power Pack and 200-cell cats. 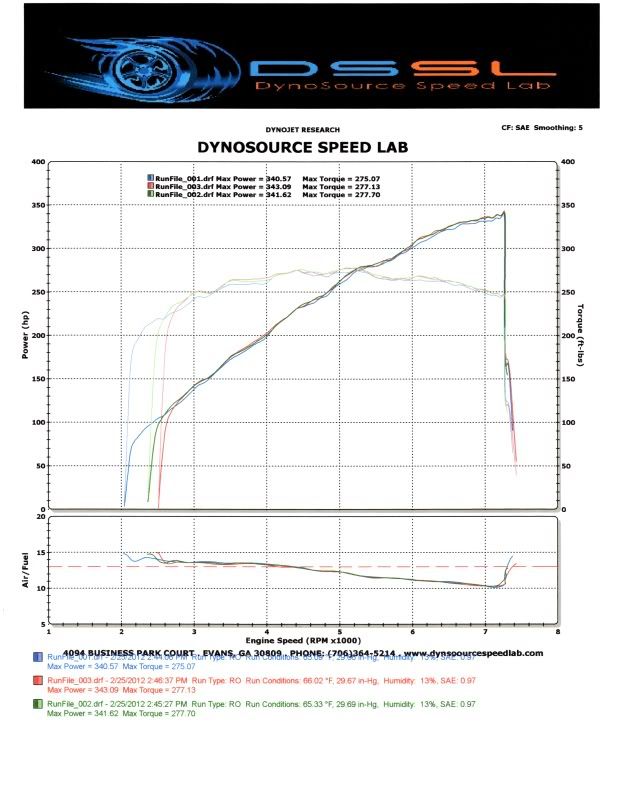
Thanks for the various responses. I've dug out the previous dyno chart below:
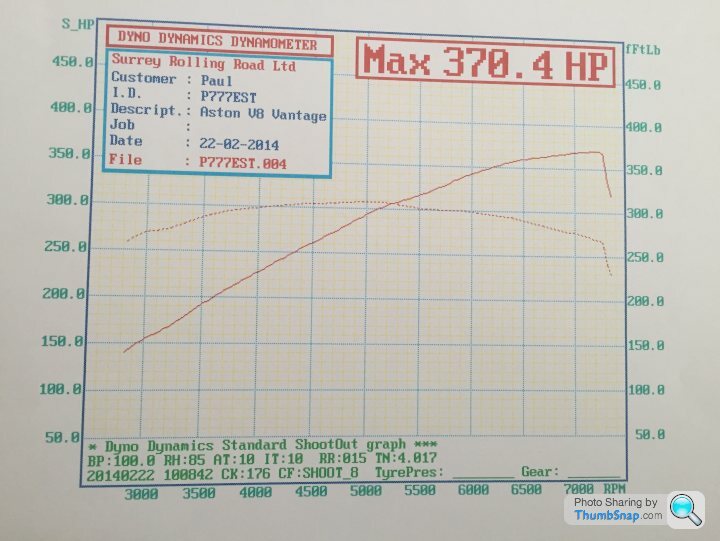
This shows a similar shaped curve to the other standard chart posted, and also shows power rising up to about 7,300 or so. Difficult to know whether it was the dyno/operator or something on the car that caused the tailing off on my more recent run. I'll probably take it to a different dyno and rerun the test.
This shows a similar shaped curve to the other standard chart posted, and also shows power rising up to about 7,300 or so. Difficult to know whether it was the dyno/operator or something on the car that caused the tailing off on my more recent run. I'll probably take it to a different dyno and rerun the test.
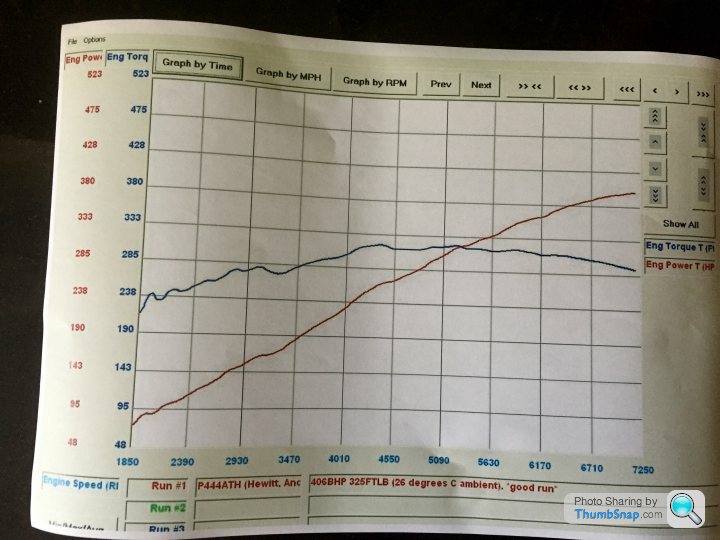
Well I ran the car on a different dyno, and frankly was very impressed by the professionalism of them explaining everything to me as they did test runs on the car and etc. Certainly felt like a more professional operation called Dreamscience in Hull. The graph is attached below. As you can see the graph continues on a similar trajectory as before but this time all the way to 7250rpm where the test was stopped. I think my limiter is at 7300. The result was 406 which is a gain of 36 above what it made before the work was done.
I'm guessing that the conclusion is that the dyno run I did before was flawed. Both times I've been running tesco momentum fuel.
I'll do a video at some point.
A
I'm guessing that the conclusion is that the dyno run I did before was flawed. Both times I've been running tesco momentum fuel.
I'll do a video at some point.
A
Gassing Station | Aston Martin | Top of Page | What's New | My Stuff