smoothing seasonal data?
Discussion


First I apologise if this is in the wrong forum, it seemed most appropriate as it is to do with statistics and hard sums like that, and I imagine scientific chaps will be into that?
My question revolves around creating a time series of house volume sold data over a number of years. I have the raw data in average volume sold per month for any defined series of years (courtesy of the Land registry site).
My hope is to be able to create a Statistical prices Chart using Minitab of the time series to indicate whether any "volume sold" changes in my city are real or just within natural variation. The problem with the data of course is that there is seasonal variation, which needs to be smoothed out I understand (The old Land Registry site provided data seasonally smoothed as a download, current site only appears to provide raw data).
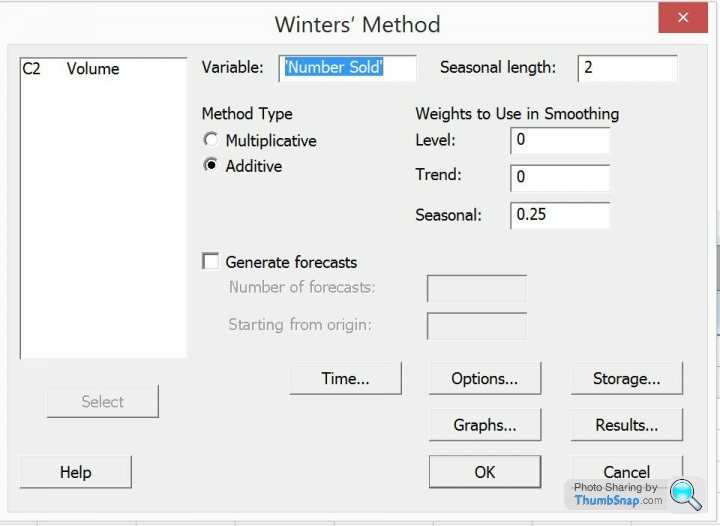
Minitab offers something called Winters method for use when data contains seasonal variation with or without a trend.
However, I'm not sure whether:
1 This is the best method within minitab?
2 There may be a better way?
3 I'm totally wrong and the data need not be smoothed for seasonal variation?
4 What to put in the "weights when using smoothing" boxes.
Please see image attached for the menu box offered when using Winters method.
Any suggestions gratefully received.
NB - this is not for a rocket science thing, just to provide an indication whether "houses sold" volumes per month are going up or down or static, in my cit which will help understand real housing demand.
Cheers in advance.
My question revolves around creating a time series of house volume sold data over a number of years. I have the raw data in average volume sold per month for any defined series of years (courtesy of the Land registry site).
My hope is to be able to create a Statistical prices Chart using Minitab of the time series to indicate whether any "volume sold" changes in my city are real or just within natural variation. The problem with the data of course is that there is seasonal variation, which needs to be smoothed out I understand (The old Land Registry site provided data seasonally smoothed as a download, current site only appears to provide raw data).
Minitab offers something called Winters method for use when data contains seasonal variation with or without a trend.
However, I'm not sure whether:
1 This is the best method within minitab?
2 There may be a better way?
3 I'm totally wrong and the data need not be smoothed for seasonal variation?
4 What to put in the "weights when using smoothing" boxes.
Please see image attached for the menu box offered when using Winters method.
Any suggestions gratefully received.
NB - this is not for a rocket science thing, just to provide an indication whether "houses sold" volumes per month are going up or down or static, in my cit which will help understand real housing demand.
Cheers in advance.
This paper may help http://labs.omniti.com/people/jesus/papers/holtwin...

Gassing Station | Science! | Top of Page | What's New | My Stuff