Car Survival Rate Analysis
Discussion


STATISTICAL ANALYSIS OF CAR SURVIVAL
This work began as a contribution to the “Everyday cars that are starting to disappear” thread, born out of frustration that, interesting though most of posts were, they were entirely subjective in nature, and a consequent desire to introduce a degree of rigour and objective measurement to the process. What was intended to be a discrete post grew to the extent that I became guilty of the heinous crime of threadjacking. I was suggested by Seek that this subject was best split out to become something that could be referenced discretely, and that I copied my posts across. My apologies for the inordinate time that it has taken me to do this, but I have become incredibly busy. In consequence, my posts are likely to become rather sporadic for at least the next two to three months: unfortunately, car statistics take second place to earning my daily crust.
I should stress at the outset that this is intended only as a thread for geeks interested in car statistics, and in detailed/lengthy analysis. As such, it will be of no interest to the majority of those on this website, so I suggest that if this is not you that you stop reading here.
This is not intended as a personal hobbyhorse, so please feel free to contribute any statistics or analysis of your own. The only thing that I would ask is that we confine this thread to car survival statistics, so if you have, for example, some fascinating analysis of car power output trends, that you start a new thread for it.
The work started off innocently enough by consulting the excellent “How Many Left” website ( https://www.howmanyleft.co.uk/), but my natural tendency to always work back towards original source data, led me to the official Government statistics on which “How Many Left” is based, this can be found at: https://www.gov.uk/government/statistical-data-sets/all-vehicles-veh01. These enable us to do some much more interesting analysis. No datasets are ever perfect; however, as with most UK Government statistics, I consider the DfT data to be of high-quality, and free from any systematic bias (the DfT state their tests indicate that approximately 2% of entries have one data field incorrectly entered). Certainly, the data is a lot better than the majority the stuff that I encounter in my day job, and requires almost no cleaning. Even better, the DfT data is available in Excel spreadsheet format, which can be imported and manipulated, readily. There are some weaknesses in the datasets, and in particular with correlating it between the different datasets required to undertake the analysis, but we will encounter these issues as we go, which are in any case fundamentally second order in nature.
While the statistics might be good, the downside of this thread will be having to put up with my idiosyncratic views (I have been accused of building an entire career based on professional cynicism). Please regard me as the ‘shock jock’ of PH, my aim is to stimulate discussion and fresh thinking: if there is one thing that I have learnt in the workplace over the past few decades it is how supposedly absolute certainties, and self-evident truths on which all else is based can be fundamentally flawed. I am here to challenge established views, and in the debate, hopefully, enlightenment for us all will appear. My commentaries are a strange conflation between the factually accurate and irrefutability impartial, and my bigoted views. I try hard to draw a stylistic distinction between the two in my writing, so hopefully the joins are clear.
In re-posting my earlier work I will updating my work to reflect the constructive comments made, this will include some changes to the cars analysed in each market segment. The principal delay in posting it will be that I have been heavily expanding and updating my work on family hatchbacks to bring it up to the standard of the other market segments analysed. In the course of this work I have found two new contenders for Britain’s worst surviving car, which are almost too close to split, and come from different continents…
As ever, there are only two types of car that are interesting: those that survive vastly better than their peers, and (far more interestingly) those with abysmal survival rates that are plunging to oblivion like a flaming grand piano off a clifftop. Everything else in the middle is just boring, although I will give each a write up. Hopefully the thread might provide some enlightenment on which used cars to avoid (masochists, and the bloody-minded excepted), and which might be stellar buys.
I must stress that just because a model line has a historically bad survival rate does not mean that modern examples will perform similarly, necessarily. I should also stress that just because Model A has a worse survival rate than Model B, it does not necessarily mean that Model A is a “worse car” than Model B. There are several possible reasons why cars cross over to the great car park in the sky:
When we get onto the serious analysis I will be disaggregating cars into the following market segments:
I look forward to hearing your feedback, and a few good debates (I am a fairly robust character, it is unlikely that you will offend me).
This work began as a contribution to the “Everyday cars that are starting to disappear” thread, born out of frustration that, interesting though most of posts were, they were entirely subjective in nature, and a consequent desire to introduce a degree of rigour and objective measurement to the process. What was intended to be a discrete post grew to the extent that I became guilty of the heinous crime of threadjacking. I was suggested by Seek that this subject was best split out to become something that could be referenced discretely, and that I copied my posts across. My apologies for the inordinate time that it has taken me to do this, but I have become incredibly busy. In consequence, my posts are likely to become rather sporadic for at least the next two to three months: unfortunately, car statistics take second place to earning my daily crust.
I should stress at the outset that this is intended only as a thread for geeks interested in car statistics, and in detailed/lengthy analysis. As such, it will be of no interest to the majority of those on this website, so I suggest that if this is not you that you stop reading here.
This is not intended as a personal hobbyhorse, so please feel free to contribute any statistics or analysis of your own. The only thing that I would ask is that we confine this thread to car survival statistics, so if you have, for example, some fascinating analysis of car power output trends, that you start a new thread for it.
The work started off innocently enough by consulting the excellent “How Many Left” website ( https://www.howmanyleft.co.uk/), but my natural tendency to always work back towards original source data, led me to the official Government statistics on which “How Many Left” is based, this can be found at: https://www.gov.uk/government/statistical-data-sets/all-vehicles-veh01. These enable us to do some much more interesting analysis. No datasets are ever perfect; however, as with most UK Government statistics, I consider the DfT data to be of high-quality, and free from any systematic bias (the DfT state their tests indicate that approximately 2% of entries have one data field incorrectly entered). Certainly, the data is a lot better than the majority the stuff that I encounter in my day job, and requires almost no cleaning. Even better, the DfT data is available in Excel spreadsheet format, which can be imported and manipulated, readily. There are some weaknesses in the datasets, and in particular with correlating it between the different datasets required to undertake the analysis, but we will encounter these issues as we go, which are in any case fundamentally second order in nature.
While the statistics might be good, the downside of this thread will be having to put up with my idiosyncratic views (I have been accused of building an entire career based on professional cynicism). Please regard me as the ‘shock jock’ of PH, my aim is to stimulate discussion and fresh thinking: if there is one thing that I have learnt in the workplace over the past few decades it is how supposedly absolute certainties, and self-evident truths on which all else is based can be fundamentally flawed. I am here to challenge established views, and in the debate, hopefully, enlightenment for us all will appear. My commentaries are a strange conflation between the factually accurate and irrefutability impartial, and my bigoted views. I try hard to draw a stylistic distinction between the two in my writing, so hopefully the joins are clear.
In re-posting my earlier work I will updating my work to reflect the constructive comments made, this will include some changes to the cars analysed in each market segment. The principal delay in posting it will be that I have been heavily expanding and updating my work on family hatchbacks to bring it up to the standard of the other market segments analysed. In the course of this work I have found two new contenders for Britain’s worst surviving car, which are almost too close to split, and come from different continents…
As ever, there are only two types of car that are interesting: those that survive vastly better than their peers, and (far more interestingly) those with abysmal survival rates that are plunging to oblivion like a flaming grand piano off a clifftop. Everything else in the middle is just boring, although I will give each a write up. Hopefully the thread might provide some enlightenment on which used cars to avoid (masochists, and the bloody-minded excepted), and which might be stellar buys.
I must stress that just because a model line has a historically bad survival rate does not mean that modern examples will perform similarly, necessarily. I should also stress that just because Model A has a worse survival rate than Model B, it does not necessarily mean that Model A is a “worse car” than Model B. There are several possible reasons why cars cross over to the great car park in the sky:
- They are not durable under UK conditions.
- Spare parts have become unavailable, or too expensive (which of course works two ways: cars are scrapped because some vital part has failed, and cars get scrapped for cannibalisation).
- Their value has dropped so low that owners are no longer prepared to spend money keeping them on the road.
- They have become unsaleable and thus are scrapped when their owners wish to change cars.
- Supply:demand economics: the car is of type for which there is insufficient demand in that part of the second-hand market (a subset of Point 4): as we will see it is small runarounds, and “interesting” cars that survive the best, while largish middle market cars survive relatively poorly as a group.
- The cars have been exported (although this might well not mean that vehicle has been scrapped, it is a reason for them disappearing from the UK registry).
When we get onto the serious analysis I will be disaggregating cars into the following market segments:
- Town Cars/Sub-Superminis
- Superminis
- Family Hatchbacks
- Family Cars
- Junior Executive Cars
- Executive Cars
- Luxury Cars
- Small People Carriers
- Large People Carriers
- Smaller SUVs
- Large SUVs
- Affordable Sports Cars
I look forward to hearing your feedback, and a few good debates (I am a fairly robust character, it is unlikely that you will offend me).
Edited by Car_Nut on Friday 31st March 00:34
This is where it all started, back on 7 January, my apologies if it repeats the introduction to this thread, my latest annotations to it are inside square brackets:
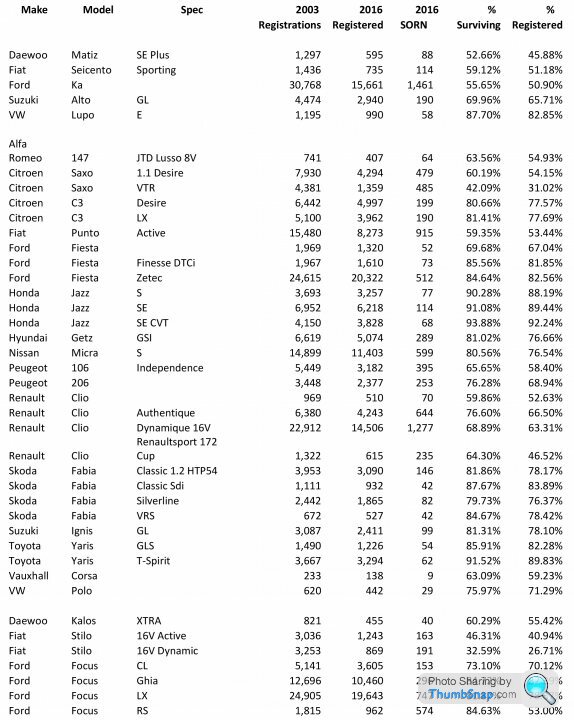
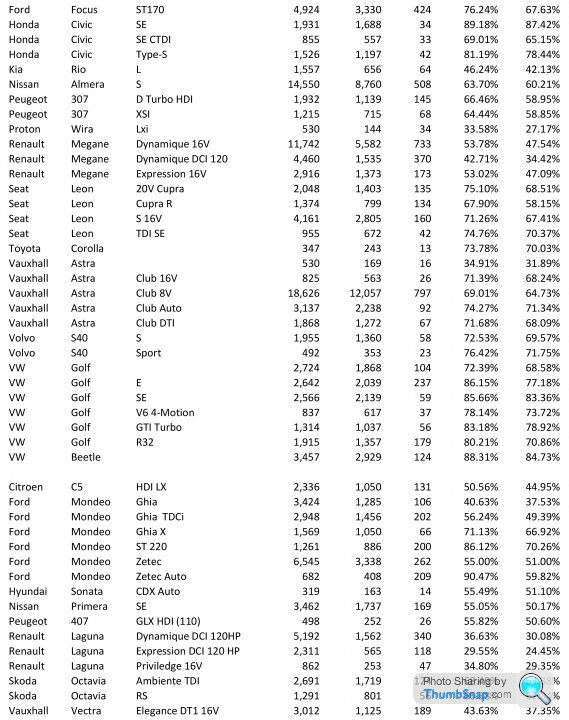
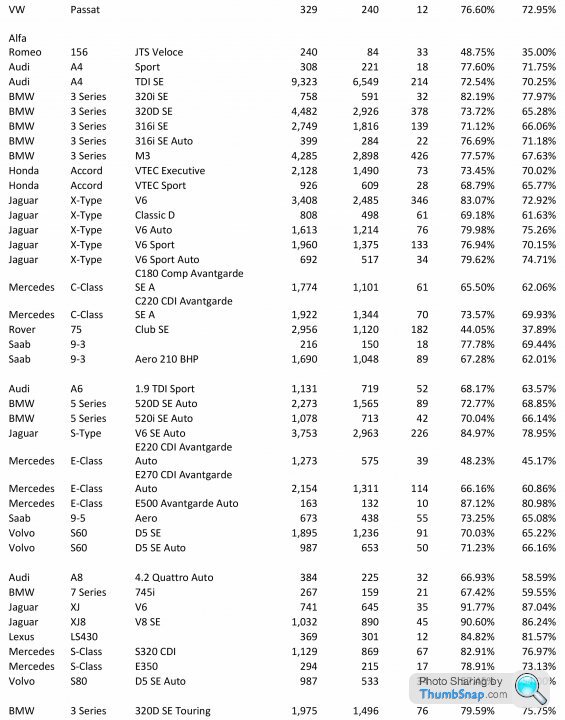
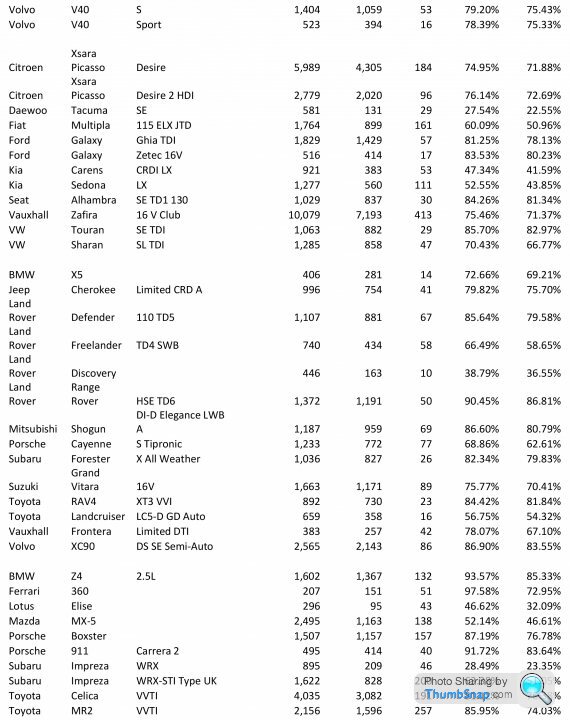
While I have found this thread interesting, I feel a desire to place it on a quantifiable rather than an anecdotal basis. Accordingly, I have consulted the howmanyleft.com website and have produced the following table. On the basis of the statistic quoted above [by an earlier poster on the original thread] for the current average life of a UK car of 13.8 years I have looked at the number of cars recorded as manufactured in 2003 that are still registered or SORNed in the UK. Which I think makes for quite interesting reading.
There are of course a number of health warnings that need to be given:
Naturally, I have merely scratched the surface of the available data, and there is much more to be done to produce a comprehensive analysis. I have spent many hours on this and feel that I have done my bit for now, but if anybody else wishes to add data, please post it up, and I would be happy to add it to my spreadsheet and re-post it.

I have drawn two sets of interim conclusions from the above: firstly, general conclusions, and secondly, more detailed conclusions about individual marques and models.
General Conclusions
Detailed Conclusions
Postscript
One glaring omission from this list was the Mini: I have no idea how I managed to forget it, but rest assured that it gets its rightful place in the Sun later in the thread.
While I have found this thread interesting, I feel a desire to place it on a quantifiable rather than an anecdotal basis. Accordingly, I have consulted the howmanyleft.com website and have produced the following table. On the basis of the statistic quoted above [by an earlier poster on the original thread] for the current average life of a UK car of 13.8 years I have looked at the number of cars recorded as manufactured in 2003 that are still registered or SORNed in the UK. Which I think makes for quite interesting reading.
There are of course a number of health warnings that need to be given:
- as the source website itself acknowledges, it is only as accurate as the Government statistics that it is based on allows – there are some plainly corrupt datasets, which I have ignored, fortunately these are only a small percentage of the total data [further work using the DfT data indicated that the issue arises from the howmanyleft.com website looking at individual model variants, an incredibly useful job; however, there are inconsistencies in the way that quite a few model variants are described between the “First Registrations” dataset and those for taxed and SORNed vehicles, which can make some of the data problematic when attempting to drill down to that level];
- the database replicates the manner in which vehicles were described on first registration, accordingly, most models are disaggregated into a bewildering number of variants, and in few cases only does it appear possible to gain access to a representative sample size of aggregate data for individual models, I have therefore been forced in most cases to select one or a few popular variants;
- in order to produce statistically significant samples my rule has been to use a minimum of 200 examples registered in 2003 as a cut off, although as you will see I have bent this on a couple of occasions to include a model of interest in the results;
- the statistics relate to manufacturer’s products of 13-14 years ago, thus some caution needs to be exercised when projecting the life-expectancy of current products, or equally crucially the future availability and pricing of spare parts.
Naturally, I have merely scratched the surface of the available data, and there is much more to be done to produce a comprehensive analysis. I have spent many hours on this and feel that I have done my bit for now, but if anybody else wishes to add data, please post it up, and I would be happy to add it to my spreadsheet and re-post it.
I have drawn two sets of interim conclusions from the above: firstly, general conclusions, and secondly, more detailed conclusions about individual marques and models.
General Conclusions
- As one would expect, it is small hatchbacks and prestige cars that have the greatest survival rates, with the greatest hollowing out being of common family sized cars.
- Notwithstanding the above, the smallest hatchbacks, in general, have markedly lower survival rates than supermini or family sized hatchbacks.
- In general, higher spec cars tend to survive better than base spec cars, no doubt reflecting the greater attachment that owners have for them, and thus willingness to pay for big bills on ageing cars.
- Estate cars have a survival rate varying between 2.5% and 9% higher than the saloon variant, reflecting their greater utility to owners. Their probability of being taxed is even higher, at between 5% and 16%.
- Performance variants tend to survive better, although there is a sharp dichotomy between the figures for small hatchbacks, and those for larger cars. At the risk of having my head bitten off, I would venture to suggest that this is likely to be related to the average driver profile: small hot hatches appealing to the yoof market tend to have poor survival rates, I suggest that this is likely to be as a result of being driven by inexperienced drivers who crash and otherwise abuse them a lot, whereas cars that are accessible to those with greater maturity (and probably greater average intelligence) and have markedly better survival rates than their cooking brethren, which by the time that one reaches the exalted heights of the Mercedes E500 gives an 80% survival advantage.
- The survival rates for diesel cars appear to be a shade over that that of equivalent petrol models: small diesel cars survive notably better than the equivalent petrol models, whereas at the prestige end of the market there appears to be slight bias in favour of petrol survival.
- Much as one hates to admit it, automatics seem to survive a little better than manuals, although again this is more marked in smaller cars.
- The survival rate of SUVs is, although high, somewhat less than I would have expected – it is clear that these are by no means virtually indestructible. The cost of repairs might be one issue, another might be export to the Third World. However, the survival rates for the cheaper models are much less than for prestige models.
- There is significant evidence of cars that most would consider to be the most likely future major classics being SORNed – one presumes that these vehicles are being stored by investors, mainly.
- Average survival rates across sample:
- Micro Hatches 58.3%
- Superminis 75.8%
- Family Hatches 70.6%
- Family Cars 52.1%
- Junior Executive Cars 72.1%
- Executive Cars 72.0%
- Luxury Barges 78.8%
- Estate Cars 79.3%
- People Carriers 72.6%
- SUVs 78.9%
- Sports Cars 73.9%
Detailed Conclusions
- As one would expect for the sample considered it is the Ferrari 360 that has the highest survival rate at 97.6%; however, over 25% of survivors are SORNed, no doubt mainly by collectors/speculators, and one is entitled to ask how many of these will ever be seen on the roads again. The BMW Z4 followed, just edging out the Porsche 911. I was somewhat surprised by the next two: the Honda Jazz, and the Jaguar XJ. These are both part of a strong showing by both manufacturers in the PH survival stakes.
- If a car originated from a mainstream manufacturer in France, Italy, Korea, or Malaysia then I am afraid that the chances of survival are not great, although there are some exceptions, which manage to achieve average survival rates for their class, most of which are Peugeots. The wooden spoon falls to the Daewoo Tacuma SE, with a survival rate of just 27.5%. Given that Korean cars are supposed to be the new Japanese cars this is perhaps a little surprising; however, Korean cars have come a long way in part 13-14 years, so I suspect that the current generation of cars is likely to fare rather better.
- Of the mainstream European manufacturers, I would suggest that the results indicate that the approximate ranking of survival probability is, from the best to worst, Ford, Skoda, VW, Peugeot, Vauxhall, Citroen, Renault, and Fiat. Of the great triumvirate, the sample indicates an 81.2% survival rate for the Focus, an 81.1% survival rate for the Golf, with Astra lagging badly on 69.2%. Given that this was the Mk4 Golf, I suspect that the Golf’s standing will slip subsequently: I strongly believe from personal ownership experience that the Mk 4 was a high point for the Golf, being more solidly engineered, and built with better quality components than later Golfs, even though these are more fun to drive. (I must admit to some personal interest here as I still own a very early Mk2 Golf GTI that I bought new, as well as a Mk2 16V Jetta GTI, that I have owned from new). None of the big three hatchbacks match the survival rate of the Fiesta: 83.7% of the sample. Contrast that with the 51.1% measured for the Renault Megane, or the 39.2% for the Fiat Stilo. Of the family-sized offerings only the VW Passat and Skoda Octavia have survival rates comparable to smaller hatchbacks. While the 34.5% survival rate of the notoriously flaky Mk2 Renault Laguna is badly sub-par.
- Of the Japanese manufacturers, Hondas have a greater survival rate than other manufacturers, let down only by the rather average 72.0% survival rate recorded for the Accord. Otherwise Honda has a survival rate comfortably above those of European mass market producers. Toyotas appear to have the second highest survival rates, which I must say slightly surprised me, given the horror stories that one hears about prices of crucial components. Nissan’s survival rates appear to be somewhat less than that of the other two main Japanese manufacturers, and comparable with those of middle-ranking European manufacturers.
- At the prestige end of the market Jaguar is the clear winner of the PH survival stakes in all three executive/luxury categories, this was quite a surprise to me, and a real eye-opener. The more Jaguar variants that I looked at the more it confirmed the trend. Even cars that are not held in generally high regard these days, such as the X-Type and the S-Type, have outlived all of their German contemporaries on Britain’s roads. The only poor showing is at the very bottom of the X-Type tree, the 2.0 Classic D: a poverty spec version fitted with a rattlely old Ford diesel with known issues: the closest point between the X-Type and its Mondeo roots. At the other end of the scale comparison between the (X350) XJ8 and the Audi A8 Quattro is instructive: both were aluminium bodied cars, fitted with 4.2 litre V8 engines, the former has a 90.6% survival rate of just 66.9%: a staggering difference.
- In the executive and luxury sectors, it appears from the sample that Jaguar, are followed by BMW, Audi, Mercedes and Volvo, except at rarefied heights, where the Mercedes S-Class trails the Jaguar XJ, with everything else nowhere. Given, that we are talking about the infamous quality of Mercedes around the Millennium, their relatively low survival rates is not perhaps surprising: I am of a generation that regards the W124 as the pinnacle of mass production engineering and the everything that Daimler-Benz has done since as third rate by comparison.
- Where have all the Lotus Elises gone?
Postscript
One glaring omission from this list was the Mini: I have no idea how I managed to forget it, but rest assured that it gets its rightful place in the Sun later in the thread.
colin_p said:
A perfect thread, thank you for putting the time and effort in.
Only had time to skim read and honed in the Focus vs MK4 Golf bit being only 0.1% apart. Out of those two it is a difficult call as which will have more on the road in say another five years time.
The MK1 and MK1.5 Focus is generally more simply engineered with less to go wrong in terms of engines and electronics but what is really letting them down is rust and secod to that will be the complicated mutlilink control blade rear suspension. The Focus is more robust and reliable but will rot away.
The MK4 Golf on the other hand is very well rustproofed and has a very simple rear suspension setup. Interestingly the front suspension on both the Golf and Focus is almost the same although the bush configuration on the Focus is more robust. What will let the Golf down and send it to the scrapper is an engine or electonics system failure.
From that alone they are neck and neck in a race to the scrappers, the Focus will rust away while the Golf will expensively go wrong.
However, factor in the greater love for and enthusiast scene then I think there will be more MK4 Golf left than MK1 / 1.5 Focus's in five years time.
As for current cars, I think they will be going to the scrapper much sooner than cars of yesteryear. The sweetspot for longlasting cars that a shed driver stands any chance of being to fix are those produced between the mid 90's and mid 00's. There are very few 90's cars left now so if anyone wants a credible go at shedding then grab an early 00's car before they too are few in numbers.
In the future shedding is going to be a lot more expensive and difficult, and I think rust once again is going to be a major issue. The issue is going to be 'coding' and built in inability of electronic parts to be re-used (coded) to another car. Electric power steering is going to be the biggest send to scrapper issue I'd say. Secondary to that due the expanded ranges of cars and therefore bespoke parts (mainly body panels) are going to be dealer only and therefore very expensive.
Only the most basic of current cars are going to become viable future sheds, could the Duster therefore become a classic?
Sorry if there is some thread shift but shedding is my thing although I never do it properly as I spend too much on my sheds.
Thank you for a very intelligent contribution. It deserves a sneak preview!Only had time to skim read and honed in the Focus vs MK4 Golf bit being only 0.1% apart. Out of those two it is a difficult call as which will have more on the road in say another five years time.
The MK1 and MK1.5 Focus is generally more simply engineered with less to go wrong in terms of engines and electronics but what is really letting them down is rust and secod to that will be the complicated mutlilink control blade rear suspension. The Focus is more robust and reliable but will rot away.
The MK4 Golf on the other hand is very well rustproofed and has a very simple rear suspension setup. Interestingly the front suspension on both the Golf and Focus is almost the same although the bush configuration on the Focus is more robust. What will let the Golf down and send it to the scrapper is an engine or electonics system failure.
From that alone they are neck and neck in a race to the scrappers, the Focus will rust away while the Golf will expensively go wrong.
However, factor in the greater love for and enthusiast scene then I think there will be more MK4 Golf left than MK1 / 1.5 Focus's in five years time.
As for current cars, I think they will be going to the scrapper much sooner than cars of yesteryear. The sweetspot for longlasting cars that a shed driver stands any chance of being to fix are those produced between the mid 90's and mid 00's. There are very few 90's cars left now so if anyone wants a credible go at shedding then grab an early 00's car before they too are few in numbers.
In the future shedding is going to be a lot more expensive and difficult, and I think rust once again is going to be a major issue. The issue is going to be 'coding' and built in inability of electronic parts to be re-used (coded) to another car. Electric power steering is going to be the biggest send to scrapper issue I'd say. Secondary to that due the expanded ranges of cars and therefore bespoke parts (mainly body panels) are going to be dealer only and therefore very expensive.
Only the most basic of current cars are going to become viable future sheds, could the Duster therefore become a classic?
Sorry if there is some thread shift but shedding is my thing although I never do it properly as I spend too much on my sheds.
Edited by Car_Nut on Friday 31st March 15:07
Max_Torque said:
Let me ask a question: Does survival rate inversely correlate with type fleet mileage?
IE, modern car's don't (really) rust away anymore, they get scrapped due to 2 things:
1) Getting crashed
2) Breaking down expensively
Both those factors are greatly influenced by mileage covered.
Something like a Mondeo vs a Jag X type is case in point. The chances are at say 10 years old, the Mondy will have 200k on the clock, the Jag just 80k, as the Mondy has been ploughed up and down the motorway day in, day out by a photocopy salesman, whereas the Jag only gets driven twice a week to the pub by Reginald and his wife (but only if it's sunny, Reg doesn't like to dry his Jag in the wet...)
Thanks this is a very valuable point. Undoubtedly, there is a lot of truth in this, although I were being obtuse I could argue with your example and suggest that 80k pootling about in the lanes is worse than 200k motorway miles. IE, modern car's don't (really) rust away anymore, they get scrapped due to 2 things:
1) Getting crashed
2) Breaking down expensively
Both those factors are greatly influenced by mileage covered.
Something like a Mondeo vs a Jag X type is case in point. The chances are at say 10 years old, the Mondy will have 200k on the clock, the Jag just 80k, as the Mondy has been ploughed up and down the motorway day in, day out by a photocopy salesman, whereas the Jag only gets driven twice a week to the pub by Reginald and his wife (but only if it's sunny, Reg doesn't like to dry his Jag in the wet...)
I think that this goes right back to point that I made right at the beginning is that just because Car A has a higher survival rate than Car B, it does not necessarily mean that it is better, which is where the factors that I mentioned earlier come into play. One of which should have been the driver demographic, which unfortunately I forgot: as we go on we will find that although performance variants tend to survive better than average, in the case of fast Saxos they don't - quelle surprise!
Your point is a useful extension of this!
GSalt said:
^ that, from personal experience classics and imports (even recent Irish imports) have very poor datasets due to transcription errors when the records are digitised, and the classic datasets are incomplete (and vulnerable to deliberate fraudulent errors).
This is a very good point, sifting through the data would appear to support this, as there are some obvious quirks between the GB and UK data. While cars can move ownership between the ROI and any part of the UK, logic would dictate the majority of these moves would be between ROI and NI. All the data used in my analysis using the DfT datasets has been of GB data, which (hopefully) would minimise this, second order, distortion. I should claim that this was done with brilliant forethought, but in fact full data for the 2001-13 period exists for GB alone, hence my use of it. Jimmy Recard said:
Thanks for this Car Nut, I've bookmarked the thread. I'll be following it. Not too many contributions from me as I'm no statistician and my 'knowledge' (ahem) is all anecdotal
Thanks Jimmy, nice to have you aboard again - you know the journey that we are about to undertake.It was Jimmy I think that got us onto a discussion of Mondeo v Vectra survival, and it was at point that we started to dip our toes into the mine of DfT data. I posted this on 8 January:
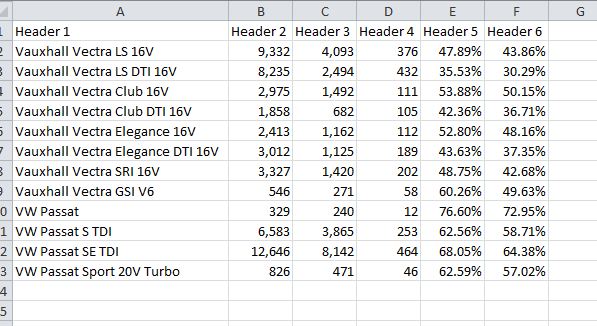
A promised, I have looked up the data for some more Vectra variants. At the same time I decided that I had not done enough analysis of the Passat, either. The extra info is as follows (apologies for what the website does to my tables, but hopefully they are understandable):
Vauxhall Vectra LS 16V 9,332 4,093 376 47.89% 43.86%
Vauxhall Vectra LS DTI 16V 8,235 2,494 432 35.53% 30.29%
Vauxhall Vectra Club 16V 2,975 1,492 111 53.88% 50.15%
Vauxhall Vectra Club DTI 16V 1,858 682 105 42.36% 36.71%
Vauxhall Vectra Elegance 16V 2,413 1,162 112 52.80% 48.16%
Vauxhall Vectra Elegance DTI 16V 3,012 1,125 189 43.63% 37.35%
Vauxhall Vectra SRI 16V 3,327 1,420 202 48.75% 42.68%
Vauxhall Vectra GSI V6 546 271 58 60.26% 49.63%
VW Passat 329 240 12 76.60% 72.95%
VW Passat S TDI 6,583 3,865 253 62.56% 58.71%
VW Passat SE TDI 12,646 8,142 464 68.05% 64.38%
VW Passat Sport 20V Turbo 826 471 46 62.59% 57.02%
This has the effect of slightly boosting the Vectra survival rate to 45.2%. But what it does reveal is that there seems to be specific problem with the survival rate of Vectra diesels: the petrol Vectras and Mondeos seem to have similar survival rates, but there is a massive discrepancy between the diesels.
The additional data for the Passat, knocks its survival rate back to 66.2%.
The down side of including all of this scrap fodder in the data, is that that average survival percentage of the 567,301 cars in the sample has dropped to 69.2%. Although the family car survival rate has increased to 53.1% for the sample that we now have.
At this point I decided to examine the original source data for howmanyleft.com, the Government figures, which can be found at: https://www.gov.uk/government/statistical-data-set... These are in the form of nice manipulatable Excel tables. It was then possible to aggregate all 303 lines of relevant Vectra variants (I ignored the niche Vauxhall Vectra Astra Elite CDTI and Vauxhall Vectra Zafira Life DualFuel models!), all 209 lines of Mondeo data between the data cut-off date of 2001 and the last full year of Vectra sales in 2008. It was then easy to produce the following graph:

As one can see the gap between the two models is less for the 2003 year than I had predicted on the sample data, however, the gap is always there and the Mondeo survival advantage increases steadily with age. It is therefore clear that Vectras will become extinct on Britain's roads earlier than Mondeos of equivalent age.
A promised, I have looked up the data for some more Vectra variants. At the same time I decided that I had not done enough analysis of the Passat, either. The extra info is as follows (apologies for what the website does to my tables, but hopefully they are understandable):
Vauxhall Vectra LS 16V 9,332 4,093 376 47.89% 43.86%
Vauxhall Vectra LS DTI 16V 8,235 2,494 432 35.53% 30.29%
Vauxhall Vectra Club 16V 2,975 1,492 111 53.88% 50.15%
Vauxhall Vectra Club DTI 16V 1,858 682 105 42.36% 36.71%
Vauxhall Vectra Elegance 16V 2,413 1,162 112 52.80% 48.16%
Vauxhall Vectra Elegance DTI 16V 3,012 1,125 189 43.63% 37.35%
Vauxhall Vectra SRI 16V 3,327 1,420 202 48.75% 42.68%
Vauxhall Vectra GSI V6 546 271 58 60.26% 49.63%
VW Passat 329 240 12 76.60% 72.95%
VW Passat S TDI 6,583 3,865 253 62.56% 58.71%
VW Passat SE TDI 12,646 8,142 464 68.05% 64.38%
VW Passat Sport 20V Turbo 826 471 46 62.59% 57.02%
This has the effect of slightly boosting the Vectra survival rate to 45.2%. But what it does reveal is that there seems to be specific problem with the survival rate of Vectra diesels: the petrol Vectras and Mondeos seem to have similar survival rates, but there is a massive discrepancy between the diesels.
The additional data for the Passat, knocks its survival rate back to 66.2%.
The down side of including all of this scrap fodder in the data, is that that average survival percentage of the 567,301 cars in the sample has dropped to 69.2%. Although the family car survival rate has increased to 53.1% for the sample that we now have.
At this point I decided to examine the original source data for howmanyleft.com, the Government figures, which can be found at: https://www.gov.uk/government/statistical-data-set... These are in the form of nice manipulatable Excel tables. It was then possible to aggregate all 303 lines of relevant Vectra variants (I ignored the niche Vauxhall Vectra Astra Elite CDTI and Vauxhall Vectra Zafira Life DualFuel models!), all 209 lines of Mondeo data between the data cut-off date of 2001 and the last full year of Vectra sales in 2008. It was then easy to produce the following graph:
As one can see the gap between the two models is less for the 2003 year than I had predicted on the sample data, however, the gap is always there and the Mondeo survival advantage increases steadily with age. It is therefore clear that Vectras will become extinct on Britain's roads earlier than Mondeos of equivalent age.
By the next day we had this (you will see this curve a lot):
Anyway I have also carried out the big sum and have produced the survival curve for all cars on the UK's roads or that are SORNed that were constructed between 2001 and 2015, I will call this the survival rate reference curve:

Considering the amount of data involved, I am surprised that the curve is not smooth - any ideas? My best guess at present is the that 2008-9 financial crush changed the car type mix (as we have already seen there is a disparity in the survival rates between different types of cars).
To return to our reference year of 2003, the big numbers are as follows:
First Registrations: 2,646,056
2003 Built cars surviving: 1,822,891
2003 Built cars still taxed: 126,729
2003 Built cars SORNed: 1,696,162
Surviving: 68.89%
Taxed: 64.10%
SORN: 4.79%
Anyway I have also carried out the big sum and have produced the survival curve for all cars on the UK's roads or that are SORNed that were constructed between 2001 and 2015, I will call this the survival rate reference curve:
Considering the amount of data involved, I am surprised that the curve is not smooth - any ideas? My best guess at present is the that 2008-9 financial crush changed the car type mix (as we have already seen there is a disparity in the survival rates between different types of cars).
To return to our reference year of 2003, the big numbers are as follows:
First Registrations: 2,646,056
2003 Built cars surviving: 1,822,891
2003 Built cars still taxed: 126,729
2003 Built cars SORNed: 1,696,162
Surviving: 68.89%
Taxed: 64.10%
SORN: 4.79%
B'stard Child said:
The PH Table format works brilliantly within an xls sheet
With your data in an xls sheet
add in an additional column in front of every column
Then add | x 2 in front of every cell in every column and same again in the first blank column after the data
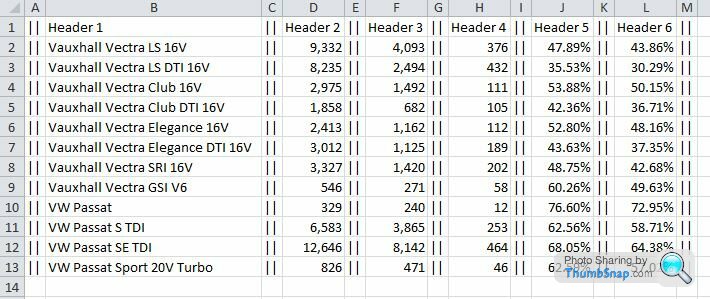
Then copy it all into a post on here
Thanks for taking the time to produce such an excellent tutorial Son of Alan, it is greatly appreciated. Is there a similar trick for Excel graphs, please, for it is with these that I will be mainly concerned from now?With your data in an xls sheet
add in an additional column in front of every column
Then add | x 2 in front of every cell in every column and same again in the first blank column after the data
Then copy it all into a post on here
| Header 1 | Header 2 | Header 3 | Header 4 | Header 5 | Header 6 |
| Vauxhall Vectra LS 16V | 9,332 | 4,093 | 376 | 47.89% | 43.86% |
| Vauxhall Vectra LS DTI 16V | 8,235 | 2,494 | 432 | 35.53% | 30.29% |
| Vauxhall Vectra Club 16V | 2,975 | 1,492 | 111 | 53.88% | 50.15% |
| Vauxhall Vectra Club DTI 16V | 1,858 | 682 | 105 | 42.36% | 36.71% |
| Vauxhall Vectra Elegance 16V | 2,413 | 1,162 | 112 | 52.80% | 48.16% |
| Vauxhall Vectra Elegance DTI 16V | 3,012 | 1,125 | 189 | 43.63% | 37.35% |
| Vauxhall Vectra SRI 16V | 3,327 | 1,420 | 202 | 48.75% | 42.68% |
| Vauxhall Vectra GSI V6 | 546 | 271 | 58 | 60.26% | 49.63% |
| VW Passat | 329 | 240 | 12 | 76.60% | 72.95% |
| VW Passat S TDI | 6,583 | 3,865 | 253 | 62.56% | 58.71% |
| VW Passat SE TDI | 12,646 | 8,142 | 464 | 68.05% | 64.38% |
| VW Passat Sport 20V Turbo | 826 | 471 | 46 | 62.59% | 57.02% |
FAMILY HATCHBACK SURVIVAL
This is a greatly expanded update of my earlier analysis, which only covered the Ford Focus, Honda Civic, Peugeot 307 & 308, Renault Megane, Vauxhall Astra, and the VW Golf). This is now a reasonably comprehensive analysis of the segment, within my self-imposed constraint of sixteen model lines. I have also brought it up to the standard of my later work.
The analysis is based on the official Government data published by the DfT, which is only available fully from 2001 onwards. Hence this forms the start date for this survey. All figures are quoted as at 31 December 2015.
The sixteen models considered in this analysis are:
One interesting by product of this exercise was to spot that there are literally thousands of Megane convertibles around 15 years old that are SORNed. Given that the snapshot was taken on 31 December 2015, some of these will have been laid up for the Winter, but one suspects that most are much-loved cars that are sitting quietly rotting in front gardens, awaiting miraculous resurrections.
I have, however, retained all hatchback performance variants: this is PH after all! In any case, in these days of subtle graduations from slightly warm hatches to full fat road burners, where does one draw the line?
Given that graphs with more than eight lines become difficult to read, the initial graphical analysis splits the cars into two groups of cars (marque names A-K, and M-Z). Where appropriate, the top and bottom performing few models are then presented together for comparison.
Lets start by looking at the numbers of first registrations, for the two groups.
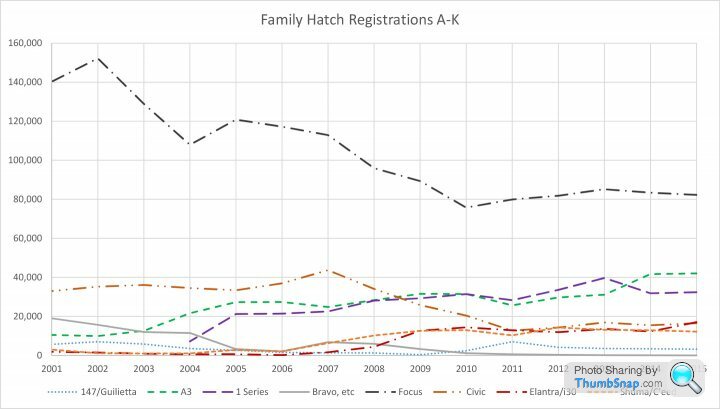
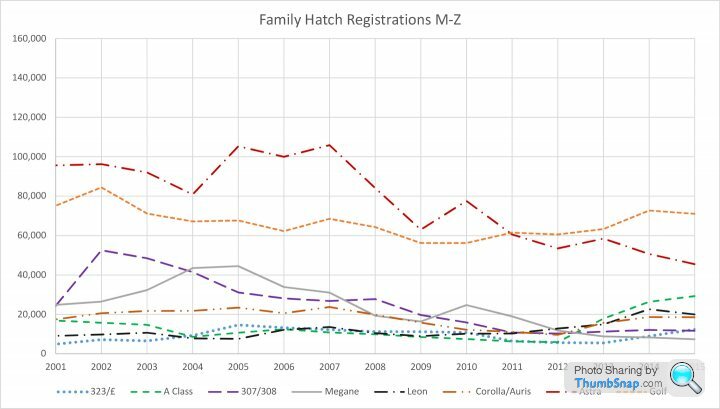
I believe these two graphs to be self-explanatory.
As the majority of the models in the family hatch market segment have been included, and indeed the overwhelming majority in sales terms, we can make a reasonably close estimate of the total number of family hatchbacks registered in each year, by adding the figures for the sixteen models considered together:

In general, over the period, there has been a modest downward sales trend: sales declining by 12.5% between 2001 and 2015. There are other trends within this overall picture, however. For the models considered sales peaked in 2002 before declining by 32.7% to the bottom of the market in 2012. Sales then recovered after 2012, by 16.9% to 2015.
There are a number theories that we could advance for the curve. Family hatchbacks are often cited as the fiercest part of the battleground between manufacturers, that competition has not only been from within the sector but from without it as it has been squeezed between the increasing size and habitability of Superminis, and increased aspirations for premium cars. It can be seen the main fall in sales occurred between 2007 and 2011, it therefore could be argued that in the 2008 financial crash, and its fall-out, a proportion of former family hatchback buyers traded downwards to the Supermini segment.
What is clear is that there has been a change in buying habits within the segment as can be seen in the next graph, which is limited to cars that managed to achieve 35,000 new registrations in any year of our period:

As I am sure that all of us have observed on the roads, buyers have shifted from the traditional models towards those perceived by the buying public as having more prestigious badges, and to a lesser extent, the new economy brands from Korea. Of the dominant triumvirate at the start of the period, only the Golf has managed to maintain its share of the market segment, the decline of the Astra since 2010 has been rapid, however, although the Focus has lost much of its dominance, it remains top dog, for now at least. French cars have also experienced progressive decline over the period: is the Peugeot-GM Europe merger a case of tying oneself to a corpse? The gainers have been the “prestige brands”, and the Koreans.
There are some glitches with the 2015 data: there appears to have been a change of collection methodology in 2015, which is always the bane of analysis, but the practice of pre-registration might also be having a distorting impact on the data (applies to several recent years).
Pre-registration is an interesting issue: in the case of almost all of these cars the SORN rate for 2015 cars is some way above that for 2014 cars, and in the years leading up to this. It should be stressed that there are other possible explanations, other than pre-registration, for this phenomenon (not least the first registration and sale process); however, I still find the following first year SORN rates interesting as a possible indicator of who it appears might have been maintaining market share artificially through pre-registrations at the end of 2015 (I start to look a bit askance at anything with a first year SORN rate of more than a third of a percent):
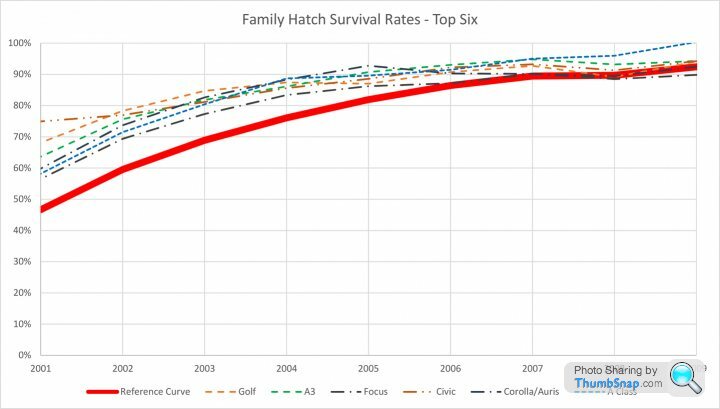
Moving onto survival rates the graphs for the 2001 to 2014 period for the two groups are as follows:
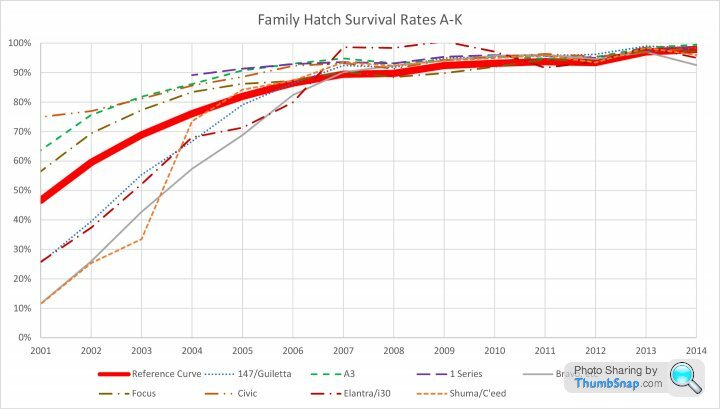

As nothing much interesting happens in the 2009 to 2014 period, as one would expect, this second graph zooming into the 2001 to 2009 period is a bit clearer.
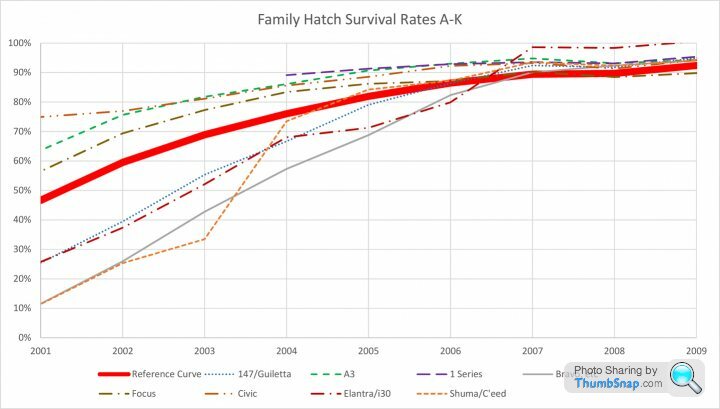
Overall, it can be seen that battle for supremacy in the survival stakes is between the Golf and the Civic (but see comments below), closely pursued by the Audi A3, but whereas Golfs eventually start to pass on to the great car park in the sky, Civics just seem to keep going on and on, with no evidence of a ‘death curve’ yet emerging, unlike anything else in the class. The effect is even more marked when one looks at the number that are still taxed and on the roads: once they get more than six years old the SORN rate is far lower than anything else bar the Golf, the Golf manages to hang on until after thirteen years the rate of increase of Golf SORNing rate markedly exceeds that of the Civic, whose surviving examples are more likely to be still earning their keep.
The top three are pursued closely by a gaggle that is, in fairly clear order the Corolla, the Mercedes A-Class, and the Focus. All of whom achieve creditable survival rates that are comfortably above the Reference Curve. On current trends, the BMW 1 Series might well be on course to supplant the Civic at the top, but as the model range was only introduced in 2004, the earliest examples are not yet old enough for ‘top of the class’ consideration, given the high standards achieved by the top six whose comparative performance can be seen here:

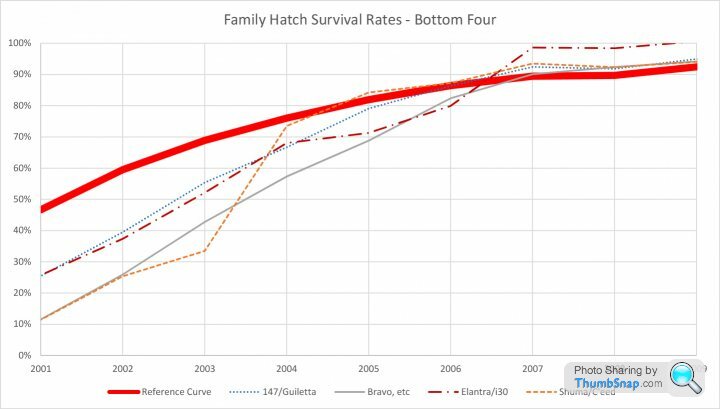
Leaving out the boring stuff in the middle, we come to the worst performing four: two closely matched Italo-Korean pairs screaming to oblivion, vying for the accolade of Britain’s worst surviving hatchback. Bad though the record of Alfa 147 and the Hyundai Elantra are, the Kia Shuma and the original Fiat Bravo/Brava beat them, with the Kia’s 11.45% survival rate just edging out the Fiat’s 11.55% survival rate at fourteen years old. These are truly dreadful records, made still worse by the above average survival record of the class as a whole. To date this pair have the worst survival rate yet examined in any class. This quartet even manage to make the survival performance of the Renault Megane 2 look relatively good, itself a pretty dreadful performer.
SORN rates are interesting: by the time that we get to the oldest cars in our survey the Toyota Corolla has a similar SORN rate to the Civic, but I would suggest that this is commentary on both the famously rapacious Toyota spare parts prices and the undesirability of the Corolla, so that broken Corollas are thrown away, not put aside to repair when times are propitious. Using the logic of perceived desirability to their owners it is not surprising to discover that, at fourteen years old, the Mercedes A-Class has the greatest absolute percentage of original registrations SORNed (7.1%), and the that Alfa-Romeo 147 has the greatest likelihood of survivors being SORNed: a whopping 25.3%. For comparison, the figures for the Civic are just 3.7% and 5.0% respectively. (Headline stat a new Leon is almost as likely to be SORNed as a fourteen year old Civic!).
In my earlier assessments of survival rates, based on a small sample of each, I predicted survival rates for 2003 for the Focus, Golf, and Astra of 81.2%, 81.1%, and 69.2% respectively. In fact, the actual rates were 77.3%, 84.7%, and 64.8%, the biggest issue was overstating the relative survival rate of the Focus, as a result of being too interested in the performance and top spec variants, which as we have seen tend to survive better.
As we have captured the overwhelming majority of cars in this segment we can thus show the overall survival rate curve for the segment as a whole.

We can see that, as one would expect, as a group family hatches survive a little better than the average for Britain’s car population as a whole. The relative difference between the two graphs widens as the cars age, widening exponentially from a 1% for seven year old cars to over 13% for fourteen year old cars.
Looking at each model in greater detail:
Alfa-Romeo 147 & Giulietta – it is disappointing to see the poor survival rate of the 147, having seemed a jolly little thing renting one in Italy, possibly because of the special frisson that one gets driving an Alfa in Italy. Although, even with the rose-tinted view that this gave, it never seemed to be a quality car. Its survival performance is pretty dreadful, with the “death curve” starting at only eight years and an ever increasing proportion of the survivals dying every year thereafter, until between thirteen and fourteen years of age over 35% of the survivors become scrap metal. If Alfista want a decent 147 for their collection they need to act soon. It is far too early to project the Giulietta survival rate.
Audi A3 – given that the A3 is effectively a premium version of the VW Golf, it is perhaps a little surprising that the A3 clearly lags Golf survival once the cars are more than a decade old, with a margin that increases over time, although the fact that the A3 gets the earlier generation change to the new VW Group platform slightly complicates the comparison. For 2001 cars, the gross survival rate differential between the two cars is 4.5%, which equates to a 6.5% higher probability of survival for the Golf. At present, there appears to be no great difference in survival rate at the transition between the First and Second Generation A3s. Naturally, it is too early to give an opinion on the Third Generation survival rate.
BMW 1 Series – given that there are relatively few 2011 F20/F21s and few 2012 registered E81/E87s, the transition between the two models should become easy to call, unfortunately the survival rate is still much too high at this relatively young age to assess the issue. The prospects appear excellent for the E81/E87 to set a new benchmark for longevity in the class, the survival rate for the earliest 2004 cars being 1.72% (gross) above that of 2004 Golfs, equivalent to a 1.97% higher probability of survival. But we will need a couple more years of data to confirm this, and the 1 Series’ survival rate is not suddenly going to tip into a screaming death curve (one can always hope as age has not leant any enchantment to the 1 Series’ pug-ugly looks in my view). So at present 1 Series owners can sit comfortably in the knowledge that not only is have a good chance of becoming the best surviving car in its market segment, but it is right up there as a contender for the coveted title of Britain’s ugliest car.
Fiat Bravo/Brava, Stilo & Bravo – Fiat deserve to be congratulated, in that they managed to replace the original Bravo/Brava, a real contender for the title of Britain’s worst surviving car with the Stilo a car that appears to have an equally poor survival rate: at the transition between the two models not a waver can be seen in what is not so much a “death curve”, but near vertical plunge to extinction. This is a real achievement in a perverse sort of way. The oldest surviving cars in our survey died at a rate of 55.5% of the surviving stock per annum. Given that these were figures for the end of 2015, this is definitely the last call for all those who want to save a UK Bravo/Brava to show future generations. When we viewed our present house, over ten years ago, the remains of one was in the garage, which was being sold off bit by bit on eBay: the son of the house had one on which some vital electrical component had failed and he had worked out that it was cheaper to buy another complete car to get the component that he wanted, and then make money selling other bits of it off on eBay. It is also the time for anyone who wants to save a Stilo for posterity to act. The new Bravo had not yet entered its death curve on the 2016 DfT figures, but was just at the point where one would expect one to start: when the 2017 figures, which should run to the end of 2016, are released by the DfT in couple of weeks’ time this will be one to watch. As we will see with the Panda, Fiat can do much better than this.
Ford Focus – a very solid performance in the PH survival stakes, across all incarnations of the Focus, showing the progress that Ford has made over the past two decades. The survival rate for Focuses over ten years old appears set to exceed that of the Golf, once the Golf Mk 4 drops off the end of our graph (see below). The only fly in the ointment is that it appears that the survival rate of the Mk 2 Focus is not quite up to that of the Mk 1, with the survival rate dropping by approximately 3% across the transition, although we what we do not yet know is whether the Mk 2 will follow the same “death curve” as the Mk 1. It is too early to yet call the Mk 2 to Mk 3 transition.
Honda Civic – given that the Sixth Generation Civic only appears for part of one year right at the beginning of our analysis, and formed only a minority of sales in that year one needs to be fairly tentative in one’s comments. However, I have disaggregated the Sixth and Seventh Generation figures out for 2001: the Sixth Generation had a 71.4% survival rate and the Seventh a 75.4% survival rate. Furthermore, the probability of a survivor being SORNed is 8.9% and 4.5% respectively. Accordingly, although both sets of figures are creditable, it would seem that the Seventh Generation represented an improvement over the Sixth, and the failure of the Civic to enter a ‘death curve’ as opposed to natural wastage is not the result of the Sixth Generation propping the tail of the figures up, indeed the contrary applies. The Seventh to Eighth Generation transition appears smooth. On present trends, it would appear as if a majority of Seventh and Eighth Generation Civics will still be on the roads on their twentieth birthdays, which will be some achievement.
Hyundai Elantra & i30 – another manufacturer who can do far better, as we will see when we get to the Getz (which has one of the best survival rates in its market segment). The Elantra just misses out from being the third worst survivor in its market segment: its 25.75% survival rate for 2001 cars is edged out by the Alfa 147s 25.45% rate. But at least 21.6% are taxed and on the road, as opposed to 19.0% for the Alfa. But that is the good news, at the transition between the Elantra and the first Generation i30, the i30 is performing even worse. This is another model for which we will need another year or two’s worth of figures to confirm the trend, but at the end of 2015 the earliest i30s are doing worse, even than Kias and Fiats of equivalent age: were the trend to continue it would mean that for all practical purposes early i30s would be extinct inside thirteen years. But let’s wait to see what this month’s figures show….
Kia Shuma, Cerato & C’eed – it is undoubtedly a good thing that Kias are now merely re-styled Hyundais, as Kia cars’ survival record as a unique manufacturer is the second worst of any that I have examined to date, only Daewoo beating it, and is consistently poor across all models examined (so far), as we will see in due course. Hopefully, current Kias will survive better, although personally I would want to see some evidence of it before slapping any money down on one. The Shuma’s 11.45% survival rate for 2001 registered cars is the worst of any car that I have examined in detail to date, and much as one would want to make excuses for it, it must be indicative of a fundamental build that was not equipped for durability in British conditions. The only positive thing that one can say is that 9.02% of all 2001 registered Shumas were taxed at the end of 2015, as opposed to 8.83% of Fiat Bravo/Bravas, which I would suggest indicates that the inherent survivability of the Kia is higher than the Fiat, but that Fiat owners are more attached to their cars. Fortunately, the Kia Cerato appears a much better prospect, at the transition between it and the Shuma, the step appears to be of the order of 20% gross, which means that an eleven-year-old Cerato is approximately 60% more likely to survive than a Shuma, which is an encouraging sign. The oldest Ceratos just dip under the Standard Reference Curve with what appears to be the start of steepening ‘death curve’, again another year or two of data will be required to see if its survival rate can keep in touch with that cars such as the Vauxhall Astra and Renault Megane. Although the transition between the Cerato and the C’eed is somewhat uneven, broadly, the C’eed appears to share the improved survival performance of the Cerato.
Mazda 323 & 3 – the 323 BH has just about the weirdest survival curve of anything that I have seen: make of it what you want, generally it is well below average, almost Megane-bad but then perks up for the oldest models to hit the Standard Reference Curve. Let’s call it as below average. All versions of the Mazda3 perform well, achieving above average survival rates, and on a par with the better surviving cars in the market segment.
Mercedes A Class – a good performance from the W168, putting it a clear fourth in the PH survival stakes in the market segment. But the transition to the W169 resulted in a drop in the survival rate at the transition with the W168 of around 2.5% gross, equivalent to a decrease of around 2.8% in survival probability at the transition. While survival rate of the W169 is still good, and well up with ‘best in class’, its ‘death curve’ commences at only six years old, albeit gently. Naturally, it is still far too soon to assess the survival performance of the, radically different, W176.
Peugeot 307 & 308 – a solid performance, with the survival rate pinned almost exactly to the overall reference trend line. A consistent performance across the transition between the 307 and 308, although it appears that the survival rate for the 307 might be around 4% better than that for the 308 as the cars approach the end of their first decade, so the long-term survival performance might drop a little as the 308s age.
Renault Megane – not a good survival performance; however, it seems that the main problem with survival rates afflicted the Megane 2, and the early signs are that the Megane 3 might well be more durable, although one needs to exercise caution when attempting to link a high survival rate in the first few years to long-term durability. The Megane 1 is already rare on our roads, with the Megane 2 are set to follow it over the next few years, most of which are now no longer shaking their backsides! The survival rate dropped by 15-20% gross at the transition between the Megane 1 and the Megane 2, which given that the survival rate of Megane 1 is not particularly impressive means that at thirteen years a Megane 1 has around twice the survival rate of a Megane 2.
Seat Leon – as one would expect the Golf’s Spanish sister, lags some way below both of its German sisters, but is pinned closely to the average survival rate curve for the market segment. The transition between the First and Second generations appears reasonably smooth, lacking the downward blip of the Mk 4 to 5 transition for the Golf, possibly all of those crashed First Generation Leon Cupras has kept the First Generation survival rate down? A competent and unremarkable performance: a Leon is bit more likely to survive than a 307 or an Astra.
Toyota Corolla & Auris – zzzzzzzzzzzzzzz, sorry fell asleep thinking too deeply about the Toyota Corolla. As with other Toyota models, an impressive survival rate for the earlier models in the survey, drops off sharply for cars built after the mid-2000s: 2005 in the case of the Corolla. Is this enough, can I move on please? Alright then, key stat: one had to buy a post-2009 Auris to buy a Corolla/Auris with a better survival rate than a 2005 Corolla, as at 31 December 2015.
Vauxhall Astra – Some might regard the Astra’s performance in the PH survival stakes as symptomatic of the car itself: average, competent, and unspectacular. The Astra’s survival rate is pinned closely to the Standard Reference Curve, but lags the class average. The survival rate appears to be unchanged by the regenerations from Mk IV to Mk V.
Volkswagen Golf – It is clear that there are two distinct curves to the graph, with that up to the last full year of Mk 4 sales in 2003, having a higher trend than that from 2005 onwards (the first full year of Mk 5 sales). This is no surprise to me, having ownership experience either side of the Mk 4/5 divide, I have been of the opinion for some years that the durability and quality of components used reached a high point with the Mk 4, and that the Mk 5 was part of the start of a drastic deterioration in underlying product quality for the VW Group as a whole. Having said that the Mk 4 is a fairly stodgy drive, in my view, whereas the Mk 5 is a lot sharper and more fun to drive – it just depends on whether one is paying for one’s own motoring or not. I predict that the overall survival rate of Golfs is likely to fall over time, as the Mk 4s fall off the end of our graph. Naturally, it is too early to comment on the relative survival rates of the Mk 6 and the Mk 7, although the Mk 6 is really just a mid-lift facelift of the Mk 5.
I will give it a couple of days for this post to be read and discussed, as necessary, then I will post the luxury car analysis, which I think is good to go as it was. There will then be a bit of a pause before I repost the Supermini analysis, as I will be swapping out the Peugeot 106 line for the 206 line, in line with the requests. To match this, I will also swap out the Hyundai Getz/i10 line for the i20 line (which at least will bump up the city car survival rate). As I am rather busy at present this might take a while.
This is a greatly expanded update of my earlier analysis, which only covered the Ford Focus, Honda Civic, Peugeot 307 & 308, Renault Megane, Vauxhall Astra, and the VW Golf). This is now a reasonably comprehensive analysis of the segment, within my self-imposed constraint of sixteen model lines. I have also brought it up to the standard of my later work.
The analysis is based on the official Government data published by the DfT, which is only available fully from 2001 onwards. Hence this forms the start date for this survey. All figures are quoted as at 31 December 2015.
The sixteen models considered in this analysis are:
- Alfa-Romeo 147/Giulietta: 147 to 2009, Guiletta 2010 to date.
- Audi A3: First Generation to 2003, Second Generation 2003 to 2012, Third Generation 2012 on.
- BMW 1 Series: E81/E87 2004 to 2012, F20/F21 2011 on.
- Fiat Bravo/Brava/Stilo/Bravo: original Bravo/Brava to 2002, Stilo 2002 to 2007, new Bravo 2007 to 2014.
- Ford Focus: Mk 1 to 2005, Mk 2 2005 to 2011, Mk 3 2011 to date.
- Honda Civic: Sixth Generation to 2001, Seventh Generation 2001 to 2005, Eighth Generation 2005 to 2011, Ninth Generation 2011 to 2015.
- Hyundai Elantra/i30: Elentra to 2006, i30 First Generation 2007 to 2012, Second Generation 2012 on (replaced 2017).
- Kia Shuma/Cerato/C’eed: Shuma to 2003 (plus 206 No. in 2004), Cerato 2004 to 2007 (only 287 No. in 2007), C’eed First Generation 2007 to 2012, C’eed Second Generation 2012 on.
- Mazda 323/3: 323 BH to 2003 (plus 130 No. in 2004), 3 BK 2004 to 2009 (plus 191 No. in 2003), 3 BL 2009 to 2013, 3 BM 2013 to date.
- Mercedes A Class: W168 to 2004, W169 2005 to 2012, W176 2012 to date.
- Peugeot 307/308: 307 2001 to 2007, 308 2007 to date.
- Renault Megane: Megane 1 to 2002, Megane 2 2002 to 2009, Megane 3 2008 to 2016.
- Seat Leon: First Generation to 2005, Second Generation 2005 to 2013, Third Generation 2013 on.
- Toyota Corolla/Auris: Corolla E120 to 2007. Auris E150 2007 to 2012, Auris E180 2012 to date.
- Vauxhall Astra: Astra Mk IV to 2004, Astra Mk V 2004 to 2010, Astra Mk VI 2010 to 2015.
- Volkswagen Golf: Mk 4 to 2004. Mk 5 2004 to 2009, Mk 6 2009 to 2014, Mk 7 2014 to date.
One interesting by product of this exercise was to spot that there are literally thousands of Megane convertibles around 15 years old that are SORNed. Given that the snapshot was taken on 31 December 2015, some of these will have been laid up for the Winter, but one suspects that most are much-loved cars that are sitting quietly rotting in front gardens, awaiting miraculous resurrections.
I have, however, retained all hatchback performance variants: this is PH after all! In any case, in these days of subtle graduations from slightly warm hatches to full fat road burners, where does one draw the line?
Given that graphs with more than eight lines become difficult to read, the initial graphical analysis splits the cars into two groups of cars (marque names A-K, and M-Z). Where appropriate, the top and bottom performing few models are then presented together for comparison.
Lets start by looking at the numbers of first registrations, for the two groups.
I believe these two graphs to be self-explanatory.
As the majority of the models in the family hatch market segment have been included, and indeed the overwhelming majority in sales terms, we can make a reasonably close estimate of the total number of family hatchbacks registered in each year, by adding the figures for the sixteen models considered together:
In general, over the period, there has been a modest downward sales trend: sales declining by 12.5% between 2001 and 2015. There are other trends within this overall picture, however. For the models considered sales peaked in 2002 before declining by 32.7% to the bottom of the market in 2012. Sales then recovered after 2012, by 16.9% to 2015.
There are a number theories that we could advance for the curve. Family hatchbacks are often cited as the fiercest part of the battleground between manufacturers, that competition has not only been from within the sector but from without it as it has been squeezed between the increasing size and habitability of Superminis, and increased aspirations for premium cars. It can be seen the main fall in sales occurred between 2007 and 2011, it therefore could be argued that in the 2008 financial crash, and its fall-out, a proportion of former family hatchback buyers traded downwards to the Supermini segment.
What is clear is that there has been a change in buying habits within the segment as can be seen in the next graph, which is limited to cars that managed to achieve 35,000 new registrations in any year of our period:
As I am sure that all of us have observed on the roads, buyers have shifted from the traditional models towards those perceived by the buying public as having more prestigious badges, and to a lesser extent, the new economy brands from Korea. Of the dominant triumvirate at the start of the period, only the Golf has managed to maintain its share of the market segment, the decline of the Astra since 2010 has been rapid, however, although the Focus has lost much of its dominance, it remains top dog, for now at least. French cars have also experienced progressive decline over the period: is the Peugeot-GM Europe merger a case of tying oneself to a corpse? The gainers have been the “prestige brands”, and the Koreans.
There are some glitches with the 2015 data: there appears to have been a change of collection methodology in 2015, which is always the bane of analysis, but the practice of pre-registration might also be having a distorting impact on the data (applies to several recent years).
Pre-registration is an interesting issue: in the case of almost all of these cars the SORN rate for 2015 cars is some way above that for 2014 cars, and in the years leading up to this. It should be stressed that there are other possible explanations, other than pre-registration, for this phenomenon (not least the first registration and sale process); however, I still find the following first year SORN rates interesting as a possible indicator of who it appears might have been maintaining market share artificially through pre-registrations at the end of 2015 (I start to look a bit askance at anything with a first year SORN rate of more than a third of a percent):
| Alfa Giulietta: | 1.61% |
| Audi A3 | 0.72% |
| BMW 1 Series | 0.57% |
| Ford Focus | 0.75% |
| Honda Civic | 0.80% |
| Hyundai i30 | 0.23% |
| Kia C’eed | 1.43% |
| Mazda3 | 0.35% |
| Mercedes A Class | 0.19% |
| Peugeot 308 | 0.88% |
| Renault Megane | 0.26% |
| Seat Leon | 3.53% |
| Toyota Auris | 0.44% |
| Vauxhall Astra | 0.65% |
| Volkswagen Golf | 0.93% |
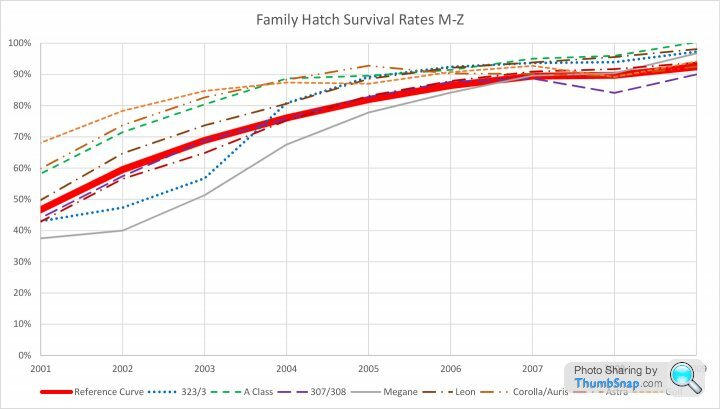
Moving onto survival rates the graphs for the 2001 to 2014 period for the two groups are as follows:
As nothing much interesting happens in the 2009 to 2014 period, as one would expect, this second graph zooming into the 2001 to 2009 period is a bit clearer.
Overall, it can be seen that battle for supremacy in the survival stakes is between the Golf and the Civic (but see comments below), closely pursued by the Audi A3, but whereas Golfs eventually start to pass on to the great car park in the sky, Civics just seem to keep going on and on, with no evidence of a ‘death curve’ yet emerging, unlike anything else in the class. The effect is even more marked when one looks at the number that are still taxed and on the roads: once they get more than six years old the SORN rate is far lower than anything else bar the Golf, the Golf manages to hang on until after thirteen years the rate of increase of Golf SORNing rate markedly exceeds that of the Civic, whose surviving examples are more likely to be still earning their keep.
The top three are pursued closely by a gaggle that is, in fairly clear order the Corolla, the Mercedes A-Class, and the Focus. All of whom achieve creditable survival rates that are comfortably above the Reference Curve. On current trends, the BMW 1 Series might well be on course to supplant the Civic at the top, but as the model range was only introduced in 2004, the earliest examples are not yet old enough for ‘top of the class’ consideration, given the high standards achieved by the top six whose comparative performance can be seen here:
Leaving out the boring stuff in the middle, we come to the worst performing four: two closely matched Italo-Korean pairs screaming to oblivion, vying for the accolade of Britain’s worst surviving hatchback. Bad though the record of Alfa 147 and the Hyundai Elantra are, the Kia Shuma and the original Fiat Bravo/Brava beat them, with the Kia’s 11.45% survival rate just edging out the Fiat’s 11.55% survival rate at fourteen years old. These are truly dreadful records, made still worse by the above average survival record of the class as a whole. To date this pair have the worst survival rate yet examined in any class. This quartet even manage to make the survival performance of the Renault Megane 2 look relatively good, itself a pretty dreadful performer.
SORN rates are interesting: by the time that we get to the oldest cars in our survey the Toyota Corolla has a similar SORN rate to the Civic, but I would suggest that this is commentary on both the famously rapacious Toyota spare parts prices and the undesirability of the Corolla, so that broken Corollas are thrown away, not put aside to repair when times are propitious. Using the logic of perceived desirability to their owners it is not surprising to discover that, at fourteen years old, the Mercedes A-Class has the greatest absolute percentage of original registrations SORNed (7.1%), and the that Alfa-Romeo 147 has the greatest likelihood of survivors being SORNed: a whopping 25.3%. For comparison, the figures for the Civic are just 3.7% and 5.0% respectively. (Headline stat a new Leon is almost as likely to be SORNed as a fourteen year old Civic!).
In my earlier assessments of survival rates, based on a small sample of each, I predicted survival rates for 2003 for the Focus, Golf, and Astra of 81.2%, 81.1%, and 69.2% respectively. In fact, the actual rates were 77.3%, 84.7%, and 64.8%, the biggest issue was overstating the relative survival rate of the Focus, as a result of being too interested in the performance and top spec variants, which as we have seen tend to survive better.
As we have captured the overwhelming majority of cars in this segment we can thus show the overall survival rate curve for the segment as a whole.
We can see that, as one would expect, as a group family hatches survive a little better than the average for Britain’s car population as a whole. The relative difference between the two graphs widens as the cars age, widening exponentially from a 1% for seven year old cars to over 13% for fourteen year old cars.
Looking at each model in greater detail:
Alfa-Romeo 147 & Giulietta – it is disappointing to see the poor survival rate of the 147, having seemed a jolly little thing renting one in Italy, possibly because of the special frisson that one gets driving an Alfa in Italy. Although, even with the rose-tinted view that this gave, it never seemed to be a quality car. Its survival performance is pretty dreadful, with the “death curve” starting at only eight years and an ever increasing proportion of the survivals dying every year thereafter, until between thirteen and fourteen years of age over 35% of the survivors become scrap metal. If Alfista want a decent 147 for their collection they need to act soon. It is far too early to project the Giulietta survival rate.
Audi A3 – given that the A3 is effectively a premium version of the VW Golf, it is perhaps a little surprising that the A3 clearly lags Golf survival once the cars are more than a decade old, with a margin that increases over time, although the fact that the A3 gets the earlier generation change to the new VW Group platform slightly complicates the comparison. For 2001 cars, the gross survival rate differential between the two cars is 4.5%, which equates to a 6.5% higher probability of survival for the Golf. At present, there appears to be no great difference in survival rate at the transition between the First and Second Generation A3s. Naturally, it is too early to give an opinion on the Third Generation survival rate.
BMW 1 Series – given that there are relatively few 2011 F20/F21s and few 2012 registered E81/E87s, the transition between the two models should become easy to call, unfortunately the survival rate is still much too high at this relatively young age to assess the issue. The prospects appear excellent for the E81/E87 to set a new benchmark for longevity in the class, the survival rate for the earliest 2004 cars being 1.72% (gross) above that of 2004 Golfs, equivalent to a 1.97% higher probability of survival. But we will need a couple more years of data to confirm this, and the 1 Series’ survival rate is not suddenly going to tip into a screaming death curve (one can always hope as age has not leant any enchantment to the 1 Series’ pug-ugly looks in my view). So at present 1 Series owners can sit comfortably in the knowledge that not only is have a good chance of becoming the best surviving car in its market segment, but it is right up there as a contender for the coveted title of Britain’s ugliest car.
Fiat Bravo/Brava, Stilo & Bravo – Fiat deserve to be congratulated, in that they managed to replace the original Bravo/Brava, a real contender for the title of Britain’s worst surviving car with the Stilo a car that appears to have an equally poor survival rate: at the transition between the two models not a waver can be seen in what is not so much a “death curve”, but near vertical plunge to extinction. This is a real achievement in a perverse sort of way. The oldest surviving cars in our survey died at a rate of 55.5% of the surviving stock per annum. Given that these were figures for the end of 2015, this is definitely the last call for all those who want to save a UK Bravo/Brava to show future generations. When we viewed our present house, over ten years ago, the remains of one was in the garage, which was being sold off bit by bit on eBay: the son of the house had one on which some vital electrical component had failed and he had worked out that it was cheaper to buy another complete car to get the component that he wanted, and then make money selling other bits of it off on eBay. It is also the time for anyone who wants to save a Stilo for posterity to act. The new Bravo had not yet entered its death curve on the 2016 DfT figures, but was just at the point where one would expect one to start: when the 2017 figures, which should run to the end of 2016, are released by the DfT in couple of weeks’ time this will be one to watch. As we will see with the Panda, Fiat can do much better than this.
Ford Focus – a very solid performance in the PH survival stakes, across all incarnations of the Focus, showing the progress that Ford has made over the past two decades. The survival rate for Focuses over ten years old appears set to exceed that of the Golf, once the Golf Mk 4 drops off the end of our graph (see below). The only fly in the ointment is that it appears that the survival rate of the Mk 2 Focus is not quite up to that of the Mk 1, with the survival rate dropping by approximately 3% across the transition, although we what we do not yet know is whether the Mk 2 will follow the same “death curve” as the Mk 1. It is too early to yet call the Mk 2 to Mk 3 transition.
Honda Civic – given that the Sixth Generation Civic only appears for part of one year right at the beginning of our analysis, and formed only a minority of sales in that year one needs to be fairly tentative in one’s comments. However, I have disaggregated the Sixth and Seventh Generation figures out for 2001: the Sixth Generation had a 71.4% survival rate and the Seventh a 75.4% survival rate. Furthermore, the probability of a survivor being SORNed is 8.9% and 4.5% respectively. Accordingly, although both sets of figures are creditable, it would seem that the Seventh Generation represented an improvement over the Sixth, and the failure of the Civic to enter a ‘death curve’ as opposed to natural wastage is not the result of the Sixth Generation propping the tail of the figures up, indeed the contrary applies. The Seventh to Eighth Generation transition appears smooth. On present trends, it would appear as if a majority of Seventh and Eighth Generation Civics will still be on the roads on their twentieth birthdays, which will be some achievement.
Hyundai Elantra & i30 – another manufacturer who can do far better, as we will see when we get to the Getz (which has one of the best survival rates in its market segment). The Elantra just misses out from being the third worst survivor in its market segment: its 25.75% survival rate for 2001 cars is edged out by the Alfa 147s 25.45% rate. But at least 21.6% are taxed and on the road, as opposed to 19.0% for the Alfa. But that is the good news, at the transition between the Elantra and the first Generation i30, the i30 is performing even worse. This is another model for which we will need another year or two’s worth of figures to confirm the trend, but at the end of 2015 the earliest i30s are doing worse, even than Kias and Fiats of equivalent age: were the trend to continue it would mean that for all practical purposes early i30s would be extinct inside thirteen years. But let’s wait to see what this month’s figures show….
Kia Shuma, Cerato & C’eed – it is undoubtedly a good thing that Kias are now merely re-styled Hyundais, as Kia cars’ survival record as a unique manufacturer is the second worst of any that I have examined to date, only Daewoo beating it, and is consistently poor across all models examined (so far), as we will see in due course. Hopefully, current Kias will survive better, although personally I would want to see some evidence of it before slapping any money down on one. The Shuma’s 11.45% survival rate for 2001 registered cars is the worst of any car that I have examined in detail to date, and much as one would want to make excuses for it, it must be indicative of a fundamental build that was not equipped for durability in British conditions. The only positive thing that one can say is that 9.02% of all 2001 registered Shumas were taxed at the end of 2015, as opposed to 8.83% of Fiat Bravo/Bravas, which I would suggest indicates that the inherent survivability of the Kia is higher than the Fiat, but that Fiat owners are more attached to their cars. Fortunately, the Kia Cerato appears a much better prospect, at the transition between it and the Shuma, the step appears to be of the order of 20% gross, which means that an eleven-year-old Cerato is approximately 60% more likely to survive than a Shuma, which is an encouraging sign. The oldest Ceratos just dip under the Standard Reference Curve with what appears to be the start of steepening ‘death curve’, again another year or two of data will be required to see if its survival rate can keep in touch with that cars such as the Vauxhall Astra and Renault Megane. Although the transition between the Cerato and the C’eed is somewhat uneven, broadly, the C’eed appears to share the improved survival performance of the Cerato.
Mazda 323 & 3 – the 323 BH has just about the weirdest survival curve of anything that I have seen: make of it what you want, generally it is well below average, almost Megane-bad but then perks up for the oldest models to hit the Standard Reference Curve. Let’s call it as below average. All versions of the Mazda3 perform well, achieving above average survival rates, and on a par with the better surviving cars in the market segment.
Mercedes A Class – a good performance from the W168, putting it a clear fourth in the PH survival stakes in the market segment. But the transition to the W169 resulted in a drop in the survival rate at the transition with the W168 of around 2.5% gross, equivalent to a decrease of around 2.8% in survival probability at the transition. While survival rate of the W169 is still good, and well up with ‘best in class’, its ‘death curve’ commences at only six years old, albeit gently. Naturally, it is still far too soon to assess the survival performance of the, radically different, W176.
Peugeot 307 & 308 – a solid performance, with the survival rate pinned almost exactly to the overall reference trend line. A consistent performance across the transition between the 307 and 308, although it appears that the survival rate for the 307 might be around 4% better than that for the 308 as the cars approach the end of their first decade, so the long-term survival performance might drop a little as the 308s age.
Renault Megane – not a good survival performance; however, it seems that the main problem with survival rates afflicted the Megane 2, and the early signs are that the Megane 3 might well be more durable, although one needs to exercise caution when attempting to link a high survival rate in the first few years to long-term durability. The Megane 1 is already rare on our roads, with the Megane 2 are set to follow it over the next few years, most of which are now no longer shaking their backsides! The survival rate dropped by 15-20% gross at the transition between the Megane 1 and the Megane 2, which given that the survival rate of Megane 1 is not particularly impressive means that at thirteen years a Megane 1 has around twice the survival rate of a Megane 2.
Seat Leon – as one would expect the Golf’s Spanish sister, lags some way below both of its German sisters, but is pinned closely to the average survival rate curve for the market segment. The transition between the First and Second generations appears reasonably smooth, lacking the downward blip of the Mk 4 to 5 transition for the Golf, possibly all of those crashed First Generation Leon Cupras has kept the First Generation survival rate down? A competent and unremarkable performance: a Leon is bit more likely to survive than a 307 or an Astra.
Toyota Corolla & Auris – zzzzzzzzzzzzzzz, sorry fell asleep thinking too deeply about the Toyota Corolla. As with other Toyota models, an impressive survival rate for the earlier models in the survey, drops off sharply for cars built after the mid-2000s: 2005 in the case of the Corolla. Is this enough, can I move on please? Alright then, key stat: one had to buy a post-2009 Auris to buy a Corolla/Auris with a better survival rate than a 2005 Corolla, as at 31 December 2015.
Vauxhall Astra – Some might regard the Astra’s performance in the PH survival stakes as symptomatic of the car itself: average, competent, and unspectacular. The Astra’s survival rate is pinned closely to the Standard Reference Curve, but lags the class average. The survival rate appears to be unchanged by the regenerations from Mk IV to Mk V.
Volkswagen Golf – It is clear that there are two distinct curves to the graph, with that up to the last full year of Mk 4 sales in 2003, having a higher trend than that from 2005 onwards (the first full year of Mk 5 sales). This is no surprise to me, having ownership experience either side of the Mk 4/5 divide, I have been of the opinion for some years that the durability and quality of components used reached a high point with the Mk 4, and that the Mk 5 was part of the start of a drastic deterioration in underlying product quality for the VW Group as a whole. Having said that the Mk 4 is a fairly stodgy drive, in my view, whereas the Mk 5 is a lot sharper and more fun to drive – it just depends on whether one is paying for one’s own motoring or not. I predict that the overall survival rate of Golfs is likely to fall over time, as the Mk 4s fall off the end of our graph. Naturally, it is too early to comment on the relative survival rates of the Mk 6 and the Mk 7, although the Mk 6 is really just a mid-lift facelift of the Mk 5.
I will give it a couple of days for this post to be read and discussed, as necessary, then I will post the luxury car analysis, which I think is good to go as it was. There will then be a bit of a pause before I repost the Supermini analysis, as I will be swapping out the Peugeot 106 line for the 206 line, in line with the requests. To match this, I will also swap out the Hyundai Getz/i10 line for the i20 line (which at least will bump up the city car survival rate). As I am rather busy at present this might take a while.
Truckosaurus said:
Top Stating Car Nut.
It is interesting that the Land Cruiser, which is meant to be the sturdiest 4x4, at 56% and the Frontera, which is meant to be the most unreliable 4x4, at 78%.
I suspect the lack of 'cruisers is due to them being exported.
Is the number of exported vehicles available anywhere?
I think that you are spot on Truckosaurus - in my view the Land Cruiser is one of the handful of models whose survival rates are badly affected by exports, you will see this impact on the luxury car analysis which I will post up, once the discussion on family hatchbacks appears to have come to a conclusion. Fortunately, there is a dodge that I discovered to get round this problem, will use the same when we come to luxury SUVs. It is interesting that the Land Cruiser, which is meant to be the sturdiest 4x4, at 56% and the Frontera, which is meant to be the most unreliable 4x4, at 78%.
I suspect the lack of 'cruisers is due to them being exported.
Is the number of exported vehicles available anywhere?
There was a report by that a German consultancy firm produced for the European Commission in 2011 that I found that did quantify it, but then some more digging revealed that the number is highly variable, and that 2010 (the year that the analysis was based on) had been a particularly low year. Will find the link to it again.
Mind you one of the local farmers was often seen in his fields in a Land Cruiser, before it suddenly became a quad bike last year. The story that I got secondhand, was that the hill descent system failed, and that screws the brakes up, so he scrapped it.
Edited by Car_Nut on Tuesday 4th April 12:32
sealtt said:
The net flow of vehicles imported / exported will be highly dependent on foreign exchange rates and governement taxes/regs between the U.K. And any given country, so I would expect one year's figures to be quite unreliable as an indicator for a general export/import %.
Agree totally.LUXURY CARS
This is a lightly re-worked version of my earlier post, in which none of the data of graphs differ: changes have been confined to text editing to reflect the different discussions that have taken place on the thread, to remove thread specific references, and the fact that we are low higher up the subject’s learning curve.
I have selected the following cars in this market segment:
The variants of these models included in the 2001 to 2015 database are as follows:

It can be seen that sales of these five models have declined, the decrease being from 9,720 in 2001 to 6,026 in 2015, considering Great Britain only. This is a decrease of some 38%. It can also be seen that the main fall corresponded with the 2008 financial crash, since when there has been a slight recovery. The relevant numbers from 2007 to 2009 were 8,383, 6,304, and 4,515 respectively. Given the target market for these cars, I suggest that this is unsurprising. I would also suggest that in this sector of the market there are other choices that could be made outwith the segment, of which the Range Rover is the most obvious, and these have been abstracting sales.
It can also be seen that from 2010 onwards, sales of the Lexus LS have decreased to a level that I would consider below that at which analysis is statistically significant, the nadir (to date) being the 21 vehicles registered in 2012. Accordingly, although I have stuck the survival curve for LSs registered up to 2014 on the graph, for reference, I have not analysed the model post-2010.
Moving onto the survival curve for 2001 to 2014:

As can be seen, the results are somewhat erratic. This appears to be as a result of the impact of used exports; while it affects only a minority of cars, it is still sufficient to confuse the results, when the number of survivors is high. As we have discussed, used car export rates are somewhat volatile, as the survival rates peak for cars registered in the 2008-10 period (2010 for the Audi A8, 2009 for the Jaguar XJ and Mercedes S Class, 2007-8 for the BMW 7 series) it would imply that the used car exports are higher than they were about five years ago. Clearly, this is a grossly over-simplistic assertion, as the used car export market is not a single entity, but a diverse network of different markets, each with its own typical vehicle age profile.
I presume that, again this window of reduced exports was tied into the 2008 crash and its aftershocks, as another interesting finding is that about 5% of new registrations of all of these cars disappear in the first year (presumably being only registered first in the UK as a tax saving wheeze), and that a total of 10-15% disappear over the first four years. This applies to all of these cars, the percentage of UK survivors for cars registered in 2015, 2014, 2013 and 2012, respectively for these models, as at 31 December 2015, are as follows:
It is of note that one could assume that that the average age of the 4.3% to 7.7% of cars that disappear in the first year is just six months. It would appear that fewer XJs are exported as used cars than their German rivals, but that the difference is not great.
Moving on to zooming in on the 2001 to 2009 portion of the graph that is more interesting:
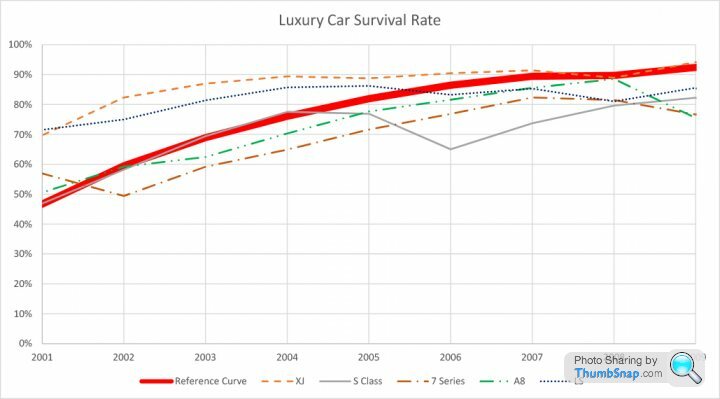
Well this is slightly more useful, but the graph is still rather suffering from the impact of car exports. Accordingly, to try and get a handle on survivability I have looked at the percentage of British survivors that are still taxed. The theory being that this type and age of car is unlikely to be stashed away by collectors, and that, for cars of this nature, many of their owners are reluctant to send them to the scrappy when they are no longer roadworthy, and thus the proportion that are taxed, and thus roadworthy, is an indicator of survivability. In the graph, I am afraid that I have had to supress the zero for legibility, which is a practice that I dislike as it distorts the presentation of relative values (which is why this is common trick of tabloid newspapers, of course).

Drawing firm conclusions in this market segment is less easy than for anything else that we have examined thus far. However, I consider that we could draw the following conclusions:
Audi A8: there are two distinct trend curves, discernible in both the survival rate curves and in the probability of keeping an A8 on the road: that for 2001 and 2002, mainly First Generation cars, being appreciably above that for Second Generation cars from 2003 onwards: there is an (approx.) 6% reduction in the survival rate once the Second Generation cars appear. It is tempting to ascribe this to the naughties deterioration in the quality of Volkswagen Group products that several of us on this website believe in, but maybe an expert on the model can enlighten us? It is not yet possible to determine any difference in the inherent survival rates of Second and Third Generation cars. Overall the chances of keeping an A8 on the road are well aligned to that of the 7 Series and S Class: a little above them in the case of a First Generation car and a little below them in the case of a Second Generation Car.
BMW 7 Series: one could tentatively draw a conclusion that E38 survives better than the E65, given that 2001 data is dominated by the E38, but it is dangerous to draw firm conclusions on the basis of only one year’s data. But we can certainly say that there does appear to be a significant issue with keeping 2002 E65s on the road, the probability of which is some 26% below that of 2003 cars, and 18% lower than 2001 cars, but that from 2003 onwards the position improves dramatically, although the trend line is below the single point of E38 data. Indeed, it is even possible that the 2001 E38 data is dragged down by the inclusion of some early E65s. Again, can any experts in the model enlighten us please? It is not yet possible to draw any conclusions over the inherent F01 survival rate. Apart from the 2002 blip the chances of keeping a 7 Series on the road seem broadly aligned with it two great German competitors.
Jaguar XJ: there is clear and substantial step up in survival rates with the introduction of the X350, the gross differential at the step appearing to be of the order of 12%, gross: one of the largest jumps we have seen in a model. The survival of the earlier X308 (on the basis of the proportion taxed) is comparable with its German rivals, but inferior to the Lexus LS, but the X350 appears to have survivability that increases over its rivals as time goes by: there is a noticeably flatter curve to the probability of being taxed against age for the X350 than is the case for the other cars considered, if this were to continue for the next couple of years surviving XJ would start to greatly outnumber their rivals, other than pre-2004 Lexus LSs, as they pass their fifteenth birthdays. It is not yet possible to determine whether the inherent survival rate will be affected by the transitions to the X358 and X351.
Lexus LS: the probability of an LS being still roadworthy drops sharply for cars built from 2004 onwards, this corresponds with a mid-life update of the XF30. This is, however, less apparent in the overall survival rate. Pre-2004 LS have impressive survival and roadworthiness rates that are comparable with those for the X350 Jaguar XJ, and way better than everything in the pre-X350 era. Post 2004, the proportion of LSs that are taxed are comparable with their German rivals. A deterioration in the survival rate of Toyota products in the mid-2000s, is something that we saw with the Corolla, and we will see it again with other Toyota models, this is a theme that I will return to as the evidence piles up. If is too early to draw any definitive conclusions on the relative inherent survivability between the XF30 and the XF40, although it appears that there might be the beginnings of another downward blip at the model change, but time will tell.
Mercedes S Class: there might be a slight downward blip in survivability in the transition between the W220 and the W221, but we would need another couple of years of data to confirm or deny this. Roadworthiness and survival rates for the W220 wobble slightly in 2002, but not as dramatically as is the case for the A8. It might be that the improvements in the figures for 2003 is as a result of improvements in Mercedes quality following the well-known millennial era issues for the brand. In general, as the cars age, the proportion of taxed Mercedes is fractionally above that of the other two German brands but below than of Jaguars and pre-2004 Lexus LSs, other than in the case of First Generation Audi A8s and X308 Jaguar XJs.
Overall, the XJ and LS retain a clear survivability advantage over their rivals indicated in my earlier analysis of the howmanyleft.com data, but this is reduced. The three German cars are closely matched, other than a wobble from the 7 Series in 2002, following the introduction of the E65.
I will be tackling something more straightforward next! Hopefully, a family holiday in a couple of weeks will enable me to polish off the updated supermini analysis: an ideal marriage, while my wife reads a book in the evenings, in the holiday cottage, I will be tapping away at car statistics on my laptop. In the meantime I have a few interesting graphs and tables that I prepared earlier that might be of interest.
As ever, please feel free to post up any interesting survival stats of your own: I will be as interested as anybody else to see them, and am perfectly happy not to be a one man show.
This is a lightly re-worked version of my earlier post, in which none of the data of graphs differ: changes have been confined to text editing to reflect the different discussions that have taken place on the thread, to remove thread specific references, and the fact that we are low higher up the subject’s learning curve.
I have selected the following cars in this market segment:
- Audi A8
- BMW 7 Series
- Jaguar XJ
- Lexus LS
- Mercedes S Class
The variants of these models included in the 2001 to 2015 database are as follows:
- Audi A8: First Generation to 2002, Second Generation 2002 to 2010, Third Generation 2010 onwards.
- BMW 7 Series: E38 to 2001, E65 2001 to 2008, F01 2008 to 2015.
- Jaguar XJ: X308 to 2002, X350/X358 2002 to 2009 (X350 to X358 transition 2007), X351 2009 onwards.
- Lexus LS: XF30 to 2006 (LS 430), XF40 (LS 460) 2006 to date.
- Mercedes S Class: W220 to 2006, W221 2006 to 2013, W22 2013 onwards.
It can be seen that sales of these five models have declined, the decrease being from 9,720 in 2001 to 6,026 in 2015, considering Great Britain only. This is a decrease of some 38%. It can also be seen that the main fall corresponded with the 2008 financial crash, since when there has been a slight recovery. The relevant numbers from 2007 to 2009 were 8,383, 6,304, and 4,515 respectively. Given the target market for these cars, I suggest that this is unsurprising. I would also suggest that in this sector of the market there are other choices that could be made outwith the segment, of which the Range Rover is the most obvious, and these have been abstracting sales.
It can also be seen that from 2010 onwards, sales of the Lexus LS have decreased to a level that I would consider below that at which analysis is statistically significant, the nadir (to date) being the 21 vehicles registered in 2012. Accordingly, although I have stuck the survival curve for LSs registered up to 2014 on the graph, for reference, I have not analysed the model post-2010.
Moving onto the survival curve for 2001 to 2014:
As can be seen, the results are somewhat erratic. This appears to be as a result of the impact of used exports; while it affects only a minority of cars, it is still sufficient to confuse the results, when the number of survivors is high. As we have discussed, used car export rates are somewhat volatile, as the survival rates peak for cars registered in the 2008-10 period (2010 for the Audi A8, 2009 for the Jaguar XJ and Mercedes S Class, 2007-8 for the BMW 7 series) it would imply that the used car exports are higher than they were about five years ago. Clearly, this is a grossly over-simplistic assertion, as the used car export market is not a single entity, but a diverse network of different markets, each with its own typical vehicle age profile.
I presume that, again this window of reduced exports was tied into the 2008 crash and its aftershocks, as another interesting finding is that about 5% of new registrations of all of these cars disappear in the first year (presumably being only registered first in the UK as a tax saving wheeze), and that a total of 10-15% disappear over the first four years. This applies to all of these cars, the percentage of UK survivors for cars registered in 2015, 2014, 2013 and 2012, respectively for these models, as at 31 December 2015, are as follows:
| Car | 2015 | 2014 | 2013 | 2012 |
|---|---|---|---|---|
| Audi A8 | 94.0% | 92.3% | 84.3% | 85.5% |
| BMW 7 Series | 93.4% | 91.7% | 86.4% | 85.6% |
| Jaguar XJ | 95.7% | 94.3% | 94.8% | 89.9% |
| Mercedes S Class | 94.1% | 84.4% | 87.7% | 85.3% |
It is of note that one could assume that that the average age of the 4.3% to 7.7% of cars that disappear in the first year is just six months. It would appear that fewer XJs are exported as used cars than their German rivals, but that the difference is not great.
Moving on to zooming in on the 2001 to 2009 portion of the graph that is more interesting:
Well this is slightly more useful, but the graph is still rather suffering from the impact of car exports. Accordingly, to try and get a handle on survivability I have looked at the percentage of British survivors that are still taxed. The theory being that this type and age of car is unlikely to be stashed away by collectors, and that, for cars of this nature, many of their owners are reluctant to send them to the scrappy when they are no longer roadworthy, and thus the proportion that are taxed, and thus roadworthy, is an indicator of survivability. In the graph, I am afraid that I have had to supress the zero for legibility, which is a practice that I dislike as it distorts the presentation of relative values (which is why this is common trick of tabloid newspapers, of course).
Drawing firm conclusions in this market segment is less easy than for anything else that we have examined thus far. However, I consider that we could draw the following conclusions:
Audi A8: there are two distinct trend curves, discernible in both the survival rate curves and in the probability of keeping an A8 on the road: that for 2001 and 2002, mainly First Generation cars, being appreciably above that for Second Generation cars from 2003 onwards: there is an (approx.) 6% reduction in the survival rate once the Second Generation cars appear. It is tempting to ascribe this to the naughties deterioration in the quality of Volkswagen Group products that several of us on this website believe in, but maybe an expert on the model can enlighten us? It is not yet possible to determine any difference in the inherent survival rates of Second and Third Generation cars. Overall the chances of keeping an A8 on the road are well aligned to that of the 7 Series and S Class: a little above them in the case of a First Generation car and a little below them in the case of a Second Generation Car.
BMW 7 Series: one could tentatively draw a conclusion that E38 survives better than the E65, given that 2001 data is dominated by the E38, but it is dangerous to draw firm conclusions on the basis of only one year’s data. But we can certainly say that there does appear to be a significant issue with keeping 2002 E65s on the road, the probability of which is some 26% below that of 2003 cars, and 18% lower than 2001 cars, but that from 2003 onwards the position improves dramatically, although the trend line is below the single point of E38 data. Indeed, it is even possible that the 2001 E38 data is dragged down by the inclusion of some early E65s. Again, can any experts in the model enlighten us please? It is not yet possible to draw any conclusions over the inherent F01 survival rate. Apart from the 2002 blip the chances of keeping a 7 Series on the road seem broadly aligned with it two great German competitors.
Jaguar XJ: there is clear and substantial step up in survival rates with the introduction of the X350, the gross differential at the step appearing to be of the order of 12%, gross: one of the largest jumps we have seen in a model. The survival of the earlier X308 (on the basis of the proportion taxed) is comparable with its German rivals, but inferior to the Lexus LS, but the X350 appears to have survivability that increases over its rivals as time goes by: there is a noticeably flatter curve to the probability of being taxed against age for the X350 than is the case for the other cars considered, if this were to continue for the next couple of years surviving XJ would start to greatly outnumber their rivals, other than pre-2004 Lexus LSs, as they pass their fifteenth birthdays. It is not yet possible to determine whether the inherent survival rate will be affected by the transitions to the X358 and X351.
Lexus LS: the probability of an LS being still roadworthy drops sharply for cars built from 2004 onwards, this corresponds with a mid-life update of the XF30. This is, however, less apparent in the overall survival rate. Pre-2004 LS have impressive survival and roadworthiness rates that are comparable with those for the X350 Jaguar XJ, and way better than everything in the pre-X350 era. Post 2004, the proportion of LSs that are taxed are comparable with their German rivals. A deterioration in the survival rate of Toyota products in the mid-2000s, is something that we saw with the Corolla, and we will see it again with other Toyota models, this is a theme that I will return to as the evidence piles up. If is too early to draw any definitive conclusions on the relative inherent survivability between the XF30 and the XF40, although it appears that there might be the beginnings of another downward blip at the model change, but time will tell.
Mercedes S Class: there might be a slight downward blip in survivability in the transition between the W220 and the W221, but we would need another couple of years of data to confirm or deny this. Roadworthiness and survival rates for the W220 wobble slightly in 2002, but not as dramatically as is the case for the A8. It might be that the improvements in the figures for 2003 is as a result of improvements in Mercedes quality following the well-known millennial era issues for the brand. In general, as the cars age, the proportion of taxed Mercedes is fractionally above that of the other two German brands but below than of Jaguars and pre-2004 Lexus LSs, other than in the case of First Generation Audi A8s and X308 Jaguar XJs.
Overall, the XJ and LS retain a clear survivability advantage over their rivals indicated in my earlier analysis of the howmanyleft.com data, but this is reduced. The three German cars are closely matched, other than a wobble from the 7 Series in 2002, following the introduction of the E65.
I will be tackling something more straightforward next! Hopefully, a family holiday in a couple of weeks will enable me to polish off the updated supermini analysis: an ideal marriage, while my wife reads a book in the evenings, in the holiday cottage, I will be tapping away at car statistics on my laptop. In the meantime I have a few interesting graphs and tables that I prepared earlier that might be of interest.
As ever, please feel free to post up any interesting survival stats of your own: I will be as interested as anybody else to see them, and am perfectly happy not to be a one man show.
Edited by Car_Nut on Tuesday 4th April 23:39
One of the pieces of the picture is to understand how the numbers of popular models decay away over time. I have a couple of examples of this: the Metro/Rover 100 and the Saab 9000.
At one time Metros were everywhere, being Britain’s best-selling car in its early life. Introduced in 1980 and finally discontinued in 1998, they are now extinct for practical purposes. The graph below shows the number registered between 1994 and 30 September 2016 and is fairly self- explanatory.

I have carried out a little more detailed analysis of the Saab 9000 (1984-98). As we can see from the graph below, the maximum number registered in Britain peaked in 1995, two to three years before the model was discontinued, as dwindling sales failed to keep up with attrition.
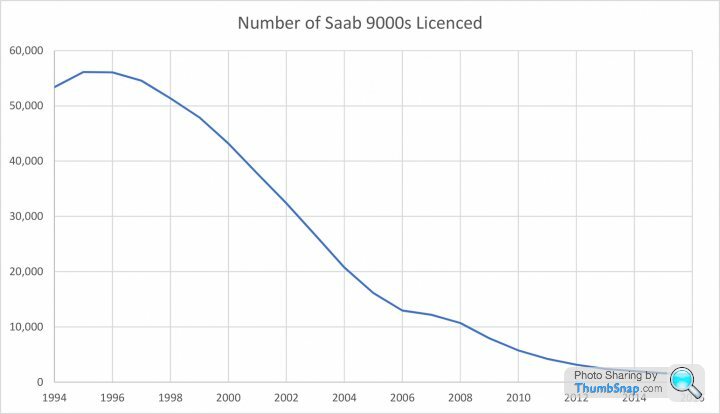
Something that I have not shown before is some analysis that I undertook looking at the survival of particular variants. What is notable is the incredibly uneven way that the grim reaper has attacked different variants. As we have seen before, it is the more “interesting” variants that tend to survive best.
At one time Metros were everywhere, being Britain’s best-selling car in its early life. Introduced in 1980 and finally discontinued in 1998, they are now extinct for practical purposes. The graph below shows the number registered between 1994 and 30 September 2016 and is fairly self- explanatory.
I have carried out a little more detailed analysis of the Saab 9000 (1984-98). As we can see from the graph below, the maximum number registered in Britain peaked in 1995, two to three years before the model was discontinued, as dwindling sales failed to keep up with attrition.
Something that I have not shown before is some analysis that I undertook looking at the survival of particular variants. What is notable is the incredibly uneven way that the grim reaper has attacked different variants. As we have seen before, it is the more “interesting” variants that tend to survive best.
| Variant | Max No Registered | 2016 Survivors | Survival Rate |
|---|---|---|---|
| 9000 CD AUTO | 309 | 4 | 1.29% |
| 9000 CD CARLSSON TURBO | 85 | 4 | 4.71% |
| 9000 CD CARLSSON TURBO A | 249 | 10 | 4.02% |
| 9000 CD GRIFFIN 3.0 V6 | 3 | 1 | 33.33% |
| 9000 CD GRIFFIN 3.0 V6 A | 237 | 8 | 3.38% |
| 9000 CD GRIFFIN TURBO | 3 | 1 | 33.33% |
| 9000 CD GRIFFIN TURBO AUTO | 93 | 15 | 16.13% |
| 9000 CD TURBO | 42 | 1 | 2.38% |
| 9000 CD TURBO AUTO | 24 | 0 | 0.00% |
| 9000 CD XS | 154 | 6 | 3.90% |
| 9000 CD XS I | 533 | 2 | 0.38% |
| 9000 CD XS I AUTO | 168 | 0 | 0.00% |
| 9000 CDE | 822 | 8 | 0.97% |
| 9000 CDE AUTO | 1,007 | 6 | 0.60% |
| 9000 CDE ECOPOWER | 400 | 21 | 5.25% |
| 9000 CDE ECOPOWER AUTO | 578 | 25 | 4.33% |
| 9000 CDE GRIFFIN | 10 | 1 | 10.00% |
| 9000 CDE GRIFFIN A | 437 | 19 | 4.35% |
| 9000 CDE TURBO | 446 | 9 | 2.02% |
| 9000 CDE TURBO AUTO | 655 | 14 | 2.14% |
| 9000 CDI | 2,142 | 23 | 1.07% |
| 9000 CDI AUTO | 1,207 | 38 | 3.15% |
| 9000 CDI S | 1,552 | 7 | 0.45% |
| 9000 CDI S AUTO | 1,013 | 6 | 0.59% |
| 9000 CDS TURBO | 152 | 0 | 0.00% |
| 9000 CDS TURBO AUTO | 73 | 1 | 1.37% |
| 9000 CS | 156 | 12 | 7.69% |
| 9000 CS AUTO | 122 | 16 | 13.11% |
| 9000 CS I | 2,509 | 30 | 1.20% |
| 9000 CS I AUTO | 698 | 8 | 1.15% |
| 9000 CS TURBO | 2,435 | 100 | 4.11% |
| 9000 CS TURBO AUTO | 2,038 | 97 | 4.76% |
| 9000 CS XS | 187 | 3 | 1.60% |
| 9000 CS XS I | 440 | 1 | 0.23% |
| 9000 CS XS I AUTO | 109 | 1 | 0.92% |
| 9000 CSE | 2,080 | 46 | 2.21% |
| 9000 CSE 3.0 V6 | 6 | 1 | 16.67% |
| 9000 CSE 3.0 V6 AUTO | 225 | 5 | 2.22% |
| 9000 CSE ANNIVERSARY | 1,612 | 307 | 19.04% |
| 9000 CSE AUTO | 360 | 6 | 1.67% |
| 9000 CSE T ANNIVERSARY | 141 | 30 | 21.28% |
| 9000 CSE T ANNIVERSARY AUTO | 199 | 41 | 20.60% |
| 9000 CSE TURBO | 5,032 | 241 | 4.79% |
| 9000 CSE TURBO AUTO | 3,100 | 185 | 5.97% |
| 9000 I | 8,350 | 26 | 0.31% |
| 9000 I 16 5D A | 2,056 | 3 | 0.15% |
| 9000 I AUTO | 101 | 2 | 1.98% |
| 9000 I SE | 263 | 4 | 1.52% |
| 9000 I SE AUTO | 187 | 2 | 1.07% |
| 9000 S | 3,219 | 13 | 0.40% |
| 9000 S AUTO | 1,160 | 7 | 0.60% |
| 9000 S TURBO | 491 | 3 | 0.61% |
| 9000 S TURBO AUTO | 117 | 1 | 0.85% |
| 9000 TURBO 16 5D A | 770 | 0 | 0.00% |
| 9000 TURBO 16 5D M | 3,931 | 24 | 0.61% |
| 9000 TURBO 16 SE | 319 | 4 | 1.25% |
| 9000 TURBO 16 SE AUTO | 1,362 | 5 | 0.37% |
| 9000 TURBO CD S | 156 | 1 | 0.64% |
| 9000 TURBO CD S AUTO | 46 | 0 | 0.00% |
| 9000 TURBO CS S | 785 | 5 | 0.64% |
| 9000 TURBO CS S AUTO | 235 | 4 | 1.70% |
| 9000 XS I | 745 | 5 | 0.67% |
| 9000 XS I AUTO | 219 | 1 | 0.46% |
Edited by Car_Nut on Monday 10th April 23:48
Funky Panda said:
I see the final 9000 CD turbo on a semi regular basis. Are the sample sizes here not really susceptible to incorrect registration by model type?
Top spotting! On your substantive point, while I think that we always need to be very cautious about small sample sizes. Given that, in general, these figures are the just the same sets of registration data rolled over from one year to another, through the road tax renewal process with which we are all familiar, I don't think that this applies here. The only times that records change is for the odd import and the odd bit of record correction. So I think that this table is valid. Indeed, even if one were to confine the analysis purely to the more numerous variants, we can still see enormous disparities, e.g. Turbo 16 SE Auto: 5 survivors out of peak post 1994 population of 1,362, c.f. CSE Anniversary 307 survivors out of a peak population of 1,612.
The other point that I should have made last night is that the survival rate is also influenced fairly clearly by the age range of the variant within the model's life span.
blearyeyedboy said:
^ Perhaps your point might be made well with something not as populist as a Metro/Rover 100, but less rare than a Saab 9000 to avoid the perils of really small sample sizes?
(A Peugeot 406, for example? I imagine there are more 3.0 V6 coupés proportionally driving around than 1.9 diesel base models...)
Slightly perplexed as to how a Peugeot 406 would show better what a Saab 900 has already demonstrated. (A Peugeot 406, for example? I imagine there are more 3.0 V6 coupés proportionally driving around than 1.9 diesel base models...)
The Metro example curve was just to get a model's decay curve on one of the largest sample sizes possible, and thus a nice smooth curve, for something that is sure to have died, as they rotted like hell. Don't think that it would be really valid to look at survival of the more interesting variants, as I am sure that most MG Metro Turbos have run out of serviceable gearboxes by now.
Apologies for the sudden disappearance of my posts, firstly as a result of a sudden peak in my workload, and secondly as result of an extremely unpleasant divorce that I am still mired in (my advice would be to never marry anybody with "mild depression", as over the years it has deteriorated into increasingly severe mental health issues, which then makes the divorce ten times worse). But anyway that is my problem not yours.
What this means is that I am afraid that I don't think that this is going to continue, although I am mulling over the idea of trying to interest a magazine publisher in publishing a complete annual, as cheap bookstand fodder, as I desperately need the money.
I do have one thing to report: the survival rate of X350 Jaguar XJs fascinated me, and even though it was not my sort of car I thought that ought to put my money where my mouth was, so in June last year I bought a 95,500 mile 2005 XJ8 4.2 Sovereign LWB, for family holidays and also with the intent of using it as an occasional wedding hire car. In line with the object of the exercise, I bought one at the bottom end of the market for £5.5k and sold it last week to a gentleman from Leamington Spa for £7k, as I needed the money. Unfortunately, as I had decided that it was a long term keeper I spent several thousand on works for its long term preservation, and bringing it up to my standards, so I am out of pocket, but then I got a family holiday to the South of France last year and a holiday in Scotland with the children, as well as over 10,000 miles of very enjoyable motoring.
It was a fairly typical car in that its first owner maintained it properly over several years and 73,000 miles of ownership and it then fell into the hands of the impecunious and image conscious, giving it a 17,000 mile, 4.5 year 'maintenance holiday'. Despite this, the only thing that ever went wrong in my ownership was a rear parking sensor failure, that eventually cost £1,000 to fix after replacement of the rear parking sensor wiring loom, and all four sensors - it is a still a £65,000 car when things go wrong! Other than that it behaved faultlessly, and everything on it worked. It was easily the best engineered and assembled car that I have ever owned (grossly over-engineered in places), so one can see why the survival rate is so high. QED. (But do not buy a diesel as the engine is prone to expensive bottom end failures - stick to the V8s).
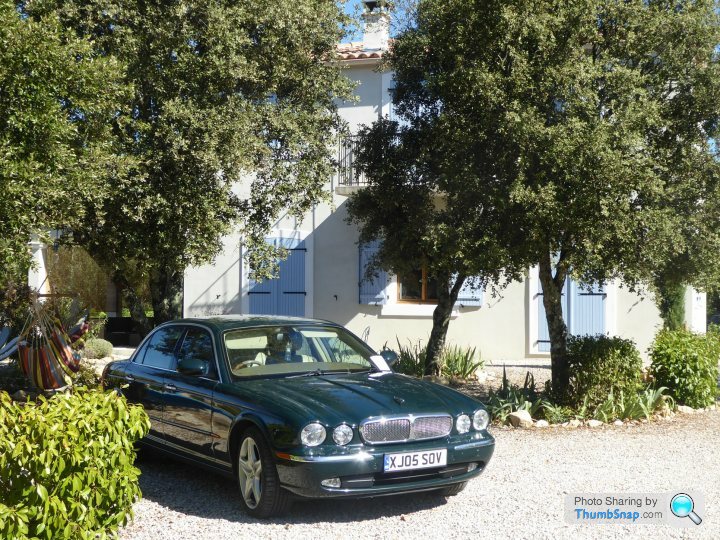
Edited by Car_Nut on Wednesday 7th November 12:40
Edited by Car_Nut on Wednesday 7th November 12:43
Edited by Car_Nut on Wednesday 7th November 12:57
Gassing Station | General Gassing | Top of Page | What's New | My Stuff