Dodge Viper GTS on the rollers
Discussion


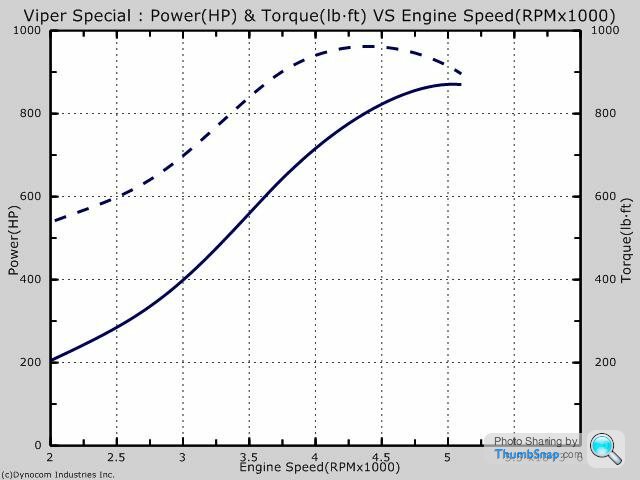
I had the pleasure of pushing the rollers yesterday with a Dodge Viper special, two stage twin turbo and 9.5 litres, first stage 1000lbs/ft and 1000 bhp, second stage 1500 bhp. I decided to keep it to the first stage to 'love my dyno'.
Pic shows the Viper on the rollers.

I decided to use the new chocks we bought for Christmas...suitable for trucks and light aircraft it said on the box! Also had straps holding the 'chassis' rear of the axle to our main door as well as the usual ones in view and downward ones at back of car.
Ran a few pulls with increasing load to spool up the twin turbos. I use ear protectors so was oblivious of what I am told is the loudest car we have ever run, 188 mph in 5th with a gear to go!
Will post graph when I get to work in an hour or so and see if the rollers have cooled down yet
Peter
Pic shows the Viper on the rollers.
I decided to use the new chocks we bought for Christmas...suitable for trucks and light aircraft it said on the box! Also had straps holding the 'chassis' rear of the axle to our main door as well as the usual ones in view and downward ones at back of car.
Ran a few pulls with increasing load to spool up the twin turbos. I use ear protectors so was oblivious of what I am told is the loudest car we have ever run, 188 mph in 5th with a gear to go!
Will post graph when I get to work in an hour or so and see if the rollers have cooled down yet
Peter
Hi Stan
Coast down test, knock it into neutral at test speed and use negative acceleration rate. Folk argue this figure is way too low but no one seems to have any real test data on what losses really are, just a load of guesses
We use the wheel hp and coast down losses to compare like for like. For instance, if we get another Viper in with same tyre sizes and get double the losses we know something aint right!
Peter
Hi again Stan
I think the problem is folk want to know what the flywheel power is when it is the wheel power which sends the car along, maybe this is the fault of the manufacturers for wanting to give the biggest number to the customers, remember the 60s/70s ridiculously high engine power claims?
Folk criticize the rolling road as a means of power measurement and cite super accurate engine dynos as the definitive power test tool. The rolling road is a tool at the end of the day and as long as it gives the same readings day in and day out that means it is doing its job. If we alter something and it shows the positive or negative effect the same every time then we are getting repeatable results and can use it for development work at a fraction of the time needed for engine dyno tuning.
We have invested in a 'super accurate' SF901PRO complete setup, even when this is commissioned I do not expect to get a definitive what is the difference between fly and wheels. We are getting nearer to sorting the dyno but it is sapping time and money to sort the test cell and building (not for the faint hearted 'at home in the garage' tuner). We have massive extract fan holes in the walls with suitable security doors when not in use, same for the induction fan, we also have to make the downwind side of the extraction fans safe in case of engine failure and subsequent egress of flame etc! Exraction fan holes are 750mm each, induction 650mm. The exhaust pipes are now fitted, they are 110mm tube! I attach a pic of the silencers outside my main unit after we had prepped em for wall mounting. I am guessing labour and parts will come to around £6000-7000 for installation let alone the amount three of us have invested in the dyno!

Martin spent the day with us yesterday and says 'hello' to you.
Peter
I think the problem is folk want to know what the flywheel power is when it is the wheel power which sends the car along, maybe this is the fault of the manufacturers for wanting to give the biggest number to the customers, remember the 60s/70s ridiculously high engine power claims?
Folk criticize the rolling road as a means of power measurement and cite super accurate engine dynos as the definitive power test tool. The rolling road is a tool at the end of the day and as long as it gives the same readings day in and day out that means it is doing its job. If we alter something and it shows the positive or negative effect the same every time then we are getting repeatable results and can use it for development work at a fraction of the time needed for engine dyno tuning.
We have invested in a 'super accurate' SF901PRO complete setup, even when this is commissioned I do not expect to get a definitive what is the difference between fly and wheels. We are getting nearer to sorting the dyno but it is sapping time and money to sort the test cell and building (not for the faint hearted 'at home in the garage' tuner). We have massive extract fan holes in the walls with suitable security doors when not in use, same for the induction fan, we also have to make the downwind side of the extraction fans safe in case of engine failure and subsequent egress of flame etc! Exraction fan holes are 750mm each, induction 650mm. The exhaust pipes are now fitted, they are 110mm tube! I attach a pic of the silencers outside my main unit after we had prepped em for wall mounting. I am guessing labour and parts will come to around £6000-7000 for installation let alone the amount three of us have invested in the dyno!
Martin spent the day with us yesterday and says 'hello' to you.
Peter
Hi Stan
Not tried the torque calcs on your program yet. Dynocom correction we use is to SAE J1349.
We haven't tried the Windyn software which came with the SF901 yet, may consider the Performance Trends SF901 specific software.
http://performancetrends.com/super_flow_dyno_data_...
I feel folk think transmission losses are more than they really are. A friend who worked at Rover told me if people really knew how little was lost through transmission they would be surprised! We think the real culprits for power losses are tyre width, compound and speed, hence the 50+ bhp losses with the Viper..188 mph and very very wide tyres! Anyone who does not make allowance for tyre speed and width and compound is weeing into the wind with transmission loss percentage guesstimates.
We have rigged up the dyno cell so we can hopefully run full ex systems as will be used in the car to test engines.
Peter
Hi Carl
I know my stepson, Keith who took the pic I used did not do a video, am awaiting to see if my son took any videos and will ask if Ollie did one when I see him Tuesday. My son left the unit after the first few runs before I did the run graphed. The pressure changes at the back of the car gave him a kind of motion sickness and a headache!
Nice car Carl and quite brutal, even more so with the second stage of boost I imagine! Carl N and Ollie must have balls to map it on the road! The car only just fitted in the unit and on the rollers...what a monster!
Problem I have with transmission losses, all guess work. I am not sure the transmission will lose more under load, with more power the car will accelerate faster imho. My understanding is it takes x to turn a gear if you input more then that it turns and I am not sure the losses apart from friction and load against bearings goes up with power input or speed,depends on quality of transmission build, it is the tyres that cop it. We are not holding the load, rapid runs dont let the tyres work hard. Carls Viper runs from 1500 rpm to 5500 were 5 seconds start to finish. Race folk use inertia dynos to get the coast down losses as low as possible so that more power gets to the wheels, that is what wins races. I feel folk get bogged down with the losses, at the end of the day, if there isn't enough power at the wheels for you, tune it more as it is the wheel power which does the work for you, not the flywheel power. We tune cars for road and track and try to get losses down to safe levels( thin oils not safe in endurance cars but ok in sprint and hillclimb), we can influence the losses dramatically with oil viscocities. No one ever seems to talk about oil viscocities, gear used, tyre pressures, sizes or compound when they are 'percentaging' the losses. I think the percentage game is a red herring. We use direct top gear to do the tests so we are reducing the effect of under or overdriven gears in terms of losses. What we have, which I keep saying, is a means of measuring wheel power and a means of measuring drive losses. The two together allow us to compare like for like cars and look for reasons why power is low, eg had bad uj bolts which were rubbing and taking 10 extra bhp to turn, extra thick gloop to stop oil leaks in diff...5 bhp more!
Peter
Edited by PeterBurgess on Sunday 24th May 07:32
Hi Stan
This article says we are all talking rubbish
http://www.superstreetonline.com/how-to/engine/mod...
Peter
This article says we are all talking rubbish
http://www.superstreetonline.com/how-to/engine/mod...
Peter
Hi Stan
For obvious reasons I do not like to hold clutch depressed and wait while the transmission comes to rest, however, when I have coasted down like this I get a marginal difference of less than 1 bhp on a 22 bhp losses car. I think what that article is trying to say, and Steve is, don't try and guess what flywheel is, it doesn't matter, wheel power propels the car. Same as Steve says stick to a dyno so you know if you gain or lose or if a problem. I use the wheel power and coast down losses for comparison purposes. Just strange that the addition of wheel losses and wheel power is in the ball park for tested flywheel power. The obvious retort would be we are measuring too high a wheel power and not enough losses....but, we get repeatable results so it is, as I keep saying, a useful tool. As things are I will happily publish interesting graphs and cars as we do them. Not many other tuners seem bothered to publish graphs but I am happy to share the enjoyment of my work and some of the cars we do with Piston Head readers/posters.
Peter
Hi Stan, not for one moment did I think you were implying that. It is what many other folk think and say and like to think and like to say I think it is a minefield as I said earlier and don't think we will get closer with the SF901 up and running! We would have to use the sf dyno then bolt it all to a chassis dyno etc etc ad infinitum. I tend to tell folk the inertia testing we carry out shows accelerating power available if that makes any sense? For example, lighter flywheel shows slightly more wheel power which is the case out on the road as a car will accelerate faster with lighter flywheel as the power is delivered faster to wheels instead of being used to spin up heavy flywheel.
It would be interesting if you did do some testing on boxes in neutral then in direct top for differences in effort to rotate, oiled, non-oiled etc. You would have some first hand knowledge not many other folk would have.
Peter
I think it is a minefield as I said earlier and don't think we will get closer with the SF901 up and running! We would have to use the sf dyno then bolt it all to a chassis dyno etc etc ad infinitum. I tend to tell folk the inertia testing we carry out shows accelerating power available if that makes any sense? For example, lighter flywheel shows slightly more wheel power which is the case out on the road as a car will accelerate faster with lighter flywheel as the power is delivered faster to wheels instead of being used to spin up heavy flywheel.It would be interesting if you did do some testing on boxes in neutral then in direct top for differences in effort to rotate, oiled, non-oiled etc. You would have some first hand knowledge not many other folk would have.
Peter
Hi Stan
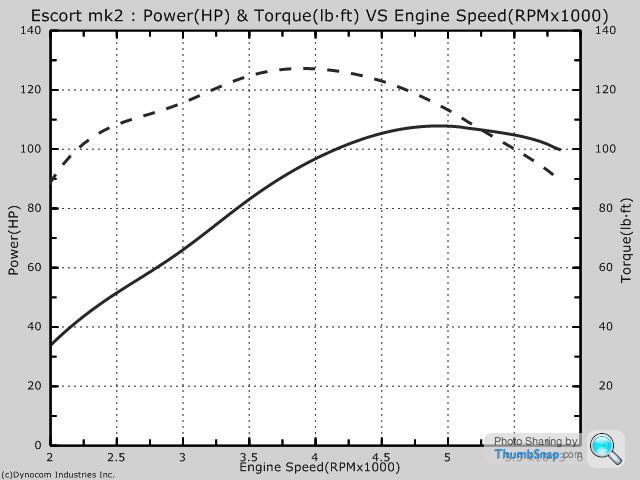
I ran an Escort x-flow sprint engine on the rollers today and tried coastdown in neutral from 94 mph and coastdown in 4th (direct top so only going through mainshaft) from 94mph by holding down clutch. Losses in neutral 17.6 bhp, losses in 4th with foot on clutch 17.4 bhp, difference probably extra drag down on engine at idle with clutch engaged! Wheel horsepower was 107.8...125.4 at engine.
Peter
The results stand as measured and tested, folk will have to work out themselves why the losses are about the same. Points to losses in box being very low doesn't it? In direct top power is transmitted through mainshaft, same as coasting down in neutral or coasting down in 4th with clutch depressed, mainshaft is turning and subject to frictional losses from oil, bearings and seals. It is probable that good modern boxes are 99% efficient in direct top, less good ones 97% efficient.
before I bought an inertia dyno I thought losses were percentages but the inertia dyno is an eye opener. As I keep writing, losses seem to be directly proportional to tyre speed, width and pressure. Cars with loads of ujs such as TR6 lose higher proportion through transmission, olde worlde live back axles lose less.
Peter
The wheel power is not the only figure available with the inertia testing dynos.Using the coastdown test does give us a link to what is happening twixt engine and wheels, as I said, we can compare wheel power and losses from same make and model cars to ensure all is correct, and, if not, find out why transmission losses are higher than the norm. It also gives a modicum of satisfaction to those wanting a ball park engine figure. All in all a very useful tuning/testing tool and beats the pants off guessing the wheel or flywheel power or effects of tweaks to timing and or fuelling!
Peter
Peter
Good point Stevie, all it takes is a tyre inflator to see if the tyre deformation was costly. No point in saying would be interesting to try higher tyre pressure another time....waste of time writing up, would have been more interesting to show effects of tyre pressure....we lost 6ish whp on a B dropping from 30ish to 19 psi!
No deformation like that on Carl's car. Ollie said he could visibly see tyre growth at 170+mph!
With something like Carl's car we just had a ball park snap shot with reasonable temps underbonnet/intercooler etc. Cooler would have shown more, hotter less, as you know very difficult if not impossible to maintain conditions for tuning turbo monsters. Power lines vs temp of intake charge look like physics class graphs with 1% change in whp for every 3 degrees centigrade change!
Accurate for whp and transmission losses or not, we have a whp, losses and a ball park flywheel figure for Carl's first stage 1000 hp tune, which is pretty close, without a dyno run folk are just guessing (usually very optimistic guessing/hoping!) what they have got under the foot Imagine what would have shown with the second stage predicted 1500 hp!
Peter
No deformation like that on Carl's car. Ollie said he could visibly see tyre growth at 170+mph!
With something like Carl's car we just had a ball park snap shot with reasonable temps underbonnet/intercooler etc. Cooler would have shown more, hotter less, as you know very difficult if not impossible to maintain conditions for tuning turbo monsters. Power lines vs temp of intake charge look like physics class graphs with 1% change in whp for every 3 degrees centigrade change!
Accurate for whp and transmission losses or not, we have a whp, losses and a ball park flywheel figure for Carl's first stage 1000 hp tune, which is pretty close, without a dyno run folk are just guessing (usually very optimistic guessing/hoping!) what they have got under the foot
Imagine what would have shown with the second stage predicted 1500 hp!Peter
Pondering a little more, I reckon the article Stan linked to is quite informative. For years folk have criticized inertia dynos for reading higher than power absorbing braked dynos. Maybe both dynos read correctly? Inertia obviously causes less transmission losses; look at the wrinkled tyre on the pic from the eddy braked dyno! So we may show less whp with eddy brake and higher transmission losses and conversely more whp with inertia and correspondingly less losses but end results are ball park same when whp and losses added together. For Carl's car I put a 2% eddy brake load on the rollers (100% load = 750 bhp) to spool up the turbos, with no load power curve was low and poor shape, same with 1% load. At 2% we had a good 'proper'turbo curve. The 15 hp load would not have upset the tyre shape to any extent! I find the repeatability of tests best with no load on non turbo below 400 bhp cars and just small min load on +400 cars and turbos.
Whilst engine dyno should be more definitive for flywheel power and purists, once we get the SF901 up and running I don't suppose many folk will take the engine out of the car and pay for a day's work to see if engine is still on song at end of season....easier and much more cost effective strapping it on rollers and see how it compares to last session!
Peter
No wrinkle on eddy brake pic with no load so would have shown more in inertia mode.
We have been ok with grip and minimal strapping, maybe the nurled roller helps us? We used to struggle on the Clayton as I only used wheel chocks and weight (people) in the boot! Clayton used to destroy soft tyres, Dynocom is very gentle on tyres , soft ones get hot if we hold load to check fuel supply/detonation etc.
Peter
Gassing Station | Engines & Drivetrain | Top of Page | What's New | My Stuff