Discussion


Took car to WRC at Silverstone, yesterday.. these are the guys that dyno the cars for Evo magazine, and probably have the most advanced and accurate dyno in the country.!
Very impressed with figs, car is standard and running 97 Octane BP petrol.
ECU is progressive, therefor the harder you drive, the more power generated.
I spent the whole weekend at Spa and the Ring, Spa was bone dry and did about 40 laps.
Also have my dyno graph for my old GT3 Mk2, which was standard, apart from Fabspeed rear boxes.. worth about 3bhp ish.
Rob


>> Edited by Kurgen_ on Friday 4th November 11:48
Very impressed with figs, car is standard and running 97 Octane BP petrol.
ECU is progressive, therefor the harder you drive, the more power generated.
I spent the whole weekend at Spa and the Ring, Spa was bone dry and did about 40 laps.
Also have my dyno graph for my old GT3 Mk2, which was standard, apart from Fabspeed rear boxes.. worth about 3bhp ish.
Rob
>> Edited by Kurgen_ on Friday 4th November 11:48
johnfm said:
Quite a difference in air temp and relative humidity between the two tests. This may contribute to the higher readings on the RS test.
The Dyno corrects for this. So the readings are directly comparable.
We have the same dyno, and you'd be amazed at how well the correction works.
Those figs look spot on from what i've heard.
vixpy1 said:
Quite a difference in air temp and relative humidity between the two tests. This may contribute to the higher readings on the RS test.
The Dyno corrects for this. So the readings are directly comparable.
We have the same dyno, and you'd be amazed at how well the correction works.
Those figs look spot on from what i've heard.
They are 20bhp higher than any other RS I've seen tested! Aftermarket kits by manthey etc to get that kind of power run into the multiple thousands and Porsche only claim 381bhp for it.
DanH said:
Quite a difference in air temp and relative humidity between the two tests. This may contribute to the higher readings on the RS test.
The Dyno corrects for this. So the readings are directly comparable.
We have the same dyno, and you'd be amazed at how well the correction works.
Those figs look spot on from what i've heard.
They are 20bhp higher than any other RS I've seen tested! Aftermarket kits by manthey etc to get that kind of power run into the multiple thousands and Porsche only claim 381bhp for it.
Was only commenting on the atmos correction of Dyno Dynamics rollers and what i had heard about the RS from other Dyno Dynamics rollers. These are not my rollers, so no point in me getting involved further in a discussion about power figs.
vixpy1 said:
Quite a difference in air temp and relative humidity between the two tests. This may contribute to the higher readings on the RS test.
The Dyno corrects for this. So the readings are directly comparable.
We have the same dyno, and you'd be amazed at how well the correction works.
Those figs look spot on from what i've heard.
They are 20bhp higher than any other RS I've seen tested! Aftermarket kits by manthey etc to get that kind of power run into the multiple thousands and Porsche only claim 381bhp for it.
Was only commenting on the atmos correction of Dyno Dynamics rollers and what i had heard about the RS from other Dyno Dynamics rollers. These are not my rollers, so no point in me getting involved further in a discussion about power figs.
What factors can affect these reading though? I realise engines develop differing amounts of power depending on atmospherics etc, but these seem almost too good. Is it measuring coast down losses to estimate the power at the crank, or just using a constant to estimate transmission losses?
Are these roller dynos or do they hook up directly to the axle?
Here's the official graph :

>> Edited by DanH on Friday 4th November 13:23
>> Edited by DanH on Friday 4th November 13:24
Dan,
I would'nt expect WRC to comment about my dyno test results on a public forum, so it only seems right for me to not comment on specific results from them.
I only wanted to point out to the chap who asked about atmos correction that these dyno's correct for atmos factors. And that it works!
>> Edited by vixpy1 on Friday 4th November 13:37
vixpy1 said:
Dan,
I would'nt expect WRC to comment about my dyno test results on a public forum, so it only seems right for me to not comment on specific results from them.
I only wanted to point out to the chap who asked about atmos correction that these dyno's correct for atmos factors. And that it works!
>> Edited by vixpy1 on Friday 4th November 13:37
Hopefully this is a safe question :
Do dyno dynamics rollers measure cost down losses, or do you manually enter the transmission loss figure? Is this figure on the printout?
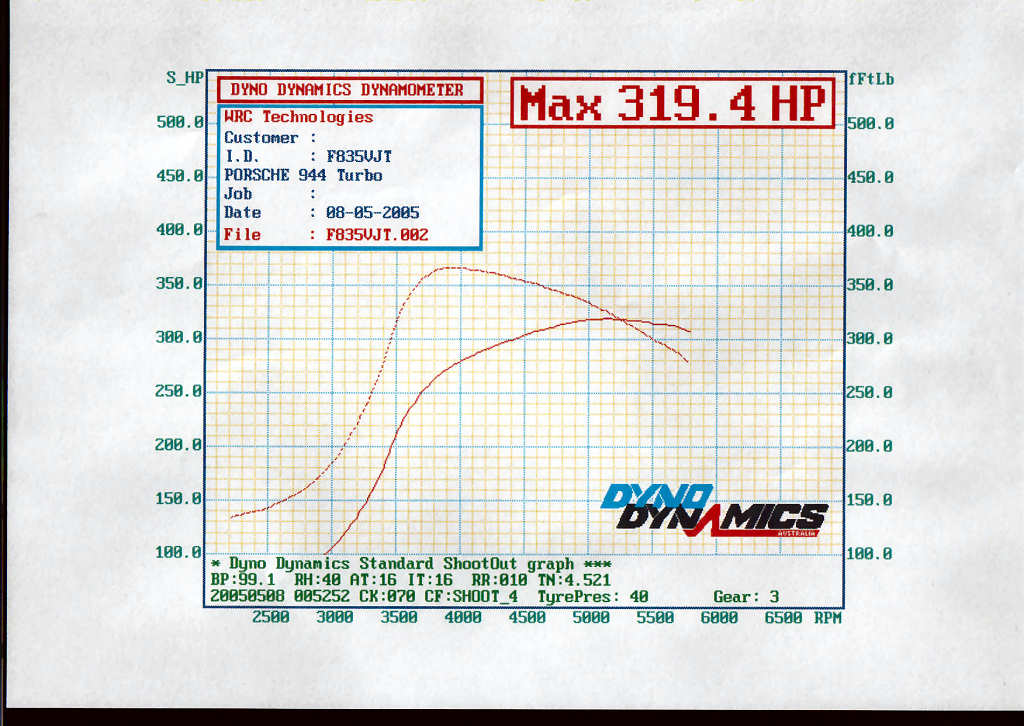
On my run they provided a rw figure and a flywheel, the flywheel is calculated by measuring through decelaration. There are lots of graphs here www.cannell.co.uk/944%200505%20Dyno%20Data.htm note how an old 944T with a few mods lags behind on BHP but can produce some nice fat torque,
Tony
>> Edited by UK952 on Friday 4th November 14:00
Tony
>> Edited by UK952 on Friday 4th November 14:00
www.cannell.co.uk/images/Dyno_Graphs/F835VJT_TQ.jpg
Over 360 ft lbs with standard exhaust and turbo
Tony
Over 360 ft lbs with standard exhaust and turbo
Tony
Dyno Dynamics rollers use a software system to estimate flywheel figs, they are capable of doing coastdown but most operators choose not to use it because the software system is so good.
Its a very advanced system and is far more repeatable than coastdown, which in my experience on other dyno's produces very strange results, and pie in the sky flywheel figs.
Its a very advanced system and is far more repeatable than coastdown, which in my experience on other dyno's produces very strange results, and pie in the sky flywheel figs.
Well I've only had my RS for a few weeks and the results that Rob has posted do not seem that far off, especially when you look at the real world timing figures for a standard GT3.
e.g 0-100 9.1 seconds
Try a simulation programme with say 381bhp and it reads 9.8 seconds to 100 mph.
The simulation programmes rely on the perfect world, so to see 0-100 times of 9.1 repeated around the world means that the GT3 must have at least 390 bhp and about 295 ft/lb of torque.
The lightweight flywheel has got to be good for a few bhp and who knows what else Porsche really did to the RS engine?
Interesting stuff.
The one fact, that has not been discussed.. is the ability of the ECU on the GT3 to adapt itself to previous driving conditions.
The fact that I had tracked my old GT3 regularly prior to dyno day, and also had done a whole weekend track and hard driving (170 mph back from the Ring).. also 20 laps around Silverstone GP half hour before dyno on RS.
The harder you drive the car, the faster it gets..
Rob
The fact that I had tracked my old GT3 regularly prior to dyno day, and also had done a whole weekend track and hard driving (170 mph back from the Ring
).. also 20 laps around Silverstone GP half hour before dyno on RS. The harder you drive the car, the faster it gets..
Rob
jpf40 said:
Well I've only had my RS for a few weeks and the results that Rob has posted do not seem that far off, especially when you look at the real world timing figures for a standard GT3.
e.g 0-100 9.1 seconds
Try a simulation programme with say 381bhp and it reads 9.8 seconds to 100 mph.
The simulation programmes rely on the perfect world, so to see 0-100 times of 9.1 repeated around the world means that the GT3 must have at least 390 bhp and about 295 ft/lb of torque.
The lightweight flywheel has got to be good for a few bhp and who knows what else Porsche really did to the RS engine?
Interesting stuff.
Which simulation program, and are you entering all the gearing and giving it an accurate torque curve, drag figures etc?
I believe the perf numbers, but I'm just at tad skeptical about dyno numbers. I own an RS too, so its not like I'm trying to knock the cars!
>> Edited by DanH on Friday 4th November 16:57
Car Test 2000
I used this programme for a 1/4 simulation of a competition I entered years back with a BMW M Coupe.
The programme predicted 13.8, I achieved 13.9.
Its a good package which accounts for a massive amount of factors.
Its accurate enough to realise that Porsche are being very conservative with their figures on the GT3 engine.
Gassing Station | Porsche General | Top of Page | What's New | My Stuff