Coronavirus - Data Analysis Thread
Discussion


Coronavirus (COVID-19) Infection Survey technical article: analysis of positivity after vaccination, June 2021
https://www.ons.gov.uk/peoplepopulationandcommunit...

https://www.ons.gov.uk/peoplepopulationandcommunit...
the-photographer said:
Border policy?
Vaccine window?
Less Delta for sure
All those other countries have less total vaccine coverage (sure some age groups might have higher double dose coverage)

We are doing 3 to 7 times the amount of tests per 1000 people than France, Germany, Portugal etc. Vaccine window?
Less Delta for sure
All those other countries have less total vaccine coverage (sure some age groups might have higher double dose coverage)
Surely need to change the comparison?
duckson said:
the-photographer said:
Border policy?
Vaccine window?
Less Delta for sure
All those other countries have less total vaccine coverage (sure some age groups might have higher double dose coverage)
We are doing 3 to 7 times the amount of tests per 1000 people than France, Germany, Portugal etc. Vaccine window?
Less Delta for sure
All those other countries have less total vaccine coverage (sure some age groups might have higher double dose coverage)
Surely need to change the comparison?
If anyone has a lot of spare time and Excel
https://www.ecdc.europa.eu/en/publications-data/co...
Or the graphs here
https://ourworldindata.org/coronavirus-testing
Edited by the-photographer on Thursday 17th June 11:51
the-photographer said:
duckson said:
the-photographer said:
Border policy?
Vaccine window?
Less Delta for sure
All those other countries have less total vaccine coverage (sure some age groups might have higher double dose coverage)
We are doing 3 to 7 times the amount of tests per 1000 people than France, Germany, Portugal etc. Vaccine window?
Less Delta for sure
All those other countries have less total vaccine coverage (sure some age groups might have higher double dose coverage)
Surely need to change the comparison?
If anyone has a lot of spare time and Excel
https://www.ecdc.europa.eu/en/publications-data/co...
Or the graphs here
https://ourworldindata.org/coronavirus-testing
Edited by the-photographer on Thursday 17th June 11:51
Hopefully his works?
For some reason Germany isn’t showing up but anyway!
7 day rolling average, tests/cases;
UK 930k/7k
France 278k/4.7k
Italy 182k/1.7k
Edit
Spain up to 10th June; 92k/5.2k
Edited by duckson on Thursday 17th June 13:44
Ahonen said:
This page from the same website is even better:
https://ourworldindata.org/coronavirus-testing
The first data section is perfect, as it shows the percentage of positive tests.
It does, thanks. https://ourworldindata.org/coronavirus-testing
The first data section is perfect, as it shows the percentage of positive tests.
Ahonen said:
duckson said:
the-photographer said:
duckson said:
the-photographer said:
Border policy?
Vaccine window?
Less Delta for sure
All those other countries have less total vaccine coverage (sure some age groups might have higher double dose coverage)
We are doing 3 to 7 times the amount of tests per 1000 people than France, Germany, Portugal etc. Vaccine window?
Less Delta for sure
All those other countries have less total vaccine coverage (sure some age groups might have higher double dose coverage)
Surely need to change the comparison?
If anyone has a lot of spare time and Excel
https://www.ecdc.europa.eu/en/publications-data/co...
Or the graphs here
https://ourworldindata.org/coronavirus-testing
Edited by the-photographer on Thursday 17th June 11:51
Hopefully his works?
For some reason Germany isn’t showing up but anyway!
7 day rolling average, tests/cases;
UK 930k/7k
France 278k/4.7k
Italy 182k/1.7k
Edit
Spain up to 10th June; 92k/5.2k
Edited by duckson on Thursday 17th June 13:44
https://ourworldindata.org/coronavirus-testing
The first data section is perfect, as it shows the percentage of positive tests.
https://ourworldindata.org/explorers/coronavirus-d...

I think this is the best way to understand changes in prevalence. I use cases per 100k tests, which is essentially the same and it has, until recently, closely tracked with admissions and deaths.
Elysium said:
Our World in Data have a Coronavirus 'data explorer' that includes test positiivity:
https://ourworldindata.org/explorers/coronavirus-d...
I think this is the best way to understand changes in prevalence. I use cases per 100k tests, which is essentially the same and it has, until recently, closely tracked with admissions and deaths.
Interesting, although there appears to be an alarming uptick in Spain - thoughts as to why??https://ourworldindata.org/explorers/coronavirus-d...
I think this is the best way to understand changes in prevalence. I use cases per 100k tests, which is essentially the same and it has, until recently, closely tracked with admissions and deaths.
Biker 1 said:
Elysium said:
Our World in Data have a Coronavirus 'data explorer' that includes test positiivity:
https://ourworldindata.org/explorers/coronavirus-d...
I think this is the best way to understand changes in prevalence. I use cases per 100k tests, which is essentially the same and it has, until recently, closely tracked with admissions and deaths.
Interesting, although there appears to be an alarming uptick in Spain - thoughts as to why??https://ourworldindata.org/explorers/coronavirus-d...
I think this is the best way to understand changes in prevalence. I use cases per 100k tests, which is essentially the same and it has, until recently, closely tracked with admissions and deaths.
Cases increased again today, but the growth rate is continuing to slow. This is for the whole of the UK and the last entry point is 12th June:

This is my attempt to recreate this graph, which picks up some later data points:

The trend suggests we are heading towards a peak, but I am hearing that there are cases in Universities again, which I think could see this bounce back.
This is my attempt to recreate this graph, which picks up some later data points:
The trend suggests we are heading towards a peak, but I am hearing that there are cases in Universities again, which I think could see this bounce back.
the-photographer said:
Coronavirus (COVID-19) Infection Survey technical article: analysis of positivity after vaccination, June 2021
https://www.ons.gov.uk/peoplepopulationandcommunit...
As I understand it a lot of under 30s are being given the pfizer one ?https://www.ons.gov.uk/peoplepopulationandcommunit...
I would not be surprised if the government use these stats to enforce all current restrictions until all over 18s have had a second jab. "People with one dose of Pfizer vaccine nearly three times more likely to get covid than the AZ vaccine"
..slightly tongue in cheek, but.. with this lot you never know...
Crafty_ said:
the-photographer said:
Coronavirus (COVID-19) Infection Survey technical article: analysis of positivity after vaccination, June 2021
https://www.ons.gov.uk/peoplepopulationandcommunit...
As I understand it a lot of under 30s are being given the pfizer one ?https://www.ons.gov.uk/peoplepopulationandcommunit...
I would not be surprised if the government use these stats to enforce all current restrictions until all over 18s have had a second jab. "People with one dose of Pfizer vaccine nearly three times more likely to get covid than the AZ vaccine"
..slightly tongue in cheek, but.. with this lot you never know...
That could easily skew these numbers.
1st August peak was in the news yesterday
https://www.channel4.com/news/hospitals-told-to-br...
An internal NHS email seen by Channel 4 News shows how hospitals are being told to prepare for a third Covid-19 wave at the same time as a spike in serious infections among very young children.
It goes on: “We are following national guidance on planning, which is to plan for 50 per cent of the first wave, with fewer patients needing (intensive care) and admitted patients being younger and less sick. This is the pattern we’re currently seeing across the trust.
Copy paste...
A total of 806 people in England have been admitted to hospital with the Delta variant of Covid-19 as of 14 June, new figures show.
This is a rise of 423 on the previous week, according to the data from Public Health England.
Of the 806 hospitalisations:
527 (65%) people were unvaccinated
135 (17%) were more than 21 days after their first dose of vaccine
84 (10%) were more than 14 days after their second dose.
As of 14 June, there have been 73 deaths in England of people who were confirmed as having the Delta variant and who died within 28 days of a positive test.
Of the 73 deaths:
34 (47%) were unvaccinated
10 (14%) were more than 21 days after their first dose of vaccine
26 (36%) were more than 14 days after their second dose.
Tim Spector of the Zoe Symptom Study app is predicting the peak of infections in 10-14 days time with a fall to below the level we are at now in 4 weeks.
https://youtu.be/l5v0ic-um7A
https://youtu.be/l5v0ic-um7A
SARS-CoV-2 variants of concern and variants under investigation in England Technical briefing 16
If you love graphs, all 60 pages, then look at
https://assets.publishing.service.gov.uk/governmen...
If you love graphs, all 60 pages, then look at
https://assets.publishing.service.gov.uk/governmen...
Muncher said:
Tim Spector of the Zoe Symptom Study app is predicting the peak of infections in 10-14 days time with a fall to below the level we are at now in 4 weeks.
https://youtu.be/l5v0ic-um7A
Sounds about right. If the current slow down in the growth rate continues cases could peak next week. https://youtu.be/l5v0ic-um7A
Elysium said:
Muncher said:
Tim Spector of the Zoe Symptom Study app is predicting the peak of infections in 10-14 days time with a fall to below the level we are at now in 4 weeks.
https://youtu.be/l5v0ic-um7A
Sounds about right. If the current slow down in the growth rate continues cases could peak next week. https://youtu.be/l5v0ic-um7A
Update on todays numbers:
1. Cases and Admissions
Cases per 100k tests continue to rise, but deaths are staying low. As a result the Case Fatality Rate continues to fall. In fact cases now are resulting in around 20 times less deaths than they were at the peak.
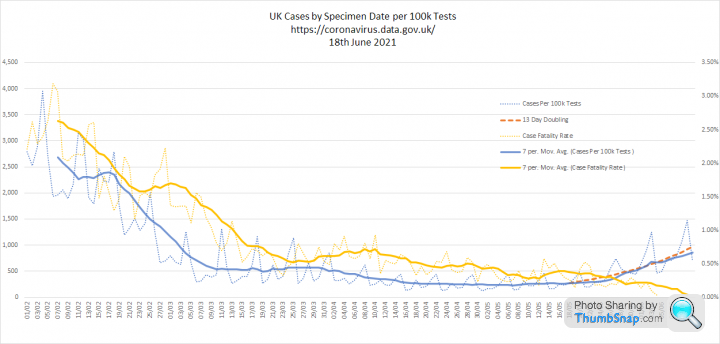
Similarly, admissions are starting to slowly increase, but the Case Admission Rate is continuing to fall. In February 10% of cases resulted in an admission, now it is a little over 3%

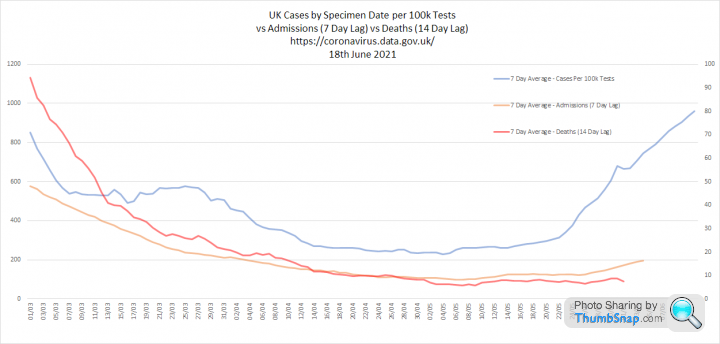
2. You can see this effect more clearly in this graph, which shows cases, admissions and deaths overlaid with a lag and a secondary Y axis to allow the curves to be compared. The increase in cases that began around 1 month ago is still not driving a comparable increase in admissions or deaths
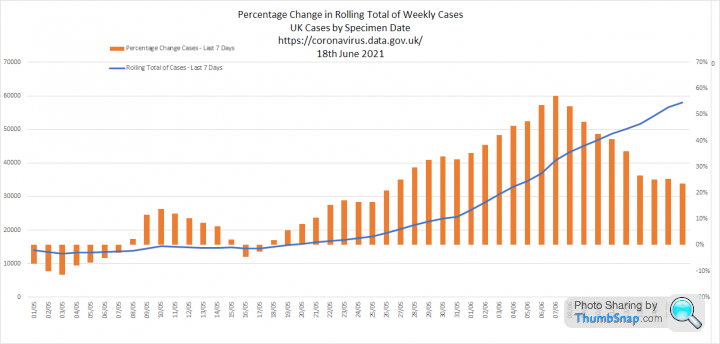
3. Finally a couple of graphs showing the rate of growth in cases and admissions over a 7 day period. This timescale works well because it smooths our reporting delays. Case growth is clearly slowing. It looks as if admission growth may also be slowing, but the data here is very laggy and this may change in the coming weeks.

1. Cases and Admissions
Cases per 100k tests continue to rise, but deaths are staying low. As a result the Case Fatality Rate continues to fall. In fact cases now are resulting in around 20 times less deaths than they were at the peak.
Similarly, admissions are starting to slowly increase, but the Case Admission Rate is continuing to fall. In February 10% of cases resulted in an admission, now it is a little over 3%
2. You can see this effect more clearly in this graph, which shows cases, admissions and deaths overlaid with a lag and a secondary Y axis to allow the curves to be compared. The increase in cases that began around 1 month ago is still not driving a comparable increase in admissions or deaths
3. Finally a couple of graphs showing the rate of growth in cases and admissions over a 7 day period. This timescale works well because it smooths our reporting delays. Case growth is clearly slowing. It looks as if admission growth may also be slowing, but the data here is very laggy and this may change in the coming weeks.
Edited by Elysium on Friday 18th June 17:37
Muncher said:
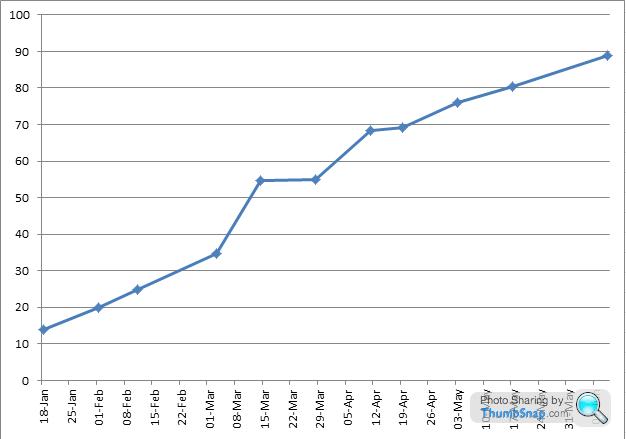
Here is a chart of antibody prevalence of adults in the community as per the ONS surveys. The last data collected was as at 17 May, I have added the last point on the graph as at today's date based upon the trendline.
https://www.ons.gov.uk/peoplepopulationandcommunit...
Updated chart, prevalence of antibodies for over 16s in the UK, as of today should be around 91.5%.

If we continue on the same trend we will reach 100% antibody prevalence in the last week of July.
Gassing Station | News, Politics & Economics | Top of Page | What's New | My Stuff