Coronavirus - Data Analysis Thread
Discussion


Smollet said:
Ashfordian said:
Muncher said:
Do you know if their model takes into account waning immunity from the vaccine?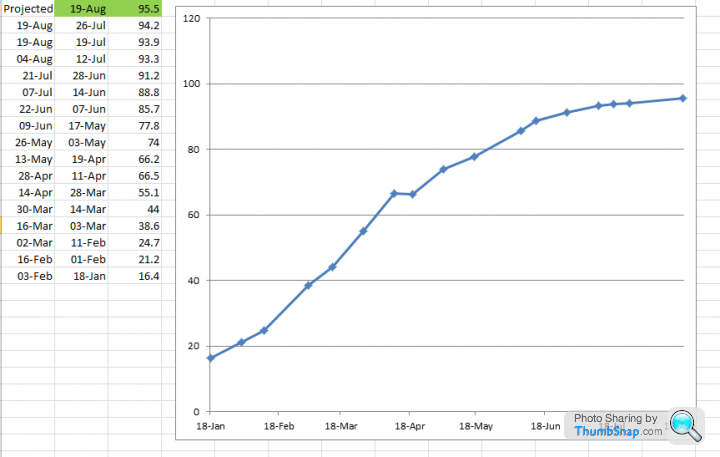
silentbrown said:
Tim Spector talking about that in his weekly video.
Thanks, I think the most important point was the one in the chart below, infection immunity is decreasing, so even with more vaccine coverage and anti-bodies at 93% we are going to have "loads" of case into this autumn.Has this been more widely reported in the press?
NoddyonNitrous said:
Scottish trends not looking good.
Good daily tracker here https://www.travellingtabby.com/scotland-coronavir...https://www.bbc.co.uk/news/uk-58293249
There's a very significant increase in the amount of antibody testing taking place from tuesday. Everyone who tests PCR positive will be given the option of carrying out two antibody tests, one at the point of the positive pcr test and one 28 days later. Up to 8,000 tests per day.
I presume these will be reported as part of the ONS survey which will see a big increase from a sample size of ~30,000 over 2 weeks to ~140,000.
Muncher said:
https://www.bbc.co.uk/news/uk-58293249
There's a very significant increase in the amount of antibody testing taking place from tuesday. Everyone who tests PCR positive will be given the option of carrying out two antibody tests, one at the point of the positive pcr test and one 28 days later. Up to 8,000 tests per day.
I presume these will be reported as part of the ONS survey which will see a big increase from a sample size of ~30,000 over 2 weeks to ~140,000.
This feels like it is an attempt to get more information on why 'break-through' infections are occurring and allowing them to compare post-infection. I'm not sure simply measuring antibodies is the best way do this as the vaccine creates antibodies for 1 protein whereas the virus has 28 proteins.There's a very significant increase in the amount of antibody testing taking place from tuesday. Everyone who tests PCR positive will be given the option of carrying out two antibody tests, one at the point of the positive pcr test and one 28 days later. Up to 8,000 tests per day.
I presume these will be reported as part of the ONS survey which will see a big increase from a sample size of ~30,000 over 2 weeks to ~140,000.
Ashfordian said:
This feels like it is an attempt to get more information on why 'break-through' infections are occurring and allowing them to compare post-infection. I'm not sure simply measuring antibodies is the best way do this as the vaccine creates antibodies for 1 protein whereas the virus has 28 proteins.
Be nice is valneva is ready this year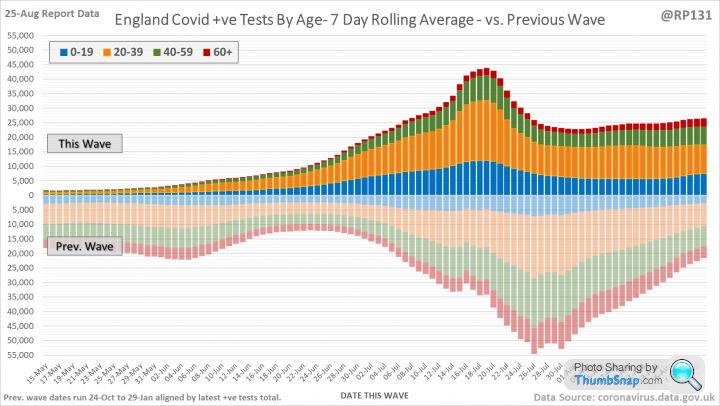
V88Dicky said:
Terminator X said:
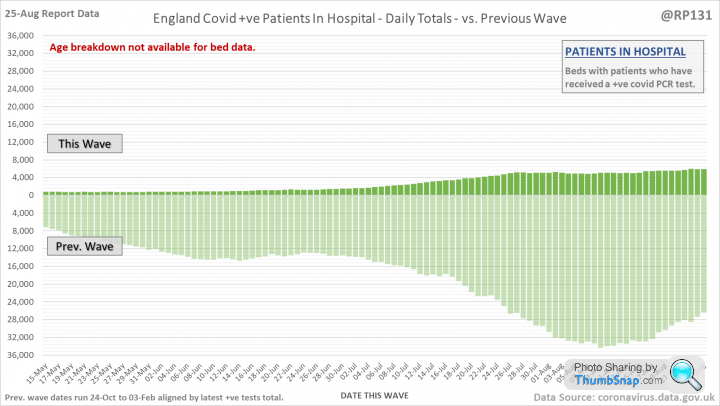
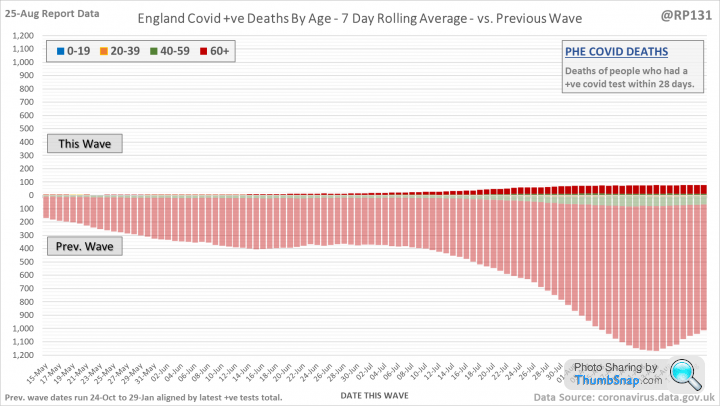
^^^ informative and tells a very interesting story!
TX.
Indeed.TX.
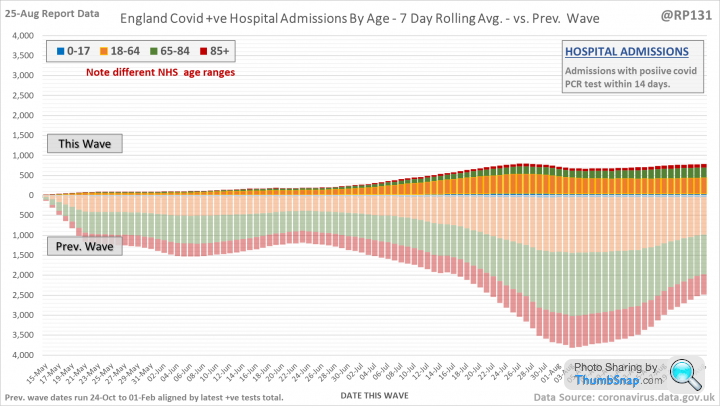
The same cohort of people who were succumbing to the virus last year, are sadly the same this year….
Hold the front page
Older people are more likely to die than younger people
Boringvolvodriver said:
V88Dicky said:
Terminator X said:
^^^ informative and tells a very interesting story!
TX.
Indeed.TX.
The same cohort of people who were succumbing to the virus last year, are sadly the same this year….
Hold the front page
Older people are more likely to die than younger people
spikeyhead said:
Boringvolvodriver said:
V88Dicky said:
Terminator X said:
^^^ informative and tells a very interesting story!
TX.
Indeed.TX.
The same cohort of people who were succumbing to the virus last year, are sadly the same this year….
Hold the front page
Older people are more likely to die than younger people
V88Dicky said:
Terminator X said:
^^^ informative and tells a very interesting story!
TX.
The same cohort of people who were succumbing to the virus last year, are sadly the same this year….TX.
silentbrown said:
V88Dicky said:
Terminator X said:
^^^ informative and tells a very interesting story!
TX.
The same cohort of people who were succumbing to the virus last year, are sadly the same this year….TX.
silentbrown said:
V88Dicky said:
Terminator X said:
^^^ informative and tells a very interesting story!
TX.
The same cohort of people who were succumbing to the virus last year, are sadly the same this year….TX.
scenario8 said:
silentbrown said:
V88Dicky said:
Terminator X said:
^^^ informative and tells a very interesting story!
TX.
The same cohort of people who were succumbing to the virus last year, are sadly the same this year….TX.
Still a better position to be in than before though.
scenario8 said:
“How far ‘under 65’?” might be a nice question to have answered. Sadly that data appears to be unavailable.
For Scotlandhttps://www.travellingtabby.com/scotland-coronavir...

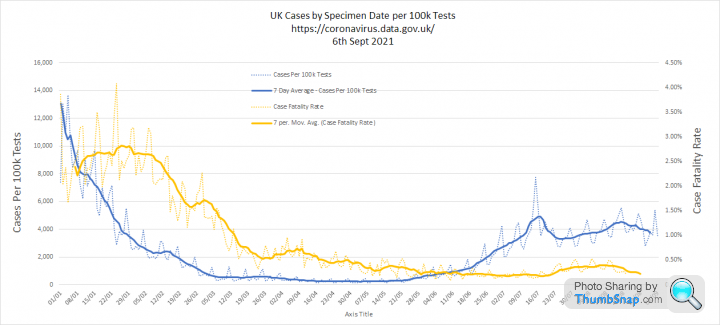
Quick update as I have not looked at numbers for some time:
1. Cases per 100k Tests have pretty much held flat since 'freedom day'. The Case Fatality Rate is also holding steady at an average of 35 deaths per 10,000 cases over the last month. In January we saw 262 deaths per 10,000 cases. That's an 87% reduction in deaths:
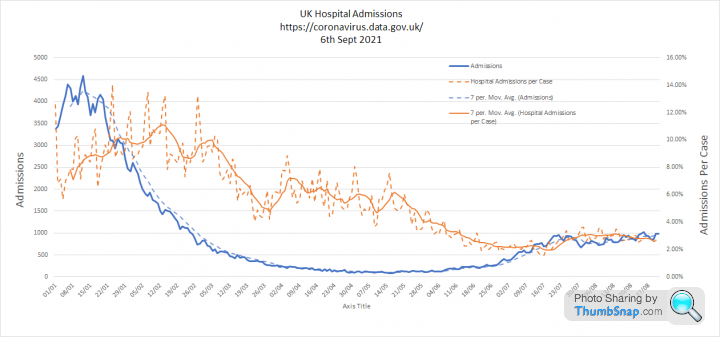
2. Hospital admissions are similar. In the last 28 days an average of 282 in every 10,000 cases ended up in hospital. That means over 97% of people with COVID did not require hospital treatment. In January 888 in every 10,000 were admitted. Thats a 68% reduction in severe illness
3. This graph shows Cases per 100k Tests have held 3 times lower than the winter peak, despite lifting of all restrictions. Admissions and deaths are shown on a separate Y axis:

4. This version zooms in on the more recent period and 'rebases' deaths so the curves can be more easily compared. Its clear that there is still a direct relationship between Cases per 100k tests, Admissions and Deaths. It is simply that the proportion of people suffering severe illness has very significantly reduced:
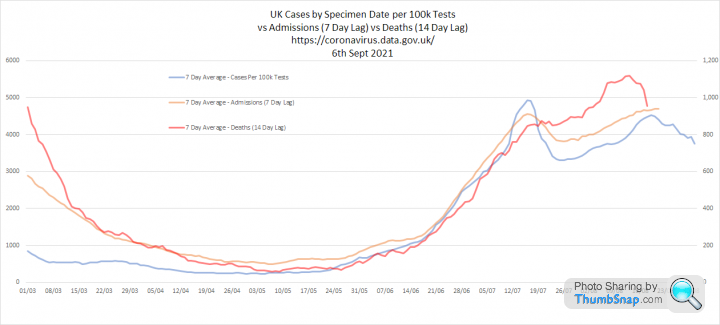
1. Cases per 100k Tests have pretty much held flat since 'freedom day'. The Case Fatality Rate is also holding steady at an average of 35 deaths per 10,000 cases over the last month. In January we saw 262 deaths per 10,000 cases. That's an 87% reduction in deaths:
2. Hospital admissions are similar. In the last 28 days an average of 282 in every 10,000 cases ended up in hospital. That means over 97% of people with COVID did not require hospital treatment. In January 888 in every 10,000 were admitted. Thats a 68% reduction in severe illness
3. This graph shows Cases per 100k Tests have held 3 times lower than the winter peak, despite lifting of all restrictions. Admissions and deaths are shown on a separate Y axis:
4. This version zooms in on the more recent period and 'rebases' deaths so the curves can be more easily compared. Its clear that there is still a direct relationship between Cases per 100k tests, Admissions and Deaths. It is simply that the proportion of people suffering severe illness has very significantly reduced:
Edited by Elysium on Monday 6th September 21:11
Gassing Station | News, Politics & Economics | Top of Page | What's New | My Stuff