Coronavirus - Data Analysis Thread
Discussion


NoddyonNitrous said:
Two questions I was asked today, and unsure of the answer for. Does anybody know the answers?
1) Test results are analysed by residential address, are they not, so if I test positive when tested when away from home for a period, does it show on my home area's statistics?
2) Do the area cases/100k statistics only always use residents as the denominator? I am staying in an area where the holidaymakers swell the numbers to 2-3x the resident numbers, if so the headline case rate will actually be much lower than published.
re: 1) - IIRC there was an issue with students' test results being logged both at home and at uni location, which screwed the numbers up somewhat... (even more than they are already fudged).1) Test results are analysed by residential address, are they not, so if I test positive when tested when away from home for a period, does it show on my home area's statistics?
2) Do the area cases/100k statistics only always use residents as the denominator? I am staying in an area where the holidaymakers swell the numbers to 2-3x the resident numbers, if so the headline case rate will actually be much lower than published.
Not sure that answers your question, though
 but fortunately it seems bork has!
RSTurboPaul said:
re: 1) - IIRC there was an issue with students' test results being logged both at home and at uni location, which screwed the numbers up somewhat... (even more than they are already fudged).
Not sure that answers your question, though but fortunately it seems bork has!
Essentially, now we have population mobility, both numerator and denominator figures for regional areas sare subject to great uncertainty. National ones are the only credible measure of prevalence.Not sure that answers your question, though
but fortunately it seems bork has!I posted this in the wrong corona thread earlier
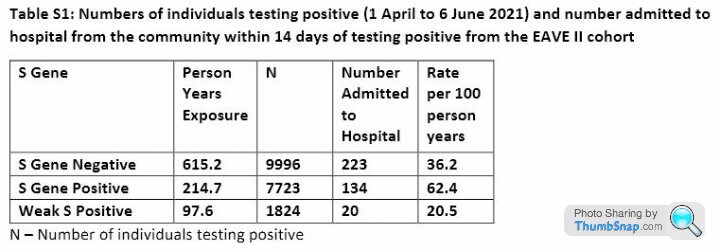
Delta VOC in Scotland: demographics, risk of hospital admission, and vaccine effectiveness 14th June
https://www.thelancet.com/journals/lancet/article/...
One dose efficacy for AstraZeneca against 18% rising to 60% after second
One dose efficacy for Pfizer 30% rising to 79% after second
Table on page 5
https://www.thelancet.com/cms/10.1016/S0140-6736(2...
Efficacy rises another 10% for Alpha (but long gone from these shores)
the-photographer said:
I posted this in the wrong corona thread earlier
Delta VOC in Scotland: demographics, risk of hospital admission, and vaccine effectiveness 14th June
https://www.thelancet.com/journals/lancet/article/...
One dose efficacy for AstraZeneca against 18% rising to 60% after second
One dose efficacy for Pfizer 30% rising to 79% after second
Table on page 5
https://www.thelancet.com/cms/10.1016/S0140-6736(2...
Efficacy rises another 10% for Alpha (but long gone from these shores)
And yet the Case Fatality Rate for COVID is 95% lower than it was last time we had cases at current levels. Delta VOC in Scotland: demographics, risk of hospital admission, and vaccine effectiveness 14th June
https://www.thelancet.com/journals/lancet/article/...
One dose efficacy for AstraZeneca against 18% rising to 60% after second
One dose efficacy for Pfizer 30% rising to 79% after second
Table on page 5
https://www.thelancet.com/cms/10.1016/S0140-6736(2...
Efficacy rises another 10% for Alpha (but long gone from these shores)
Elysium said:
And yet the Case Fatality Rate for COVID is 95% lower than it was last time we had cases at current levels.
Are we talking absolute # of cases, or cases per 1,000 tests?I'll assume cases per 1,000 tests, and suggest:-
1) Vaccine effect (obviously)
2) Low-hanging fruit - many of the truly infirm/weak/vulnerable were killed off last year
3) Known protocols now exist in at-risk environments (i.e. care homes, hospitals etc.), which didn't exist last year
4) This one seems to be spreading through the young who've (a) had enough of all this "lockdown s
 t", and (b) weren't allowed out as much last year...so there's a very different infection demographic / vector.
havoc said:
Elysium said:
And yet the Case Fatality Rate for COVID is 95% lower than it was last time we had cases at current levels.
Are we talking absolute # of cases, or cases per 1,000 tests?I'll assume cases per 1,000 tests, and suggest:-
1) Vaccine effect (obviously)
2) Low-hanging fruit - many of the truly infirm/weak/vulnerable were killed off last year
3) Known protocols now exist in at-risk environments (i.e. care homes, hospitals etc.), which didn't exist last year
4) This one seems to be spreading through the young who've (a) had enough of all this "lockdown s
t", and (b) weren't allowed out as much last year...so there's a very different infection demographic / vector.Elysium said:
the-photographer said:
I posted this in the wrong corona thread earlier
Delta VOC in Scotland: demographics, risk of hospital admission, and vaccine effectiveness 14th June
https://www.thelancet.com/journals/lancet/article/...
One dose efficacy for AstraZeneca against 18% rising to 60% after second
One dose efficacy for Pfizer 30% rising to 79% after second
Table on page 5
https://www.thelancet.com/cms/10.1016/S0140-6736(2...
Efficacy rises another 10% for Alpha (but long gone from these shores)
And yet the Case Fatality Rate for COVID is 95% lower than it was last time we had cases at current levels. Delta VOC in Scotland: demographics, risk of hospital admission, and vaccine effectiveness 14th June
https://www.thelancet.com/journals/lancet/article/...
One dose efficacy for AstraZeneca against 18% rising to 60% after second
One dose efficacy for Pfizer 30% rising to 79% after second
Table on page 5
https://www.thelancet.com/cms/10.1016/S0140-6736(2...
Efficacy rises another 10% for Alpha (but long gone from these shores)
I think these charts help to illustrate the impact of immunity (via vaccinations and prior infections) on hospitalisations and death, comparing the second wave (September to November last year) to the current wave:
Taken from the Guardian: https://www.theguardian.com/world/2021/may/28/covi...
Taken from the Guardian: https://www.theguardian.com/world/2021/may/28/covi...
Edited by CarlosFandango11 on Monday 5th July 10:36
CarlosFandango11 said:
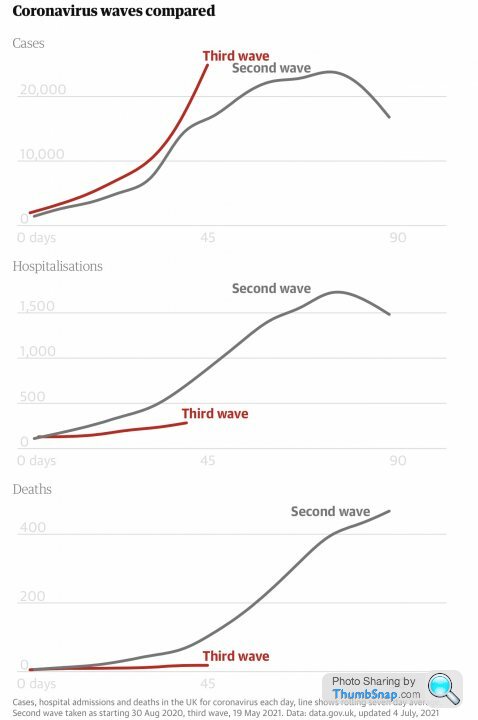
I think these charts help to illustrate the impact of immunity (via vaccinations and prior infections) on hospitalisations and death, comparing the second wave (September to November last year) to the current wave:
Taken from the Guardian: https://www.theguardian.com/world/2021/may/28/covi...
Looks good but it does worry me slightly that we are in the middle of summer and are doing 4x as many tests as we were doing back in Autumn last year. If we normalise for the number of tests (whilst assuming the underlying infection rates in the general population are similar) then the number of hospitalisations isn't so optimistic. i.e. last September we had a similar hospitalisation rate with around half to a third the number of positive tests - but the number of tests was a quarter of what we are doing now. Taken from the Guardian: https://www.theguardian.com/world/2021/may/28/covi...
Edited by CarlosFandango11 on Monday 5th July 10:36
CarlosFandango11 said:
I think these charts help to illustrate the impact of immunity (via vaccinations and prior infections) on hospitalisations and death, comparing the second wave (September to November last year) to the current wave:
Taken from the Guardian: https://www.theguardian.com/world/2021/may/28/covi...
Thanks.Taken from the Guardian: https://www.theguardian.com/world/2021/may/28/covi...
Good article all round (not always a given with the Guardian).
With regard to the skyrocketing case #s vs Wave 1 and Wave 2, do we know if these are definite, tested #s, or extrapolated whole-population #s?
...because we all know the government is testing the hell out of this virus now, which will skew the relative curves if it's just showing actual positive tests (i.e. Wave-1 and Wave-2 happened during periods of much lower testing, so that would exaggerate the vaccination's role in reducing e.g. deaths-per-1000-cases in Wave-3).
Also interesting is the demographics of infections this time around...clearly kids and younger adults have had enough and adopted the "I'm alright, Jack" approach, and the government are clearly happy that they can now let their original herd-immunity idea run. (Which, as long as Delta continues to prove less-fatal, might not be so silly...)
What I can't find in the published PHE data is the demographics of those hospitalised or dying...current run-rate seems to be deaths at 5-10% of hospitalisations, and hospitalisations at +/- 1.5% of cases...but that's likely to show some big swings between age-groups and possibly ethinicities and social class too...as well as the important "comorbidities" factor.
(Wave 2 c.Dec-20 was ~30% death : hospitalisation, and 50% case : hospitalisation, Wave 1 c. Apr-20 was ~50% death : hospitalisation, and 30-50% case : hospitalisation...which I'm guessing supports the premise that the cases data is based on actual tests not extrapolations, and that very few people were being tested outside a hospital environment during Wave 1 and 2...so I guess we should look at actuals curves for hospitalisations and deaths rather than rates)
havoc said:
What I can't find in the published PHE data is the demographics of those hospitalised
There is some English hospital admissions data by age at the bottom of this page:https://www.england.nhs.uk/statistics/statistical-...
However, I’m not convinced it’s consistent with what’s available data available from https://coronavirus.data.gov.uk/ - I was calculating hospitalisation rates of around 90% for 85+ year olds during May 2021.
Jinx said:
Looks good but it does worry me slightly that we are in the middle of summer and are doing 4x as many tests as we were doing back in Autumn last year. If we normalise for the number of tests (whilst assuming the underlying infection rates in the general population are similar) then the number of hospitalisations isn't so optimistic. i.e. last September we had a similar hospitalisation rate with around half to a third the number of positive tests - but the number of tests was a quarter of what we are doing now.
I'm not sure you can compare that directly...different circumstances Last Autumn we were only recently out of a lockdown, people were being ultra-cautious, and there were almost no "events" happening. Plus pubs weren't allowing people inside, employers weren't pushing people back into offices, etc. etc. So risky behaviours and opportunities for infection were both much lower 9 months ago.
Compare to now, and we've got massive spectator-filled events happening, pubs full of drunken people hugging each other, and at least half the population suffering from pandemic ennui and wanting/wishing the whole thing over...driving arguably more risky/inappropriate behaviours. Add in a government which has jumped the shark as far as credibility goes, and is busy sending out messages that everything is going to be OK, and it's not surprising things are going the wrong way.
The big issue for me is (as you allude to) that hospitalisation line, and how that links to the death rate (is the trend improving or worsening) - if the hospitalisation line manages to stay pretty flat despite the rampant cases, then the desire to re-open will seem perfectly reasonable. If it climbs noticeably in coming weeks, and doubly so if it brings the death #s up with it, then there's an argument to say that we should take (have taken) an intermediate step before full release.
(Would also be nice to see a "Long Covid" rate, but almost no-one seems to care about that.)
havoc said:
Thanks.
Good article all round (not always a given with the Guardian).
With regard to the skyrocketing case #s vs Wave 1 and Wave 2, do we know if these are definite, tested #s, or extrapolated whole-population #s?
...because we all know the government is testing the hell out of this virus now, which will skew the relative curves if it's just showing actual positive tests (i.e. Wave-1 and Wave-2 happened during periods of much lower testing, so that would exaggerate the vaccination's role in reducing e.g. deaths-per-1000-cases in Wave-3).
Cases look to be reported cases. As you mention, different levels of testing mean reported cases aren’t really comparable between the waves. Good article all round (not always a given with the Guardian).
With regard to the skyrocketing case #s vs Wave 1 and Wave 2, do we know if these are definite, tested #s, or extrapolated whole-population #s?
...because we all know the government is testing the hell out of this virus now, which will skew the relative curves if it's just showing actual positive tests (i.e. Wave-1 and Wave-2 happened during periods of much lower testing, so that would exaggerate the vaccination's role in reducing e.g. deaths-per-1000-cases in Wave-3).
I had a look at ZOE COVID symptom study results, and that suggests that symptomatic cases are rises at a similar rate for the two waves, so cases chart is a bit misleading.
CarlosFandango11 said:
There is some English hospital admissions data by age at the bottom of this page:
https://www.england.nhs.uk/statistics/statistical-...
However, I’m not convinced it’s consistent with what’s available data available from https://coronavirus.data.gov.uk/ - I was calculating hospitalisation rates of around 90% for 85+ year olds during May 2021.
Their age-groupings are ridiculous:-https://www.england.nhs.uk/statistics/statistical-...
However, I’m not convinced it’s consistent with what’s available data available from https://coronavirus.data.gov.uk/ - I was calculating hospitalisation rates of around 90% for 85+ year olds during May 2021.
- 0-5
- 6-17
- 18-54 (!!!)
- 55-64
- 65-74
- 75-84
- 85+
- Unknown
I can, to a degree, understand the greater graduations at the bottom and top end of the scale, but lumping 36 years of adults together is an utter joke...how the hell can our civil service not do statistics decently???
havoc said:
Their age-groupings are ridiculous:-
- 0-5
- 6-17
- 18-54 (!!!)
- 55-64
- 65-74
- 75-84
- 85+
- Unknown
I can, to a degree, understand the greater graduations at the bottom and top end of the scale, but lumping 36 years of adults together is an utter joke...how the hell can our civil service not do statistics decently???
I believe the 18-54 age grouping is intentional. Splitting it up would simply demonstrate the younger are at miniscule risk and out the scaremongering they have been doing for the last 15 months for a large section of the adult population.- 0-5
- 6-17
- 18-54 (!!!)
- 55-64
- 65-74
- 75-84
- 85+
- Unknown
I can, to a degree, understand the greater graduations at the bottom and top end of the scale, but lumping 36 years of adults together is an utter joke...how the hell can our civil service not do statistics decently???
Ashfordian said:
I believe the 18-54 age grouping is intentional. Splitting it up would simply demonstrate the younger are at miniscule risk and out the scaremongering they have been doing for the last 15 months for a large section of the adult population.
Absolutely this - it's frankly insulting how they can deliberately misrepresent data in this way in order to push a narrative but more worrying is how the majority just lap it up without question.Ashfordian said:
havoc said:
Their age-groupings are ridiculous:-
- 0-5
- 6-17
- 18-54 (!!!)
- 55-64
- 65-74
- 75-84
- 85+
- Unknown
I can, to a degree, understand the greater graduations at the bottom and top end of the scale, but lumping 36 years of adults together is an utter joke...how the hell can our civil service not do statistics decently???
I believe the 18-54 age grouping is intentional. Splitting it up would simply demonstrate the younger are at miniscule risk and out the scaremongering they have been doing for the last 15 months for a large section of the adult population.- 0-5
- 6-17
- 18-54 (!!!)
- 55-64
- 65-74
- 75-84
- 85+
- Unknown
I can, to a degree, understand the greater graduations at the bottom and top end of the scale, but lumping 36 years of adults together is an utter joke...how the hell can our civil service not do statistics decently???
Gassing Station | News, Politics & Economics | Top of Page | What's New | My Stuff