Stock market is a "fully-fledged epic bubble" and will burst
Discussion


Derek Chevalier said:
I've been pondering this and am not sure.
If you look at the bestselling funds on here (taking August as an example), many are 20%+ down YTD.
https://www.boringmoney.co.uk/learn/articles/best-...
At least my 1.5% savings account interest rate is outperforming the hell out of them... If you look at the bestselling funds on here (taking August as an example), many are 20%+ down YTD.
https://www.boringmoney.co.uk/learn/articles/best-...

b hstewie said:
hstewie said: Honestly those stocks are just brutal.
The founders of Carvana were worth $32B at the peak and it's down 87% now fair enough if you're down to your last billion it's still a pretty nice problem to have but christ
Carvana were buying a market. They offered us triple the trade in value for a car. We jumped at the offer and bought a new car from a dealer. The founders of Carvana were worth $32B at the peak and it's down 87% now fair enough if you're down to your last billion it's still a pretty nice problem to have but christ
Sister in law got a job there last year and has been promoted 4 times as they expanded. Her latest role… letting her staff go as part of the redundancies. She expects to be next.
Mr Whippy said:
What is ‘diversified’ though? Just stocks? Stock/bonds? Gold/cash/bitcoin/REIT etc?
I expect a lot of people want to know that.For what it's worth the "wealth preservation" funds have done OK to date so Troy, Ruffer, Capital Gearing.
Of course you miss out on quite a lot of upside and they're boring so a lot of people don't like them.
bhstewie said:
hstewie said: I expect a lot of people want to know that.
For what it's worth the "wealth preservation" funds have done OK to date so Troy, Ruffer, Capital Gearing.
Of course you miss out on quite a lot of upside and they're boring so a lot of people don't like them.
They’re not defensive according to some posters For what it's worth the "wealth preservation" funds have done OK to date so Troy, Ruffer, Capital Gearing.
Of course you miss out on quite a lot of upside and they're boring so a lot of people don't like them.

With a tracker you’re already holding where the money is going as well as where it’s left, assuming it stays in stocks.
If you have a growth fund and x trillion leaves growth stocks for oilers, banks, whatever then your fund goes down. If you hold a global tracker you already hold those oilers, banks etc so the loss is cushioned.
Those suffering the most this year will be those massively overweight tech and growth stocks. That overweight will be a result of buying more of what has done well in the recent past, a strategy that time and again has proven to not work (performance chasing) yet continually happens anyway.
h0b0 said:
bhstewie said:
hstewie said: Honestly those stocks are just brutal.
The founders of Carvana were worth $32B at the peak and it's down 87% now fair enough if you're down to your last billion it's still a pretty nice problem to have but christ
Carvana were buying a market. They offered us triple the trade in value for a car. We jumped at the offer and bought a new car from a dealer. The founders of Carvana were worth $32B at the peak and it's down 87% now fair enough if you're down to your last billion it's still a pretty nice problem to have but christ
Sister in law got a job there last year and has been promoted 4 times as they expanded. Her latest role… letting her staff go as part of the redundancies. She expects to be next.
I don’t blame them for trying to buy the market. CarMax was meant to be a write off for, I think, CircuitCity…
Is it a bit misleading to look at a global tracker (VWRL for example) and think it's all not been tooooo bad. The weak pound (or strong dollar) has given stuff like VWRL in my portfolio a soft-er landing. The exchange rate is what it is etc but this time last year the dollar was $1.41 to £1.
Mr Whippy said:
bhstewie said:
hstewie said: World tracker is down 7% YTD though.
Cliche time but if you're diversified it probably won't feel like anything is "popping" even if you're down.
What is ‘diversified’ though? Just stocks? Stock/bonds? Gold/cash/bitcoin/REIT etc?Cliche time but if you're diversified it probably won't feel like anything is "popping" even if you're down.
Plenty of global trackers are heavy into the USA as they work on market cap, and the big indexes had been gutted over the last 12-18 months but the big cap stuff kept rising masking the changes.
Also the dollar is strengthening so UK owners of USA stocks might be doing ok ish… for now…
https://www.evidenceinvestor.com/how-to-think-diff...
"The best predictor we have of future long-term returns is current valuations, with the Shiller CAPE 10 providing as much information as any valuation metric. With this in mind, we can observe that the three periods of extended underperformance by the S&P 500 Index were all preceded by the CAPE 10 at historically high levels relative to the long-term mean of about 17:
In September 1929, the CAPE 10 exceeded 32.
At the end of 1965, the CAPE 10 exceeded 24.
At the end of 1999, the CAPE 10 exceeded 44.
As of June 29, 2021, the CAPE 10 exceeded 38. That should serve as a warning to total market investors, considering that they have all their eggs in that one market beta basket. At the same time, because of their recent historic drawdown relative to the valuations of growth stocks, small value stocks are trading at close to their most historically cheap levels.
Derek Chevalier said:
At the end of 1999, the CAPE 10 exceeded 44.
Happy memories!For reference here are the number dating back to 1880 for the S&P500:
Mean: 16.94
Median: 15.87
Min: 4.78 (Dec 1920)
Max: 44.19 (Dec 1999)
Interesting that the low was 1920. I think if you asked most people they'd probably say 1929 or there about.
So after the big falls yesterday in the US and this morning in Asia.
How are your funds looking if you average 2019 to today? We had a lot posting up mega returns in 2021 / most wiped out?
I’ve only just looked at two individual stocks one is YTD down 21% and the other down 12%
Going back to 1/1/2019 that 12% is down 18% and the other is down 0.9%.
The unit trusts are all up significantly not going to check BT gulp and others I hold as sure as hell I’m down.
However not selling and continue to buy in monthly - not individual stocks as they can beat you hard.
I’m up 15-20% over that time.
But that’s through conveniently timed bearishishness and averaging out to cash since Nov ‘21.
That same bearishness cost me on the way up sooo.
I’m glad I left my £80k of ISAs on the sidelines in cash too… though again they’ve been sat in cash since 2017 (arguably because thought I might be needing the money) so again that bearishness has cost… but may soon turn out to have been neutral.
Tough times really.
Save for the opening of the account, all mine have been via monthly purchases of a range of funds/ETFs. By year of purchase:
2018: +43.1%
2019: +14.78%
2020: +14.07%
2021: -7.04%
2022: -1.73%
Every tranche from Dec-20 onwards is currently in the red to varying extents.
Main drags are Asian & emerging markets and smaller companies in the US.
2018: +43.1%
2019: +14.78%
2020: +14.07%
2021: -7.04%
2022: -1.73%
Every tranche from Dec-20 onwards is currently in the red to varying extents.
Main drags are Asian & emerging markets and smaller companies in the US.
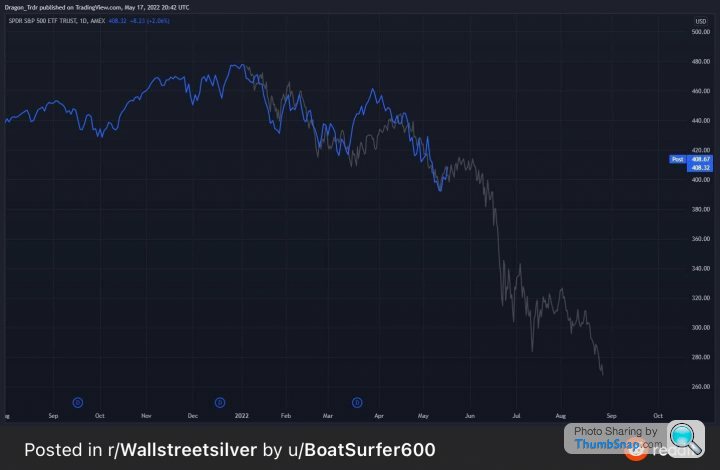
Another graph on the WallStreetSilver Twitter feed - 2008 crash vs current SPY:
https://twitter.com/WallStreetSilv/status/15267992...
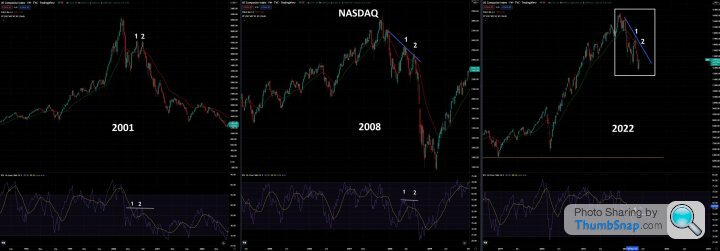
And what I think is a related graph?
https://twitter.com/FinanceLancelot/status/1521961...
https://twitter.com/WallStreetSilv/status/15267992...
And what I think is a related graph?
https://twitter.com/FinanceLancelot/status/1521961...
Edited by RSTurboPaul on Thursday 19th May 13:38
RSTurboPaul said:
Another graph on the WallStreetSilver Twitter feed - 2008 crash vs current SPY:
https://twitter.com/WallStreetSilv/status/15267992...
https://twitter.com/WallStreetSilv/status/15267992...
Is that verified? Its eerily, suspiciously, similar - if its right surely that means in 10 years it'll all be back up and dandy, and even better, we'll know the *exact* bottom in the next 12 months or so

edit - 15 not 10
Edited by bmwmike on Thursday 19th May 13:44
Welshbeef said:
So after the big falls yesterday in the US and this morning in Asia.
How are your funds looking if you average 2019 to today? We had a lot posting up mega returns in 2021 / most wiped out?
I’ve only just looked at two individual stocks one is YTD down 21% and the other down 12%
Going back to 1/1/2019 that 12% is down 18% and the other is down 0.9%.
The unit trusts are all up significantly not going to check BT gulp and others I hold as sure as hell I’m down.
However not selling and continue to buy in monthly - not individual stocks as they can beat you hard.
From 1/1/19 the S&P500 is up 58% as at close of market yesterday.How are your funds looking if you average 2019 to today? We had a lot posting up mega returns in 2021 / most wiped out?
I’ve only just looked at two individual stocks one is YTD down 21% and the other down 12%
Going back to 1/1/2019 that 12% is down 18% and the other is down 0.9%.
The unit trusts are all up significantly not going to check BT gulp and others I hold as sure as hell I’m down.
However not selling and continue to buy in monthly - not individual stocks as they can beat you hard.
You mean the aggregate of human emotions acting in unison on a closed system like our global financial system, has repeating patterns?
You can probably zoom in and out and do all sorts of stuff and see similar patterns over finite periods.
All I see is bad news and fear and CBs on full on tightening outlook.
It's got a way to go yet.
Only when the CBs talk about loosening, and then actually do it, will we know the bottom is approaching... given for the last 15 years CBs money makes the economy go... until they're back in feeding it, it'll be going nowhere.
Gassing Station | Finance | Top of Page | What's New | My Stuff