Your questions answered Vol 2 - IM Private Clients
Discussion


AdamIM said:
ajh349 said:
Neither my wife of I have received this email??
Hi Alan,We are looking into why that might be and in any event we will send you a copy. We have a yahoo address for you.
Edited to add- I've been told it was sent. can you please check your Spam inbox
Regards
Adam
Edited by AdamIM on Friday 24th March 09:40
I agree that the fuller follow up message posted on here should have been in the email as the whole rationale for the charge is much better explained there.
I’ve got no issue with the one off .15% and funnily enough this whole thing has reminded me what a good deal the PH offer is IMHO.
Without waiving the initial 1.5% joining fee, Mrs B and I probably wouldn’t have invested with IM and so wouldn’t have benefited from a really, really useful sit down chat with Nik which gave us a much better understanding not so much of the technicalities of investing but of how to best organise our money in a way that enables us to live the way we want to.
If we hadn’t chosen IM then we might have used Vanguard which is a decent alternative in pure investment terms but doesn’t offer the same level of personal service (oo err!) or we may have ended up using an IFA and paying fees completely out of proportion to our modest affairs.
And we wouldn’t have had a couple of great days out at the GT races either!
TLDR: Comms not great on this one (content, as much as timing) but overall service and performance still represents a great deal to me.
Hi Seapod,
The PHO graph is not displaying correctly as I've been told they are updating the tables
As mentioned. These are model PNL which won't align exactly with actual individual returns although a one off investment as opposed to many investments would be close. Model PNL is based on the stock holding weight set my the model which will drift up and down between rebalancing.EG say 2 stocks 50/50 and over time that ratio actually changes to 60/40 due to relative performance. Until we rebalance back to 50/50 the monthly 'model' PNL uses 50/50 which is a drift away from actual.
I will let you know when we have finished tinkering
Here is a quick example of how a model is used.
Assume P0 is day one, P1 is one month later, P2 two months later. The model generates 30% after month 1 and 16.67% month 2(based on 50% holding). Clearly the actual result is +55% after month 2 however the Model assumes the portfolio return when applied to the following periods delta. And if we used the actual month 2 weighting of 58% the model would had generated 19.23% (1.3 X 1.1923 = 55%)
The difference is called 'drift' and this example is quite extreme. In reality Model PNL is very close to actual under normal market conditions
Edited by AdamIM on Friday 24th March 14:38
seapod said:
Hi IM team,
Here is my very basic question which will give everyone a chance to laugh....;)
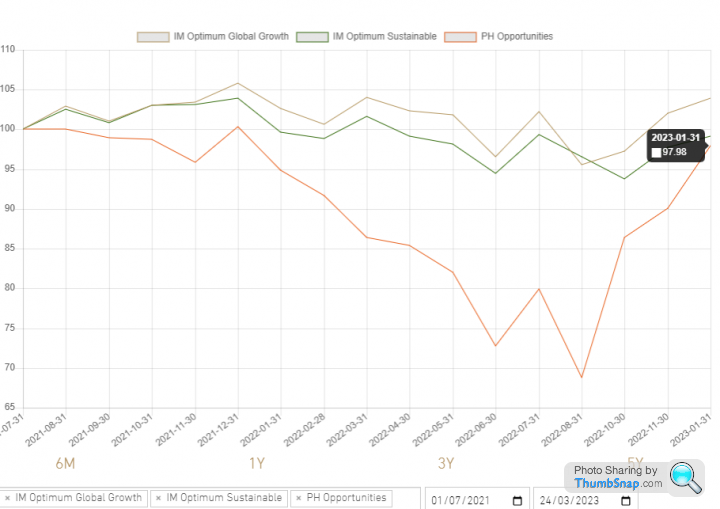
I can't work out why I am getting different results between the investment performance charts and the actuals of my portfolio. My troubled child investment has been PHO, so I have been glad to see recent gains as the FTSE 250 made some progress. However, if I select the date of my investment (2 x lumps in July '21) to the most recent date available on the investment return chart (31/01/23), it is showing as 97.98 vs index of 100.
I interpret this as £100 investment in July '21 would be worth £97.98 on this date. See below
However, if I look at my actual investment figures then it is shows a very different performance (at least at face value/how I interpret the data).
Here is my actual PHO fund value on 30/01/23
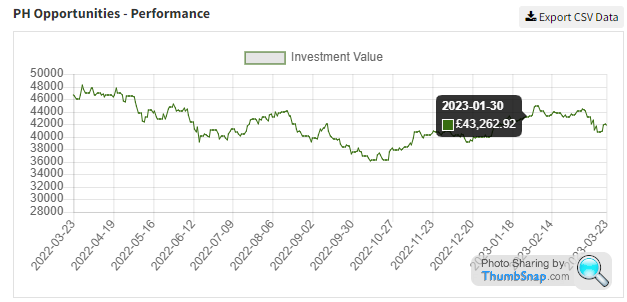
I invested £54,293 in July '21.
The value of my investment on 31/01/23 was therefore 79.75% on this date.
Why am I seeing a difference between the modelling tool and my actual values?
What are you actually trying to find out?Here is my very basic question which will give everyone a chance to laugh....;)
I can't work out why I am getting different results between the investment performance charts and the actuals of my portfolio. My troubled child investment has been PHO, so I have been glad to see recent gains as the FTSE 250 made some progress. However, if I select the date of my investment (2 x lumps in July '21) to the most recent date available on the investment return chart (31/01/23), it is showing as 97.98 vs index of 100.
I interpret this as £100 investment in July '21 would be worth £97.98 on this date. See below
However, if I look at my actual investment figures then it is shows a very different performance (at least at face value/how I interpret the data).
Here is my actual PHO fund value on 30/01/23
I invested £54,293 in July '21.
The value of my investment on 31/01/23 was therefore 79.75% on this date.
Why am I seeing a difference between the modelling tool and my actual values?
AdamIM said:
Hi Alan,
We are looking into why that might be and in any event we will send you a copy. We have a yahoo address for you.
Edited to add- I've been told it was sent. can you please check your Spam inbox
Regards
Adam
Hi Adam,We are looking into why that might be and in any event we will send you a copy. We have a yahoo address for you.
Edited to add- I've been told it was sent. can you please check your Spam inbox
Regards
Adam
Edited by AdamIM on Friday 24th March 09:40
We have both checked our spam folders and didn't find the emails!
Alan
AdamIM said:
Hi Seapod,
The PHO graph is not displaying correctly as I've been told they are updating the tables
As mentioned. These are model PNL which won't align exactly with actual individual returns although a one off investment as opposed to many investments would be close. Model PNL is based on the stock holding weight set my the model which will drift up and down between rebalancing.EG say 2 stocks 50/50 and over time that ratio actually changes to 60/40 due to relative performance. Until we rebalance back to 50/50 the monthly 'model' PNL uses 50/50 which is a drift away from actual.
I will let you know when we have finished tinkering
Here is a quick example of how a model is used.
Assume P0 is day one, P1 is one month later, P2 two months later. The model generates 30% after month 1 and 16.67% month 2(based on 50% holding). Clearly the actual result is +55% after month 2 however the Model assumes the portfolio return when applied to the following periods delta. And if we used the actual month 2 weighting of 58% the model would had generated 19.23% (1.3 X 1.1923 = 55%)
The difference is called 'drift' and this example is quite extreme. In reality Model PNL is very close to actual under normal market conditions
Thanks Adam. I think you are saying that the models/PHO Graphs are now working? The results haven't changed, hence q. Edit - They have broken again, only showing PHO to Jan 22 for me now.The PHO graph is not displaying correctly as I've been told they are updating the tables
As mentioned. These are model PNL which won't align exactly with actual individual returns although a one off investment as opposed to many investments would be close. Model PNL is based on the stock holding weight set my the model which will drift up and down between rebalancing.EG say 2 stocks 50/50 and over time that ratio actually changes to 60/40 due to relative performance. Until we rebalance back to 50/50 the monthly 'model' PNL uses 50/50 which is a drift away from actual.
I will let you know when we have finished tinkering
Here is a quick example of how a model is used.
Assume P0 is day one, P1 is one month later, P2 two months later. The model generates 30% after month 1 and 16.67% month 2(based on 50% holding). Clearly the actual result is +55% after month 2 however the Model assumes the portfolio return when applied to the following periods delta. And if we used the actual month 2 weighting of 58% the model would had generated 19.23% (1.3 X 1.1923 = 55%)
The difference is called 'drift' and this example is quite extreme. In reality Model PNL is very close to actual under normal market conditions
Edited by AdamIM on Friday 24th March 14:38
The 'drift' thing - Your explanation and examples explain it very well. However it leaves me with a sense of the finance industry using smoke, mirrors and unnecessary complexification to fob off old Joe public, aka 'the mark'. I'm referring to your 'this is how the industry does it' comment rather than IM specifically. I am a fan of yours to be clear.
Let's take a common use case for the models - i.e. why do you provide them? I was using them to help me work out if I wanted to do some re-balancing between investments. So I was comparing performance between them. The standard caveat of 'past performance is no indicator of future performance etc' is of course fully accepted.
In my example over the last 18 months the modeled performance of PHO would show as broadly flat. But in actual fact a single investment made over this period has returned negative 20%.
An unfortunate modelled outcome based on the specific dates and volatile market conditions I happened to pick. Quite probably.
Enough of a 'variance' to make a difference to my decision making on rebalancing? Quite possibly.
I think we would all accept that models cannot cater for every possible scenario, eg deposits, withdrawals, drips. But I am struggling to see why it is beyond the wit of man for them to show what I would believe to be some pretty common ones that would capture a good proportion of user requirements.
Use case: Show me investment performance for a specified product based on:
1) Scenario 1: A single investment made on the first date selected to the end date (I would postulate this is how most people think of performance)
2) Scenario 2: A monthly drip of a specified amount from the first date to the end date
You must capture the weighting, opening and closing price for each portfolio on a daily basis. From a coding perspective it should be straightforward.
Is this another opportunity for IM to 'stick it to the finance industry charlatans' by producing something straightforward for the common man?
Edited: Yes, the date it went live is Sept as per note above from Adam, I was using July as this is when I transferred funds. Modeling point stands as drift variance is material
Edited by seapod on Friday 24th March 15:41
ajh349 said:
AdamIM said:
Hi Alan,
We are looking into why that might be and in any event we will send you a copy. We have a yahoo address for you.
Edited to add- I've been told it was sent. can you please check your Spam inbox
Regards
Adam
Hi Adam,We are looking into why that might be and in any event we will send you a copy. We have a yahoo address for you.
Edited to add- I've been told it was sent. can you please check your Spam inbox
Regards
Adam
Edited by AdamIM on Friday 24th March 09:40
We have both checked our spam folders and didn't find the emails!
Alan
Regards
Adam
Here is an example of Actual Returns vs 'Model Returns'. I've tried to make it clear and simple.
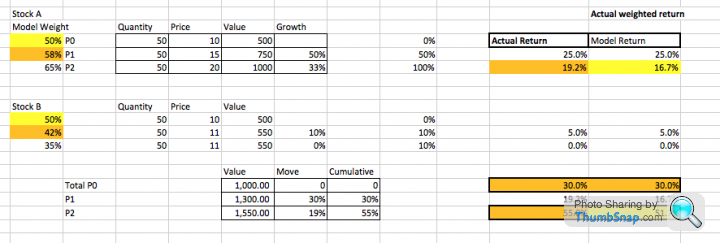
Yellow is the Model.
Orange is Actual
Model PNL simply uses the weighting defined by the model. In this case 50% each in two stocks. Daily prices move. You can see the price changes above and how they change the weighting from 50%(model) to 58% and 42%(and then 65/35). This example using Model weights would attribute 16.2% weighted PNL from Stock A however as it really comprises 58% of the portfolio it contributes 19.2% PNL .
We do include dividends in the Model PNL
Quarterly we rebalance to realign actual weights to our Models weights.
We do tweak Model weights also.
Have a great weekend all
Regards
Adam
Hi Seapod,
If PHO is still looking 'flat' then it is not correct. It's a simple fix -Monday
Model PNL is used to fill in gaps for historical returns, if say, one reports a 5 year return but only 4 years is available.
In due course we will move to an actual performance reporting basis, going forward.
Lot's going on in the markets. I will post some thoughts next week.
Regards
Adam
 t
tAdamIM said:
Hi Seapod,
If PHO is still looking 'flat' then it is not correct. It's a simple fix -Monday
Model PNL is used to fill in gaps for historical returns, if say, one reports a 5 year return but only 4 years is available.
In due course we will move to an actual performance reporting basis, going forward.
Lot's going on in the markets. I will post some thoughts next week.
Regards
Adam
Thanks AdamIf PHO is still looking 'flat' then it is not correct. It's a simple fix -Monday
Model PNL is used to fill in gaps for historical returns, if say, one reports a 5 year return but only 4 years is available.
In due course we will move to an actual performance reporting basis, going forward.
Lot's going on in the markets. I will post some thoughts next week.
Regards
Adam
Gassing Station | Finance | Top of Page | What's New | My Stuff