Dyno Dynamics - Shoot out modes
Discussion


Mignon said:
spitfire4v8 said:
Std car quoted at 301hp
dyno dynamics say 302 for a tested std car.
Mignon suggests 275hp is more realistic
Only on the basis of your tests of how much S6F seems to read above steady state. But who knows how that other dyno reads. I've seen Dasteks read differently and one that moved premises never read the same again after the move.dyno dynamics say 302 for a tested std car.
Mignon suggests 275hp is more realistic
Looking at Rototest figures BMW seem to accurate or even conservative in their power claims. They haven't tested the 135i but similar cars are certainly making the claimed numbers.
Of course we have no actual proof that the steady state mode reads true either on any particular dyno. I suppose it's not beyond the realm of possibility that it reads low on some of them and the shootout mode in some conditions corrects for that.
It was all much easier in'th olden days. When I were a lad people only had Clayton water brake rollers that only gave wheel figures and as far as I could tell from customers who tried several of them with the same car they all read near as dammit the same. A bloke from Clayton used to go round calibrating them with his company car Sierra estate I think it was. Well he used the weights and stuff first but he always gave it a run on the Sierra just to make sure he hadn't cocked things up.
I put my Mk1 Astra Gte on a bunch of dynos back in the 80s/early 90s and every one said 90 at the wheels. Dave Walker used it for a cam test article in CCC magazine once. Very expensive Shrick cam I think it was and it made not an effing scrap of difference.
Then people started wanting flywheel numbers and some idiot invented the coast down procedure and more idiots tinkered with computers massaging the numbers and it all went to hell in a handbasket. Talking of hell, if there's a highway to hell but only a staircase to heaven I guess that gives you some idea of the relative traffic numbers they were expecting.
Those were the days Dave, I remember testing your Astra, with hindsight do you thinking altering the cr to suit the different cams would have made a difference?
Lee Higgins used to service and calibrate the Clayton dynos, he also serviced the Camic co/hc meters. Sadly he died late 90s. Robin from Clayton used to do the work after that but it was £75 an hour. We were flooded in 2001 and the insurance paid out for a full rebuild carried out by Robin. When Clayton stopped working on the dynos I inherited the calibration weights and the gauge for calibration. We still have them to match the Clayton engine dyno we have never used, complete with flashy digital horsepower torque and rpm readout, not a patch on the old quivering needle on the wall.
Lee Higgins used to service and calibrate the Clayton dynos, he also serviced the Camic co/hc meters. Sadly he died late 90s. Robin from Clayton used to do the work after that but it was £75 an hour. We were flooded in 2001 and the insurance paid out for a full rebuild carried out by Robin. When Clayton stopped working on the dynos I inherited the calibration weights and the gauge for calibration. We still have them to match the Clayton engine dyno we have never used, complete with flashy digital horsepower torque and rpm readout, not a patch on the old quivering needle on the wall.
GregK2 said:
I have a log I took myself if that helps?
https://datazap.me/u/gregk2/stage2?log=0&data=...
Are you able to export that data to say a CSV file and does it also have an each piece time stamped?https://datazap.me/u/gregk2/stage2?log=0&data=...
Stan
Stan Weiss said:
GregK2 said:
I have a log I took myself if that helps?
https://datazap.me/u/gregk2/stage2?log=0&data=...
Are you able to export that data to say a CSV file and does it also have an each piece time stamped?https://datazap.me/u/gregk2/stage2?log=0&data=...
Stan
It gives time in seconds / ms. Selecting "Time" in the graph lets you see it also.
https://docs.google.com/spreadsheets/d/1dJdm-eH_hk...
Edited by GregK2 on Thursday 15th November 19:24
Stan Weiss said:
Are you able to export that data to say a CSV file and does it also have an each piece time stamped?
Stan
Look more closely at the page Stan. The data is all there in a chart. There is even a column for torque at the clutch and I have no idea how the car knows that but the numbers are not far off the dyno chart ones.Stan
GregK2 said:
Yes, it starts as a CSV that I upload to datazap to create the graph. But the CSV can be opened too.
It gives time in seconds / ms. Selecting "Time" in the graph lets you see it also.
https://docs.google.com/spreadsheets/d/1dJdm-eH_hk...
Thanks, i will have look and see if I can calculate anything from those numbers.It gives time in seconds / ms. Selecting "Time" in the graph lets you see it also.
https://docs.google.com/spreadsheets/d/1dJdm-eH_hk...
Edited by GregK2 on Thursday 15th November 19:24
Stan
If the OP wishes to find an absolutely flat bit of road and datalog a full throttle run in 3rd gear all the way through the rev range then Stan and I will tell you exactly how many horsies you have. We'll need tyre size, gear ratios and vehicle weight as tested with fuel and driver. Aero drag would be nice too but it's not hugely critical. cD and frontal area if you can find it.
A little history. 10 or more years ago I wrote a routine to take OBDII data logging and to try to produce a HP and Torque curve. The generated curves were useless without massive smoothing. So I gave up. Later I was then able to get data from an engine inertia dyno which worked very well with my code without any smoothing.
This data produces the same useless curves without massive smoothing. Here are graphs of the raw and smoothed data. I still need to spend some more time playing with a few of the programs inputs.
Stan
This data produces the same useless curves without massive smoothing. Here are graphs of the raw and smoothed data. I still need to spend some more time playing with a few of the programs inputs.
Stan
 Raw data calculations

                            Rear     Aero     Rolling            Rear W  Accele   Time   Rate
  RPM      MPH   Velocity   Wheel   dynamic   Resist.  Elapsed    Horse  ration  Differ Rev Per
                  ft/sec   Torque  Drag - HP    HP      Time      Power  in G's  ential   Sec

 2434.0 173.787  254.888     0.00      .000    .000    .0000       0.00  0.0000  0.0000     0.0
 2446.0 174.644  256.145    67.67      .000    .000    .1010      31.52   .3867  0.1010   118.8
 2458.0 175.501  257.401    62.14      .000    .000    .2110      29.08   .3551  0.1100   109.1
 2474.0 176.643  259.077    81.37      .000    .000    .3230      38.33   .4650  0.1120   142.9
 2484.0 177.357  260.124    52.26      .000    .000    .4320      24.72   .2986  0.1090    91.7
 2500.0 178.500  261.799    84.38      .000    .000    .5400      40.17   .4822  0.1080   148.1
 2514.0 179.499  263.265    71.20      .000    .000    .6520      34.08   .4068  0.1120   125.0
 2525.0 180.285  264.417    58.01      .000    .000    .7600      27.89   .3315  0.1080   101.9
 2538.0 181.213  265.779    67.31      .000    .000    .8700      32.53   .3847  0.1100   118.2
 2554.0 182.355  267.454    89.35      .000    .000    .9720      43.45   .5106  0.1020   156.9
 2568.0 183.355  268.920    73.84      .000    .000   1.0800      36.10   .4219  0.1080   129.6
 2586.0 184.640  270.805    92.37      .000    .000   1.1910      45.48   .5278  0.1110   162.2
 2602.0 185.782  272.481    82.85      .000    .000   1.3010      41.05   .4734  0.1100   145.5
 2636.0 188.210  276.041   195.62      .000    .000   1.4000      98.18  1.1178  0.0990   343.4
 2654.0 189.495  277.926    56.96      .000    .000   1.5800      28.78   .3255  0.1800   100.0
 2710.0 193.494  283.791   289.97      .000    .000   1.6900     149.62  1.6570  0.1100   509.1
 2747.0 196.135  287.665   210.75      .000    .000   1.7900     110.23  1.2043  0.1000   370.0
 2806.0 200.348  293.844   300.05      .000    .000   1.9020     160.31  1.7146  0.1120   526.8
 2855.0 203.847  298.975   284.79      .000    .000   2.0000     154.81  1.6274  0.0980   500.0
 2881.0 205.703  301.698   135.87      .000    .000   2.1090      74.53   .7764  0.1090   238.5
 2979.0 212.700  311.960   502.88      .000    .000   2.2200     285.24  2.8736  0.1110   882.9
 3055.0 218.126  319.919   393.53      .000    .000   2.3300     228.91  2.2488  0.1100   690.9
 3106.0 221.768  325.260   264.08      .000    .000   2.4400     156.18  1.5090  0.1100   463.6
 3164.0 225.909  331.333   297.62      .000    .000   2.5510     179.30  1.7007  0.1110   522.5
 3229.0 230.550  338.140   373.97      .000    .000   2.6500     229.92  2.1370  0.0990   656.6
 3312.0 236.476  346.832   472.76      .000    .000   2.7500     298.13  2.7015  0.1000   830.0
 3382.0 241.474  354.162   394.76      .000    .000   2.8510     254.21  2.2558  0.1010   693.1
 3423.0 244.402  358.456   259.48      .000    .000   2.9410     169.12  1.4827  0.0900   455.6
 3500.0 249.899  366.519   438.58      .000    .000   3.0410     292.28  2.5062  0.1000   770.0
 3578.0 255.469  374.687   407.60      .000    .000   3.1500     277.68  2.3291  0.1090   715.6
 3648.0 260.467  382.018   359.20      .000    .000   3.2610     249.50  2.0526  0.1110   630.6
 3730.0 266.321  390.605   467.06      .000    .000   3.3610     331.71  2.6689  0.1000   820.0
 3769.0 269.106  394.689   201.94      .000    .000   3.4710     144.92  1.1540  0.1100   354.5
 3854.0 275.175  403.590   474.66      .000    .000   3.5730     348.31  2.7123  0.1020   833.3
 3929.0 280.530  411.444   435.91      .000    .000   3.6710     326.10  2.4909  0.0980   765.3
 3967.0 283.243  415.423   216.44      .000    .000   3.7710     163.49  1.2368  0.1000   380.0
 4031.0 287.813  422.125   328.41      .000    .000   3.8820     252.06  1.8766  0.1110   576.6
 4114.0 293.739  430.817   433.72      .000    .000   3.9910     339.74  2.4784  0.1090   761.5
 4169.0 297.666  436.577   313.27      .000    .000   4.0910     248.67  1.7901  0.1000   550.0
 4246.0 303.164  444.640   434.24      .000    .000   4.1920     351.06  2.4814  0.1010   762.4
 4302.0 307.162  450.504   318.97      .000    .000   4.2920     261.27  1.8227  0.1000   560.0
 4354.0 310.875  455.950   299.18      .000    .000   4.3910     248.02  1.7096  0.0990   525.3
 4420.0 315.587  462.861   372.21      .000    .000   4.4920     313.24  2.1269  0.1010   653.5
 4480.0 319.871  469.145   345.20      .000    .000   4.5910     294.46  1.9726  0.0990   606.1
 4554.0 325.155  476.894   383.18      .000    .000   4.7010     332.25  2.1896  0.1100   672.7
 4604.0 328.725  482.130   256.57      .000    .000   4.8120     224.92  1.4661  0.1110   450.5
 4672.0 333.580  489.251   355.34      .000    .000   4.9210     316.10  2.0305  0.1090   623.9
 4740.0 338.435  496.372   348.94      .000    .000   5.0320     314.92  1.9939  0.1110   612.6
 4806.0 343.148  503.283   341.75      .000    .000   5.1420     312.73  1.9529  0.1100   600.0
 4861.0 347.075  509.043   310.17      .000    .000   5.2430     287.08  1.7724  0.1010   544.6
 4912.0 350.716  514.383   268.97      .000    .000   5.3510     251.56  1.5370  0.1080   472.2
 4974.0 355.143  520.876   353.14      .000    .000   5.4510     334.45  2.0180  0.1000   620.0
 5042.0 359.998  527.997   348.94      .000    .000   5.5620     334.98  1.9939  0.1110   612.6
 5110.0 364.853  535.118   387.32      .000    .000   5.6620     376.85  2.2133  0.1000   680.0
 5134.0 366.567  537.631   135.35      .000    .000   5.7630     132.31   .7734  0.1010   237.6
 5194.0 370.851  543.914   310.68      .000    .000   5.8730     307.25  1.7753  0.1100   545.5
 5262.0 375.706  551.035   358.63      .000    .000   5.9810     359.31  2.0493  0.1080   629.6
 5323.0 380.061  557.423   313.02      .000    .000   6.0920     317.25  1.7887  0.1110   549.5
 5376.0 383.846  562.973   298.89      .000    .000   6.1930     305.95  1.7080  0.1010   524.8
 5415.0 386.630  567.057   226.67      .000    .000   6.2910     233.71  1.2953  0.0980   398.0
 5470.0 390.557  572.817   279.71      .000    .000   6.4030     291.32  1.5983  0.1120   491.1
 5534.0 395.127  579.519   331.40      .000    .000   6.5130     349.19  1.8937  0.1100   581.8
 5570.0 397.697  583.289   209.24      .000    .000   6.6110     221.91  1.1956  0.0980   367.3
 5610.0 400.553  587.478   227.84      .000    .000   6.7110     243.37  1.3019  0.1000   400.0
 5690.0 406.265  595.855   414.25      .000    .000   6.8210     448.79  2.3671  0.1100   727.3
 5710.0 407.693  597.950   101.71      .000    .000   6.9330     110.58   .5812  0.1120   178.6
 5780.0 412.691  605.280   402.74      .000    .000   7.0320     443.23  2.3014  0.0990   707.1
 5849.0 417.618  612.506   396.99      .000    .000   7.1310     442.11  2.2685  0.0990   697.0
 5854.0 417.975  613.029    25.66      .000    .000   7.2420      28.60   .1466  0.1110    45.0
 5912.0 422.116  619.103   297.62      .000    .000   7.3530     335.02  1.7007  0.1110   522.5
 5982.0 427.114  626.434   362.47      .000    .000   7.4630     412.85  2.0712  0.1100   636.4
 6014.0 429.399  629.785   154.46      .000    .000   7.5810     176.88   .8827  0.1180   271.2
 6058.0 432.540  634.392   229.93      .000    .000   7.6900     265.21  1.3139  0.1090   403.7
 6099.0 435.468  638.686   210.39      .000    .000   7.8010     244.32  1.2022  0.1110   369.4

 Averages                  271.29                                221.91          0.1069  476.3

  Smoothed
   Torque
   67.674
   67.674
   62.137
   69.478
   68.665
   69.757
   70.115
   70.072
   73.635
   77.228
   87.152
   95.857
  114.766
  140.697
  166.513
  207.624
  226.753
  256.146
  284.855
  298.030
  330.946
  337.548
  343.258
  358.430
  361.108
  375.882
  381.631
  376.990
  387.706
  379.595
  379.748
  386.917
  365.450
  366.676
  361.152
  343.170
  354.463
  357.262
  354.210
  362.507
  351.626
  345.349
  344.817
  339.549
  340.078
  334.005
  333.945
  329.541
  325.167
  323.831
  323.967
  321.149
  315.415
  309.837
  294.794
  298.323
  299.256
  294.650
  295.837
  281.199
  271.885
  275.911
  264.433
  270.653
  287.372
  271.396
  282.020
  278.032
  248.315
  255.651
  245.291
  154.465
  229.925
  210.388
     .000
Edited by Stan Weiss on Thursday 15th November 22:07
Edited by Stan Weiss on Thursday 15th November 22:08
spitfire4v8 said:
As an aside .. are there any motor manufacturers or engine tuners/builders who actually do publish accurate information ? You'd natually assume that BMW might publish accurate info, but I don't know.
I'm not involved myself, but I understand there are regulations about how the published figure is measured, including things like correcting to established environmental conditions and various tolerances for the accuracy of the measurement equipment. I've been told the manufacturers game the system quite extensively and will measure with equipment and under conditions which allow them to bias the results in their favour. Mignon said:
Most of it isn't at full throttle Stan so there's not much to deduce from it.
My bad. I missed that the pedal position was 100% and the throttle is drive by wire so that only opens as much as needed. Assuming that was a flat road I obtained a perfect acceleration curve matching actual to calculated 10 mph increments to within 0.01 seconds for every increment. I've never actually obtained a curve as perfect as that right the way through a gear.At the flywheel you have peak torque of 417 ft lbs at about 3000 to 3500 rpm and peak power is 357 at about 5000 to 5250. That's 303 bhp at the wheels.
From the intergoogles I obtained curb weight of 3420 lbs so plus driver I used 3600. Final drive 3.08, 3rd gear 1.58, rear tyres 245/35/18. MPH per 1000 rpm in 3rd is 14.53. Frontal area 22.4 sq ft, cD 0.33. Spec sheet is here.
http://media.caranddriver.com/files/2008-bmw-135i-...
The car is very traction limited, it'll light the tyres up without even trying so acceleration off the line depends on tyres and launch but on very good road tyres I get 0-60 mph in 4.7s. 1/4 mile is 13.26 @ 110 mph. Top speed is 171.
A couple more minor points. My computer system calculated the boost pressure it would expect from the torque curve it calculated to match the actual acceleration. At peak torque at 3000 rpm it calculated 13.8 psi. Your datalog says exactly 13.8 psi. It's actually overshooting the target boost there by quite a bit and the timed acceleration shows that up very clearly. At peak power at 5000 rpm the computer calculates 12.8 psi and the datalog says 12.9 psi. So I can be very confident that the computer's calculated power curve is exactly matching not only the timed acceleration but also the actual boost pressures generated. Above 3500 rpm the actual boost is lagging the target boost a bit. The final calculation the computer did was the power curve if you could achieve target boost and it says 367 to 370 bhp at 5100 rpm.
With the cross check of not only timed performance but boost pressure curves and the 0.01 second match between calculated and actual times I can rate that simulation to 1% accuracy. Less than 4 bhp or 4 ft lbs error assuming the car weight I've used is correct and there was no gradient involved.
Using actual performance and Newtonian physics is actually far more accurate than rolling roads or even engine dynos which as we've seen have too much buggering about with the numbers going on inside them. F=ma doesn't have any error built in unless you're travelling at relativistic speeds or in a very strong gravity well and I think I can discount both of those for a BMW.
Fascinating stuff but it brings one back to the fact the dyno whether engine or chassis is by far a quicker way of sorting the car tuning than going up and down a theoretical empty road where there are no speed limits or time restrictions on measurement. You are still making many assumptions to make the numbers fit eg car completely warmed up, tyre pressure, width and grip and compound, road surface friction and temperatures etc etc. certainly your method of chomping numbers is cheaper than buying a dyno. but hey, I can change the timing or fuelling in a couple of minutes then get results in seconds. Using a rolling road for tuning,taking the argument of figures to the lowest level, assuming the numbers are repeatable, in statistical analysis perhaps the most powerful test is the sign test, + or - . All one does is compare pluses and minuses from the test results, make a decision and move on. Result, happy customers whether road or race. The dyno is only a tool as many of us keep saying, use that tool correctly and it is a good tool which maybe explains why most tuners use dyno testing in some guise rather than drive up and down a road. I suppose it would be fun for a dedicated person to do tests your way before and after testing to see the modelled differences.
So I cranked up my simulator today...
Same atmos. conditions as the OP
This is the car producing 330 hp @ 5500 rpm in Shoot_2R, ramping at 100

280 WHP, 330 Fly.
I then changed to Shoot_6F, without touching the simulator :
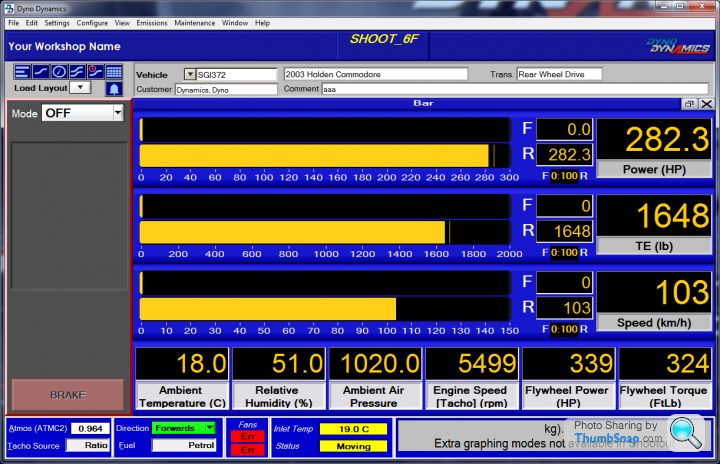
282 WHP, 339 Fly.
The 2 hp higher WHP figure (<1%) is due to the assumed higher driveline inertia and the fact we're accelerating. If I switch the simulator to steady state, there's no difference in WHP between Shoot_2R and Shoot_6F, as you'd expect.
The rest of the difference in FHP is due to slightly higher calculated losses in Shoot_6F.
So the estimated power loss in this case is 15% at that power & speed (103 kph).
Same atmos. conditions as the OP
This is the car producing 330 hp @ 5500 rpm in Shoot_2R, ramping at 100
280 WHP, 330 Fly.
I then changed to Shoot_6F, without touching the simulator :
282 WHP, 339 Fly.
The 2 hp higher WHP figure (<1%) is due to the assumed higher driveline inertia and the fact we're accelerating. If I switch the simulator to steady state, there's no difference in WHP between Shoot_2R and Shoot_6F, as you'd expect.
The rest of the difference in FHP is due to slightly higher calculated losses in Shoot_6F.
So the estimated power loss in this case is 15% at that power & speed (103 kph).
GreenV8S said:
I'm not involved myself, but I understand there are regulations about how the published figure is measured, including things like correcting to established environmental conditions and various tolerances for the accuracy of the measurement equipment. I've been told the manufacturers game the system quite extensively and will measure with equipment and under conditions which allow them to bias the results in their favour.
It's better than it used to be : the current standards basically require the engine to be tested "as fitted", so with all accessories, equivalent exhaust, etc.Back when we started this flywheel power malarkey, we kept getting low fly power figures for one particular model car, compared to the brochure figure. An unofficial chat with a couple of the manufacturer's engineers revealed that they couldn't get the official power figure on their engine dyno either...
but things are better now.
Gassing Station | Engines & Drivetrain | Top of Page | What's New | My Stuff