
FTSE average yields
Discussion


Not sure why you want the yield vs. the absolute FTSE since you can't get the divs without owning the underlying!
In other words the YIELD is already comparing with the value of the underlying - that's what a yield is!
Perhaps what you mean is TSR (total shareholder return) vs. NOT reinvesting the divs - that's this one:
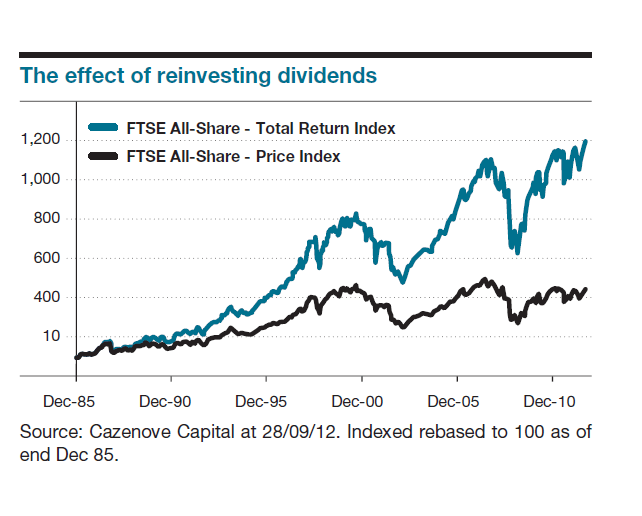
If you just want to compare whether the FTSE is cheap on a dividend basis relative to other yields such as gilts you can use this one:
Yield in blue.

In other words the YIELD is already comparing with the value of the underlying - that's what a yield is!
Perhaps what you mean is TSR (total shareholder return) vs. NOT reinvesting the divs - that's this one:
If you just want to compare whether the FTSE is cheap on a dividend basis relative to other yields such as gilts you can use this one:
Yield in blue.
Yes, I know, but I was curious to compare the two graphs, since I was trying to get at a graph that would show me, just perhaps, a buying moment. If, for example, over a 10 year period there was a moment when a certain average dividend level hit X the market took off, or fell, as the case may be, it would be a buy/sell signal. Euphoric perhaps, but it was a fleeting thought!
As I see it the ABSOLUTE dividend paid by the FTSE 100 is fairly constant - ish over time.
So looking at the yield is really just looking at the inverse of the FTSE.
Hence when the yield is really high it would be a buy signal on your rationale since the FTSE would be very low.
(And vice versa).
Unfortunately that just equates to a buy low and sell high strategy.
How to set the limits is the problem!
As the chart vs. gilts shows, investors have seen equities as higher risk overall so the yield is on a general upward trend.
Therefore looking for buy/sell triggers isn't just a question of applying RTTM methodology since that mean is gradually climbing over time.
For example buying at a yield of 3% worked in the 90s but would have hurt in the 00s.
Buying at 4% worked in the 00s but would have made you ride the whole credit crunch... and so on.
Nice chart the top one. My memory was telling me 40% return from capital gain and 60% more from divi reinvestment, but actually its even more for the ftse!
Nice. Will be interesting in 10 years time to look back and see what the total returns equities vs gilts are. I suspect very little returns in real terms on gilts if at all... but we shall see.
The Japs may have a different view!
Nice. Will be interesting in 10 years time to look back and see what the total returns equities vs gilts are. I suspect very little returns in real terms on gilts if at all... but we shall see.
The Japs may have a different view!
walm said:
As I see it the ABSOLUTE dividend paid by the FTSE 100 is fairly constant - ish over time.
Well, not as I see it. If we take Black Monday as an example, on the Friday the average FTSE yield was low, but following the crash on Monday it was much higher with the same component companies. I know the FTSE members change nowadays more than before, but the point I make is still valid, so that is why I am trying to correlate a yield graph with a price graph.On the subject of gilts, anyone investing now must be foolish I feel. Redemption yields are ridiculous, and there can only be capital losses even in the medium term as, perhaps from 2017 onwards, interest rates rise. Have a look back to 1977 and about 1990(?) when flat yields were approaching 16%. Low yielding stocks had enormous redemption capital gains - all tax free too.
lowdrag said:
walm said:
As I see it the ABSOLUTE dividend paid by the FTSE 100 is fairly constant - ish over time.
Well, not as I see it. If we take Black Monday as an example, on the Friday the average FTSE yield was low, but following the crash on Monday it was much higher with the same component companies.All you are saying is that the stock market fell on Black Monday.
What I am saying is that yield doesn't offer much more insight than just looking at the actual price of the FTSE since the ABSOLUTE dividend paid is fairly constant.
Imagine the FTSE happens to pay a 300 dividend. So at 6,000 the yield is 5%.
That dividend might grow steadily over time - perhaps up 5% per year - so next year it is 315. If the FTSE is still at 6,000 the following year then the yield is now 5.25%.
However if the FTSE drops 33% then the yield is a much higher 7.9%.
So the volatility in FTSE dividend yield (IMHO) is driven far more by the volatity in the FTSE rather than the dividend the FTSE pays because as I said - the dividend it pays isn't very volatile.
Therefore you might as well just look at a chart of the price of the FTSE and forget yields. I don't think it offers much deeper insight.
Just my 2p.
lowdrag said:
Yes, I know, but I was curious to compare the two graphs, since I was trying to get at a graph that would show me, just perhaps, a buying moment. If, for example, over a 10 year period there was a moment when a certain average dividend level hit X the market took off, or fell, as the case may be, it would be a buy/sell signal. Euphoric perhaps, but it was a fleeting thought!
Maybe look at the Price/fair value ratio of the shares in question.If it creeps over 1 then take at look at the coverage. if the div is not well covered could be time to sell, or at least pay attention.
A lower ratio would indicate ap ossible buying op.
FYI DOW is currently 1.0 (I think, I'm actually not a chartist techie type)
Should you wish to "get into this" look at the MACD crossovers.
Edited by jeff m2 on Monday 28th January 15:32
walm said:
jeff m2 said:
Maybe look at the Price/fair value ratio of the shares in question.
Hmmm... "fair value" that well known and easily determined financial metric...If everybody knew fair value then the stock market would be an awful lot less volatile!
Alternatively, if Lowdrag were to use the earnings yield and not div y then plenty of graphs are available because that is commonly used by fund managers.
I assumed he was trying to look at things from a different angle hence suggested the P/fv and then
looked at the div yield coverage.
As I said previously I'm not a great believer in charts n stuff but with everybody chasing dividends the p/fv is an easy way to see if something is a tad overbought.
I actually did some work on it (well, googled it).
This is some BS metric based on say Morningstar's analysts' estimated fair value for the FTSE (or rather the aggregate fair value of the 100 constituents).
Hence it is a massive case of garbage in = garbage out.
Fair value is not an objectively definable financial metric.
It is an analyst's GUESS as to the fair value of a stock or index.
Frankly, what the OP is looking for is far more likely to be the PE over time.
walm said:
I actually did some work on it (well, googled it).
This is some BS metric based on say Morningstar's analysts' estimated fair value for the FTSE (or rather the aggregate fair value of the 100 constituents).
Hence it is a massive case of garbage in = garbage out.
Fair value is not an objectively definable financial metric.
It is an analyst's GUESS as to the fair value of a stock or index.
Frankly, what the OP is looking for is far more likely to be the PE over time.
This is some BS metric based on say Morningstar's analysts' estimated fair value for the FTSE (or rather the aggregate fair value of the 100 constituents).
Hence it is a massive case of garbage in = garbage out.
Fair value is not an objectively definable financial metric.
It is an analyst's GUESS as to the fair value of a stock or index.
Frankly, what the OP is looking for is far more likely to be the PE over time.
 I agree
but the forward looking PE is also tea leaf stuff
I can only suggest using the Earnings yield then.
Can't see it being mentioned very much but you need to take into account 2 things:
1. FTSE quoted yields are historic.
2. The FTSE100 as an index is the rotating top 100, so it tends to reward share price performance.
A classic situation was the apparent rise in yields in early 2009. This was caused by a huge sell-off of shares which pushed the FTSE100 below 4,000. Of course one of the causes was a fear that companies would cut back dividends as the recession bit into earnings. Which meant that actual dividends were likely to fall not rise, despite what the charts showed.
oyster said:
2. The FTSE100 as an index is the rotating top 100, so it tends to reward share price performance.
Not sure what you mean here.Of course the companies included in the FTSE100 change - Easyjet for example has been on such a tear that it might be included in the next re-shuffle.
IIRC those re-shuffles happen every quarter.
However, the FTSE doesn't necessarily go up on the day the companies in it change.
It depends on how they each trade that day - as per normal.
It is just that the weightings and individual companies that count change.
Perhaps what you mean is that the FTSE is somewhat momentum driven since a stock that is doing well might well continue to do well (if you happen to believe in that style of investing).
So a new bunch of companies each Q - all of whom by definition are doing better than others - might help the FTSE continue to do well - particularly since you remove some doing less well.
Oh one final thought - there will be some technical buying of new entrants into the FTSE that will potentially force up those new entrants for a couple of days as the trackers etc... have to buy in.
That might be what you mean?
It doesn't really "reward" share price performance though - other than for those few days around a re-jig.
Gassing Station | Finance | Top of Page | What's New | My Stuff