Medieval Warm period due to NAO
Discussion


nigelfr said:
turbobloke said:
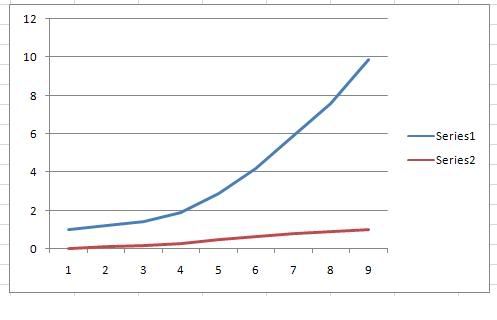
The idea of using a log plot is curious, I can't see how it would help make things look any better, in appearance or reality. Ten seconds in Excel shows what the general type of curve that carbon dioxide exhibits over time would look as a log plot (log10 shown here). The curve mimicking the shape of the carbon dioxide trend is in blue, the corresponding log plot is in red. Whatever, it doesn't make things any better.
AGW 101Climate sensitivity is the amount of global warming following a doubling of carbon dioxide concentrations. Estimates indicate that it is likely to be in the range of 2 to 4.5 °C, with a best estimate of about 3 °C. So go from about 280 ppm to 560 ppm for a warming in the range 2 to 4.5 °C. Double it again to 1120 to get the same temp. increase.
Like, er come on guys, you knew that didn't you?
s2art said:
nigelfr said:
turbobloke said:
The idea of using a log plot is curious, I can't see how it would help make things look any better, in appearance or reality. Ten seconds in Excel shows what the general type of curve that carbon dioxide exhibits over time would look as a log plot (log10 shown here). The curve mimicking the shape of the carbon dioxide trend is in blue, the corresponding log plot is in red. Whatever, it doesn't make things any better.
AGW 101Climate sensitivity is the amount of global warming following a doubling of carbon dioxide concentrations. Estimates indicate that it is likely to be in the range of 2 to 4.5 °C, with a best estimate of about 3 °C. So go from about 280 ppm to 560 ppm for a warming in the range 2 to 4.5 °C. Double it again to 1120 to get the same temp. increase.
Like, er come on guys, you knew that didn't you?
ZondaMan said:
s2art said:
nigelfr said:
turbobloke said:
The idea of using a log plot is curious, I can't see how it would help make things look any better, in appearance or reality. Ten seconds in Excel shows what the general type of curve that carbon dioxide exhibits over time would look as a log plot (log10 shown here). The curve mimicking the shape of the carbon dioxide trend is in blue, the corresponding log plot is in red. Whatever, it doesn't make things any better.
AGW 101Climate sensitivity is the amount of global warming following a doubling of carbon dioxide concentrations. Estimates indicate that it is likely to be in the range of 2 to 4.5 °C, with a best estimate of about 3 °C. So go from about 280 ppm to 560 ppm for a warming in the range 2 to 4.5 °C. Double it again to 1120 to get the same temp. increase.
Like, er come on guys, you knew that didn't you?
hairykrishna said:
Do you not have a source that doesn’t involve me tracking down and contacting the bloke directly? That figure came from somewhere.
From a presentation sent by D'Aleo via an intermediary, I would imagine by now it's on the internet somewhere but looking for it or contacting D'Aleo is your job if you're interested enough. What I have is what you saw, with D'Aleo on it.For anybody wanting correlation coefficient practice, try a fag packet exercise as here:
Carbon dioxide:

Temperature:
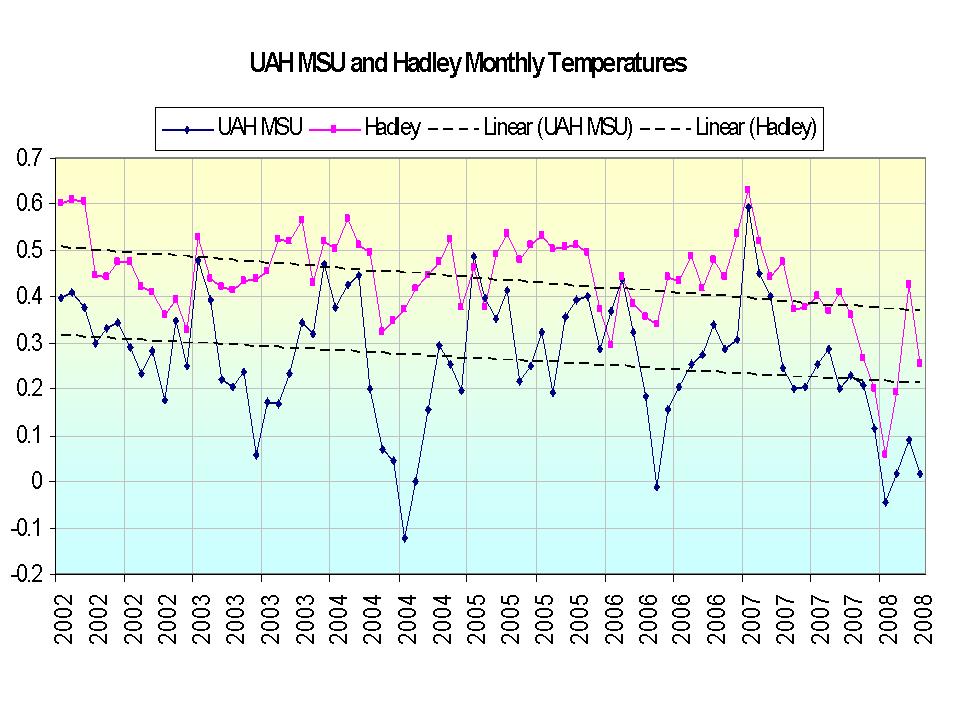
Get the actual numbers (temperature sources given, carbon dioxide as here or Mauna Loa) and apply the requisite formula for the last 10 years.
If your answer doesn't have a negative sign in front, try again.
Just for some basic understanding of correlation coefficients for non stats/maths people,
Correlation coefficients range from 1 to -1.
1 = Perfectly correlated, a rise in 1 leads to a rise in the other.
0 = No correlation, ideally all the variables in your model will be non correlated.
-1 = Inverse correlation, a rise in 1 leads to a fall in the other.
Any values between these end ranges give the strength of the correlation.
Given the graphs above, as CO2 increases the temps decrease, therefore the correlation is negative, pretty much the opposite of what the earth is dieing crowd want you to believe.
I have deliberatley not spent a lot of time looking at the increasing literature on climate change/science as working away from home, studying for my masters and trying to have as much of a normal family life during the short periods when I am home precludes any in-depth reading/research. But I have yet to be convinced by the true believers arguments. My own background is/was Physics but I now work in IT/MI/Data Mining/Warehousing hence the stats masters.
Now there are a lot of variables/interactions in climate science, so concentrating on 1 component part(CO2) seems a bit bizarre to me, never mind others who actually work/study in this area.
Maybe its the only part that has shown any change and is grasped upon by people/organisations/politicians with there own specific agenda to say flog electric cars or bloody great windwills, get people to live in caves and tax you into oblivion as they have blown money on one armed ginger lesbian support groups.
Ohh and I drive a V8 (just to keep it pistonhead centric )
Now I realise those last statements will have me pegged as your usual frothing at the mouth Daily Wail reader, but I can assure you I have never bought or read that rag!
Bill
Correlation coefficients range from 1 to -1.
1 = Perfectly correlated, a rise in 1 leads to a rise in the other.
0 = No correlation, ideally all the variables in your model will be non correlated.
-1 = Inverse correlation, a rise in 1 leads to a fall in the other.
Any values between these end ranges give the strength of the correlation.
Given the graphs above, as CO2 increases the temps decrease, therefore the correlation is negative, pretty much the opposite of what the earth is dieing crowd want you to believe.
I have deliberatley not spent a lot of time looking at the increasing literature on climate change/science as working away from home, studying for my masters and trying to have as much of a normal family life during the short periods when I am home precludes any in-depth reading/research. But I have yet to be convinced by the true believers arguments. My own background is/was Physics but I now work in IT/MI/Data Mining/Warehousing hence the stats masters.
Now there are a lot of variables/interactions in climate science, so concentrating on 1 component part(CO2) seems a bit bizarre to me, never mind others who actually work/study in this area.
Maybe its the only part that has shown any change and is grasped upon by people/organisations/politicians with there own specific agenda to say flog electric cars or bloody great windwills, get people to live in caves and tax you into oblivion as they have blown money on one armed ginger lesbian support groups.
Ohh and I drive a V8
(just to keep it pistonhead centric ) Now I realise those last statements will have me pegged as your usual frothing at the mouth Daily Wail reader, but I can assure you I have never bought or read that rag!
Bill


s2art said:
nigelfr said:
turbobloke said:
The idea of using a log plot is curious, I can't see how it would help make things look any better, in appearance or reality. Ten seconds in Excel shows what the general type of curve that carbon dioxide exhibits over time would look as a log plot (log10 shown here). The curve mimicking the shape of the carbon dioxide trend is in blue, the corresponding log plot is in red. Whatever, it doesn't make things any better.
AGW 101Climate sensitivity is the amount of global warming following a doubling of carbon dioxide concentrations. Estimates indicate that it is likely to be in the range of 2 to 4.5 °C, with a best estimate of about 3 °C. So go from about 280 ppm to 560 ppm for a warming in the range 2 to 4.5 °C. Double it again to 1120 to get the same temp. increase.
Like, er come on guys, you knew that didn't you?
Maths 101
Temp rise compared to concentration CO2 (as I said above) is an exponential function. To plot it fairly on a graph you need to take the log of CO2 concentration to make it "linear".
If you know enough to comment on regression techniques you should know that you have to compare the right variables. Comparing temp against CO2 concentration is not expected to give good correlation, because theory does not predict a linear relationship but an exponential one.
NWTony said:
nigelfr said:
mybrainhurts said:
nigelfr said:
following a doubling of carbon dioxide concentrations.
Given that carbon dioxide is bugger all of total greenhouse gas, it follows that doubling it is still bugger all.Given that most of it occurs naturally, mankind produces bugger all of bugger all.
Please explain how this leads to catastrophic armageddon in simple terms, for a simple lad.....
So a doubling of C02 concentration would go from approx 2.8% bv of greenhouse gases to about 5.6% bv.
A log plot doesn't offer anything worthwhile though, that's the main point. It's not 101 anything. To obtain a significantly better correlation (i.e. not negative, or up from zero and more positive), the shape of the two curves over time - whether a direct or log plot - would have to match, and they do not.
turbobloke said:
hairykrishna said:
Do you not have a source that doesn’t involve me tracking down and contacting the bloke directly? That figure came from somewhere.
From a presentation sent by D'Aleo via an intermediary, I would imagine by now it's on the internet somewhere but looking for it or contacting D'Aleo is your job if you're interested enough. What I have is what you saw, with D'Aleo on it.For anybody wanting correlation coefficient practice, try a fag packet exercise as here:
Carbon dioxide:
Temperature:
Get the actual numbers (temperature sources given, carbon dioxide as here or Mauna Loa) and apply the requisite formula for the last 10 years.
If your answer doesn't have a negative sign in front, try again.
Just some quick objections to your post
1) CO2 graph concentrations starting at 340 ppm
2) different year ranges on CO2 plot and temp plot.
3) Cherry picking start year of temp plot (try 1980 too)
4) Ignoring natural forcings: as I've already showed Tom(Guam) the IPCC is aware that the man made change is superimposed on natural variation, which can be of a similar magnitude.
Now I've got guests waiting so I've had to keep this short. I'll be back.
nigelfr said:
NWTony said:
nigelfr said:
mybrainhurts said:
nigelfr said:
following a doubling of carbon dioxide concentrations.
Given that carbon dioxide is bugger all of total greenhouse gas, it follows that doubling it is still bugger all.Given that most of it occurs naturally, mankind produces bugger all of bugger all.
Please explain how this leads to catastrophic armageddon in simple terms, for a simple lad.....
So a doubling of C02 concentration would go from approx 2.8% bv of greenhouse gases to about 5.6% bv.
???
No idea about what anybody's non-PH activities are, they're the business of individuals alone. They don't affect what goes on in here for the rest of us - but I'm sure we all hope that as a result PHers enjoy good company and good times.
As to accusations of wasting time, in general the whole log plot thing is a diversion. It doesn't make one curve going upwards change direction, or another going downwards change direction. It's not worthwhile to calculate the minor difference it would make to any particular correlation coefficient, not least as it looks to make things slightly worse for the purported role of carbon dioxide.
As to timescale, hairy's enquiry centred on the D'Aleo plot which is recent and decadal. Secondly environmental groups, with a royal supporter, say we must act within 100 months, which is less than 10 years, so there is clearly claimed impact from humans on that timescale or they're talking rubbish and scaremongering in an effort to try to get hasty unthinking compliance.
[quote=nigelfr]Actually the alcohol beer concentration scenario is right on the money when you consider that 990,000 ppm of the atmosphere has no greenhouse effect to speak of.
[/quote
Uh, no. AS per my previous post on this.
One is parts per million, one is parts per hundred. Double each, and one will have a greater effect on the overall value whilst the other will not. I think you can guess which is which, yet you attempt to compare the two as having the same effect. Therefore, your analogy was poor and your claim now that it is valid is baseless and trite, not very worthy even of comment but for the fact I would suggest that when one is in a hole, stop digging.
NWTony said:
nigelfr said:
NWTony said:
nigelfr said:
mybrainhurts said:
nigelfr said:
following a doubling of carbon dioxide concentrations.
Given that carbon dioxide is bugger all of total greenhouse gas, it follows that doubling it is still bugger all.Given that most of it occurs naturally, mankind produces bugger all of bugger all.
Please explain how this leads to catastrophic armageddon in simple terms, for a simple lad.....
So a doubling of C02 concentration would go from approx 2.8% bv of greenhouse gases to about 5.6% bv.
Some people think that because CO2 is only 380 parts per million of the atmosphere it can't have any significant greenhouse effect. However only 10,000 parts per million of the atmosphere are significant greenhouses gases.
Pre-industrial CO2 concentration was about 2.8% of greenhouse gases. Now can you see the analogy with beer?
If you still are having difficulty, please let me know which bit you don't understand and I'll try again.
Jasandjules said:
nigelfr said:
Actually the alcohol beer concentration scenario is right on the money when you consider that 990,000 ppm of the atmosphere has no greenhouse effect to speak of.
Uh, no. AS per my previous post on this.One is parts per million, one is parts per hundred. Double each, and one will have a greater effect on the overall value whilst the other will not. I think you can guess which is which, yet you attempt to compare the two as having the same effect. Therefore, your analogy was poor and your claim now that it is valid is baseless and trite, not very worthy even of comment but for the fact I would suggest that when one is in a hole, stop digging.
"Alle Ding sind Gift, und nichts ohn Gift; allein die Dosis macht, daß ein Ding kein Gift ist."
"All things are poison and nothing is without poison, only the dose permits something not to be poisonous."
25 mg of hydrocyanic acid whether by itself or diluted in a litre of water (25ppm) probably won't kill you. 50 mg even in a litre of water so at 50 ppm probably will.
Edited to sort out formatting of quotes
Edited by nigelfr on Thursday 9th April 16:34
nigelfr said:
Sorry if I'm making it too complicated for you. As I mentioned earlier, climate sensitivity estimates (taking the mid range figure) about 3°C rise in average global temp for a doubling of CO2.
That assumes enhanced effects. IIRC CO2 alone (and assuming no negative feedbacks) would be responsible for an approx 1C rise per doubling.Gassing Station | News, Politics & Economics | Top of Page | What's New | My Stuff