Medieval Warm period due to NAO
Discussion


turbobloke said:
Sure.
The media consensus of global cooling and the scare over a possibly imminent ice age in the 1970s, as discussed in this thread, inspired lyrics by The Clash in a song called London Calling.
Media consensus? Well, that's more accurate than scientific consensus so some progress is being made.The media consensus of global cooling and the scare over a possibly imminent ice age in the 1970s, as discussed in this thread, inspired lyrics by The Clash in a song called London Calling.
Lucky we don't have to rely on lyric writers for Science.
FWIW, London Calling was a great 1970's protest song that managed to cover a lot of the issues that were around then: - racial tension and civil unrest in first verse,
- Line 1 of the chorus refers to both an ice age and global warming,
- line 2 to the Three Mile Island nuclear power station and over population/famine,
- line 3 to oil running out and the Thames barrier
- Second verse is about drug use.
- Third verse is a reference to old radio broadcasts
At least that's how I remember it. Many thanks to TB for the trip down memory lane.
hairykrishna said:
turbobloke said:
I'd like to have a go at explaining where the logarithm issue comes from and in doing so, combine some ideas about carbon dioxide forcing in the discussion up to this point,naturally it'll take a bit of space in terms of forum column-length so if it's of no interest to you, head over to The Lounge or wherever on PH takes your fancy - note, this is a long post advisory.
<some misleading stuff about CO2>
You don't actually believe this do you turbobloke? Don't you have a physics degree? Why are you posting stuff that you know is wrong?<some misleading stuff about CO2>
nigelfr said:
He may not know it's wrong. it depends when he got his degree. Understanding of the CO2 greenhouse effect has progressed a lot in the last decades.
Multiplying a (wrong) value for the percentage of longwave flux absorbed by CO2 by the percentage of energy leaving the Earths atmosphere via radiation by temperature difference between the Earth and an idealised black body to give “maximum total temperature increase due to all carbon dioxide in the atmosphere.” is nonsense no matter when he got his physics degree.Edited by hairykrishna on Friday 10th April 14:43
hairykrishna said:
nigelfr said:
He may not know it's wrong. it depends when he got his degree. Understanding of the CO2 greenhouse effect has progressed a lot in the last decades.
Multiplying a (wrong) value for the percentage of longwave flux absorbed by CO2 by the percentage of energy leaving the Earths atmosphere via radiation by temperature difference between the Earth and an idealised black body to give “maximum total temperature increase due to all carbon dioxide in the atmosphere.” is nonsense no matter when he got his physics degree.Edited by hairykrishna on Friday 10th April 14:43
Edited by bp1 on Friday 10th April 15:17
bp1 said:
Can you show and explain the 'correct' calculation/theory then please?
Not really. A temperature change due to changing the radiation flux (i.e. changing the amount of absorption) has to be estimated empirically. Instead of comparing black body temperature to actual temperature you need to compare two actual temperatures with the corresponding change in the energy flux. Normally, for CO2, this is done with some pre-industrial age temperature vs now. I'm reluctant to work through it here as it will lead to the normal debate about the temperature measure chosen. It's also a 'rule of thumb' estimate rather than a hard calculation.
A calculation such as the one turbobloke presented implies no feedback effects.
Hairy said I posted something I knew to be wrong, namely, the derivation of maximum carbon dioxide solo greenhouse warming of 1.06 deg C
Here is how it is, in fact, correct. Indications of error to be absolutely spelt out as science and NOT opinion. The proof proceeds in three steps corresponding to each stage of my calculation as shown in the earlier post described as something "known to be wrong" by hairykrishna.
1)The greenhouse effect is responsible for about 33 deg C warming overall
Stefan-Bolzmann-Law: R = sT^4
Stefan-Bolzmann-Constant = 5.6710−8W/(m2 · K4)
Solar constant: S = 1367W/m2
average radiation: SM = 342W/m2.
Albedo: = 0.3
Steady state: Incoming = Outgoing
S(1 −a )4 x 3.142 x r^2 = R x 4 x 3.142 r^2
or
SM(1 − a)4 x 3.142 x r^2 = R x 4 x 3.142 x r^2
so
Te,0 = 255K (−18 deg C)
Measured:
Land: 9.84 deg C(1.077 × 10^14 m^2) [Leemans and Cramer(1991)]
Ocean: 18.1 deg C(3.578×10^14m^2) [Levitus and Boyer(1994)]
Global Mean: 16 deg C
Difference of 34 K (= 34 deg C) has to be explained by radiative forcing. This calculation reinforces my acceptance of 33 deg C as a widely quoted figure in literature and on the internet, which was the basis for my calculation.
2)The fraction of incoming radiation leaving the Earth's surface as radiation to (possibly) be re-absorbed by carbon dioxide
The a NASA diagram on the planet's energy budget is still here:
http://eosweb.larc.nasa.gov/EDDOCS/radiation_facts...
As carbon dioxide's four absorption bands in the far infrared are at 1.9 (weak), 2.7, 4.3 and 15 microns, we need to look at radiation leaving the ground as that is our target source - the far infrared radiation emitted back up towards space that is slowed down by greenhouse gases, producing the natural 33 or 34 deg C warming.
The NASA diagram gives 51% of incoming radiation absorbed at the surface. Also 15% is radiated via the atmosphere (i.e. the lower atmosphere itself becomes a source), 6% is radiated straight out into space. Take the 15% and 6% and divide by the 51% which gives a round figure of 40% as the fraction of energy leaving the earth's surface as radiation. This is ALL the energy available to the greenhouse effect via radiative forcing.
Any error here needs to be pointed out to NASA, as their diagram shows what proportion of the greenhouse effect we are working with in temrs of radiative forcing.
3)The proportion of radiation re-emitted from the ground available to carbon dioxide is ~8% of black body radiation emitted by the ground

This shows the three main peaks at which carbon dioxide absorbs, mine showed a weaker 4th absorption that's barely infra-red just to be thorough.
Finally
Of the 33 to 34 deg C total greenhouse effect, 8% of 40% is the maximum radiative forcing available through carbon dioxide, which is over-estimated at
(33 or 34) x 0.08 x 0.40 = 1.06 deg C
No doubt people criticising this know how it is still an over-estimate but, instead of indicating this, they claim spuriously that it's wrong
Here is how it is, in fact, correct. Indications of error to be absolutely spelt out as science and NOT opinion. The proof proceeds in three steps corresponding to each stage of my calculation as shown in the earlier post described as something "known to be wrong" by hairykrishna.
1)The greenhouse effect is responsible for about 33 deg C warming overall
Stefan-Bolzmann-Law: R = sT^4
Stefan-Bolzmann-Constant = 5.6710−8W/(m2 · K4)
Solar constant: S = 1367W/m2
average radiation: SM = 342W/m2.
Albedo: = 0.3
Steady state: Incoming = Outgoing
S(1 −a )4 x 3.142 x r^2 = R x 4 x 3.142 r^2
or
SM(1 − a)4 x 3.142 x r^2 = R x 4 x 3.142 x r^2
so
Te,0 = 255K (−18 deg C)
Measured:
Land: 9.84 deg C(1.077 × 10^14 m^2) [Leemans and Cramer(1991)]
Ocean: 18.1 deg C(3.578×10^14m^2) [Levitus and Boyer(1994)]
Global Mean: 16 deg C
Difference of 34 K (= 34 deg C) has to be explained by radiative forcing. This calculation reinforces my acceptance of 33 deg C as a widely quoted figure in literature and on the internet, which was the basis for my calculation.
2)The fraction of incoming radiation leaving the Earth's surface as radiation to (possibly) be re-absorbed by carbon dioxide
The a NASA diagram on the planet's energy budget is still here:
http://eosweb.larc.nasa.gov/EDDOCS/radiation_facts...
As carbon dioxide's four absorption bands in the far infrared are at 1.9 (weak), 2.7, 4.3 and 15 microns, we need to look at radiation leaving the ground as that is our target source - the far infrared radiation emitted back up towards space that is slowed down by greenhouse gases, producing the natural 33 or 34 deg C warming.
The NASA diagram gives 51% of incoming radiation absorbed at the surface. Also 15% is radiated via the atmosphere (i.e. the lower atmosphere itself becomes a source), 6% is radiated straight out into space. Take the 15% and 6% and divide by the 51% which gives a round figure of 40% as the fraction of energy leaving the earth's surface as radiation. This is ALL the energy available to the greenhouse effect via radiative forcing.
Any error here needs to be pointed out to NASA, as their diagram shows what proportion of the greenhouse effect we are working with in temrs of radiative forcing.
3)The proportion of radiation re-emitted from the ground available to carbon dioxide is ~8% of black body radiation emitted by the ground
This shows the three main peaks at which carbon dioxide absorbs, mine showed a weaker 4th absorption that's barely infra-red just to be thorough.
Finally
Of the 33 to 34 deg C total greenhouse effect, 8% of 40% is the maximum radiative forcing available through carbon dioxide, which is over-estimated at
(33 or 34) x 0.08 x 0.40 = 1.06 deg C
No doubt people criticising this know how it is still an over-estimate but, instead of indicating this, they claim spuriously that it's wrong


More.
The change of temperature caused by the heat transferred from the ground to the total mass of atmospheric CO2 by radiation (radiative forcing) is:
dT = [a] ln [(CO2) t / (CO2) s] / 4 (S) T^3 as applied by the IPCC
Where dT is the temperature shift and a is the (assumed) coefficient of heat transfer of CO2 by radiation (5.35 W/m^2), (CO2) t is the current atmospheric level of carbon dioxide in ppmv, (CO2) s is a reference atmospheric level of carbon dioxide also expressed in ppmv, S is the Stephan-Boltzmann constant (5.6697 x 10^-8 W/m^2*K^4)
If we take the current level of carbon dixide to be 380 ppmv and pre-industrial levels to be 280 ppmv, and an ocean-determined radiative equilibrium temperature of ~ 300K then:
dT = 5.29 W/m^2 [ln (380 ppmv /280 ppmv)] /4 (5.6697 x 10^-8 W/m^2*K^4) (300 K) ^3
dT = 5.29 W/m^2 (0.308) / (4 [5.6697 x 10^-8 W/m^2*K^4] (300 K) ^3
= 1.63/ 6.13 K
= 0.27 deg C (temperatures in K for the formulae but intervals in K are the same in deg C).
Carbon dioxide is, as seen, unable to cause the recent modest temperature change.
From recent observations of the tropospheric temperature trend and the relationship with carbon dioxide, it's likely that the “radiative forcing coefficient” of carbon dioxide is not an IPCC sourced 5.35 W/m^2 but an amount between 1.78 W/m^2 and 2.68 W/m^2. This would be in keeping with the observations and data available.
In the first scenario the ÄT caused by 380 ppmv of carbon dioxide is now 0.1 deg C.
dT = (1.78 W/m^2) ln ([380 ppmv] /[280 ppmv]) /4 (5.6697 x 10^-8 W/m^2*K^4) (300 K) ^3
dT = (1.78 W/m^2) 0.308 / 6.13
= 0.55 /6.13
= 0.089 K
or 0.1 deg C, rounded
In the second scenario for a = 2.68 W/m^2, the change of temperature caused by 381 ppmv of CO2 is 0.1 K:
dT = (2.68 W/m^2) ln (380 ppmv /280 ppmv) /4 (5.6697 x 10^-8 W/m^2*K^4) (300 K) ^3
dT = 2.68 W/m^2 (0.308) / 6.13 W/m^2*K = 0.83 (W/m^2)/ 6.13 W/m^2*K
= 0.13 deg C
This is also in keeping with observations.
One for hairy and others to discuss in terms of the theory, formulae, approach, and numbers obtained as either values or trends. After all there might be a deliberate mistake here to catch out the uninformed naysayer, or there might not be.
Reply with science, not opinion.
Edited by turbobloke on Friday 10th April 16:09
So you post basically the same thing again with added bluster?
Each of your points in turn.
Actual calculations of IR transport through the air are even more complicated. They require the separation of the atmosphere into absorbing/remitting layers and many successive radiation transport calculations.
Here’s a figure showing the emission spectra at the top of the atmosphere compared to the ground.
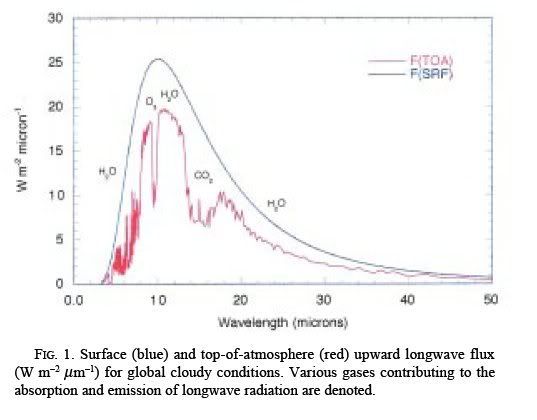
This was taken from: Earth’s Annual Global Mean Energy Budget, J. T. Kiehl and Kevin E. Trenberth, Bulletin of the American Meteorological Society. You can generate your own using an online version of MORTRAN here; http://geodoc.uchicago.edu/Projects/modtran.orig.h...
Play around with concentrations, gas mix whatever. This code is extremely well verified against experimental measurements.
In reality the proportion of ‘radiation available for CO2’ is >8%. Probably ~25%. This doesn't actually really matter for the next point though.
Each of your points in turn.
turbobloke said:
1)The greenhouse effect is responsible for about 33 deg C warming overall
Entirely correct.turbobloke said:
2)The fraction of incoming radiation leaving the Earth's surface as radiation to (possibly) be re-absorbed by carbon dioxide
NASA diagram is close enough so correct.turbobloke said:
3)The proportion of radiation re-emitted from the ground available to carbon dioxide is ~8% of black body radiation emitted by the ground
This shows the three main peaks at which carbon dioxide absorbs, mine showed a weaker 4th absorption that's barely infra-red just to be thorough.
Gross over simplification. The actual atmospheric absorption spectrum differs at different heights in the atmosphere (i.e with temperature and pressure) and with different gas proportions which affect collisions. Anyone who wants to can play with the spectral calculator here; http://www.spectralcalc.com/calc/spectralcalc.phpThis shows the three main peaks at which carbon dioxide absorbs, mine showed a weaker 4th absorption that's barely infra-red just to be thorough.
Actual calculations of IR transport through the air are even more complicated. They require the separation of the atmosphere into absorbing/remitting layers and many successive radiation transport calculations.
Here’s a figure showing the emission spectra at the top of the atmosphere compared to the ground.
This was taken from: Earth’s Annual Global Mean Energy Budget, J. T. Kiehl and Kevin E. Trenberth, Bulletin of the American Meteorological Society. You can generate your own using an online version of MORTRAN here; http://geodoc.uchicago.edu/Projects/modtran.orig.h...
Play around with concentrations, gas mix whatever. This code is extremely well verified against experimental measurements.
In reality the proportion of ‘radiation available for CO2’ is >8%. Probably ~25%. This doesn't actually really matter for the next point though.
turbobloke said:
Finally
Of the 33 to 34 deg C total greenhouse effect, 8% of 40% is the maximum radiative forcing available through carbon dioxide, which is over-estimated at
(33 or 34) x 0.08 x 0.40 = 1.06 deg C
No doubt people criticising this know how it is still an over-estimate but, instead of indicating this, they claim spuriously that it's wrong
Rubbish. This calculation assumes no feedback effects i.e. no climate sensitivity factor. It is the exact opposite of an “over-estimate”. In other words it tells us nothing about what affect adding CO2 to the atmosphere will have.Of the 33 to 34 deg C total greenhouse effect, 8% of 40% is the maximum radiative forcing available through carbon dioxide, which is over-estimated at
(33 or 34) x 0.08 x 0.40 = 1.06 deg C
No doubt people criticising this know how it is still an over-estimate but, instead of indicating this, they claim spuriously that it's wrong
Edited by hairykrishna on Friday 10th April 16:30
hairykrishna said:
So you post basically the same thing again with added bluster?
No, with added science, as you know but attempt to evade using bluster of your own.hairykrishna said:
Each of your points in turn.
I already went through this - TWICE - in this thread. Here you go for number three.turbobloke said:
1)The greenhouse effect is responsible for about 33 deg C warming overall
Entirely correct.turbobloke said:
2)The fraction of incoming radiation leaving the Earth's surface as radiation to (possibly) be re-absorbed by carbon dioxide
NASA diagram is close enough so correct.turbobloke said:
3)The proportion of radiation re-emitted from the ground available to carbon dioxide is ~8% of black body radiation emitted by the ground
This shows the three main peaks at which carbon dioxide absorbs, mine showed a weaker 4th absorption that's barely infra-red just to be thorough.
Gross over simplification. The actual atmospheric absorption spectrum differs at different heights in the atmosphere (i.e with temperature and pressure) and with different gas proportions which effect collisions. This shows the three main peaks at which carbon dioxide absorbs, mine showed a weaker 4th absorption that's barely infra-red just to be thorough.
The process responsible, desaturation, is said to occur at higher altitudes the atmosphere. At the higher temperatures and pressures of near ground-level these broadened peaks overlap with absorptions from water vapour.
AGW supporters' argument goes that in the thinner environs of the upper troposphere and lower stratosphere, where the pressure is about one-tenth that at ground level and the temperature is about -40 deg C, the shoulders on the broadened peaks (origin not critical, and as the original post was generalist and this is atomic spectroscopy we'll carry on) sharpen up and no longer overlap with the peaks for water vapour, so (it's claimed) more radiation can be absorbed from more carbon dioxide added to the atmosphere.
However the shoulders on the peaks are a very small element of the absorptions, representing about 5% of the absorptions, though this is often exaggerated to 10%. At about 16 kilometers up the atmosphere's density is roughly one tenth compared to ground (sea) level and the temperature is about -40 feg C, indeed good conditions for narrow absorptions that will be 'de-overlapped'.
Each infra-red peak of carbon dioxide will absorb completely at ground level in 10 meters, so up there the radiation will absorb completetly in about 100 meters (one-tenth pressure, ten times more distance needed). A difference in path length isn't a bigger rise in temperature. 'Shoulders' at 5% would absorb completely in 20 times the distance which is 2 kilometers. Doubling the amount of carbon dioxide in the atmosphere means they would do the same in 1 kilometer. The shorter distance is not a bigger increase in temperature since there is no delay in heat loss when the jet stream is mixing things up, up there.
At 17km, in the lower stratosphere, there's no efficient exchange with the lower troposphere across the tropopause so the extra 'heat' (not) generated won't get back down near the surface anyway.
As you keep raising the same unjustified objection the only possible reasons are that you don't understand that the desaturation myth has already been refuted (twice) as your science is inadequate - so you keep re-posting the same old desaturation stuff over and over, along with ludo doing likewise - or you do realise what's going on and simply keep re-posting the same old desaturation myth as a means of obfuscation.
Since the final claim to error is now dead and buried the calculation remains correct BUT an over-estimate as later posts reveal.

turbobloke said:
Each infra-red peak of carbon dioxide will absorb completely at ground level in 10 meters, so up there the radiation will absorb completetly in about 100 meters (one-tenth pressure, ten times more distance needed). A difference in path length isn't a bigger rise in temperature. 'Shoulders' at 5% would absorb completely in 20 times the distance which is 2 kilometers. Doubling the amount of carbon dioxide in the atmosphere means they would do the same in 1 kilometer. The shorter distance is not a bigger increase in temperature since there is no delay in heat loss when the jet stream is mixing things up, up there.
I'm off to get drunk. I invite everyone to play with the spectral calculator I posted earlier. Maybe TB will have said something about feedback effects when I get back, maybe not.
hairykrishna said:
turbobloke said:
Each infra-red peak of carbon dioxide will absorb completely at ground level in 10 meters, so up there the radiation will absorb completetly in about 100 meters (one-tenth pressure, ten times more distance needed). A difference in path length isn't a bigger rise in temperature. 'Shoulders' at 5% would absorb completely in 20 times the distance which is 2 kilometers. Doubling the amount of carbon dioxide in the atmosphere means they would do the same in 1 kilometer. The shorter distance is not a bigger increase in temperature since there is no delay in heat loss when the jet stream is mixing things up, up there.
I'm off to get drunk. I invite everyone to play with the spectral calculator I posted earlier. Maybe TB will have said something about feedback effects when I get back, maybe not.
s2art said:
Could we have a bit more on these 'feedback effects' please.
I'm afraid not, there are cocktails to be drunk. I suggest reading http://www.pik-potsdam.de/~stefan/Publications/Boo... for a good CO2 concentrations -> temperature change calculation discussion.While we wait, here is some more DATA showing that there is no warming mechanism operating up in the lopwer stratosphere under conditions where carbon dioxide absorption peak narrowing and de-overlapping (due to lower T and lower P) are claimed to absorb more heat through 'desaturation'.
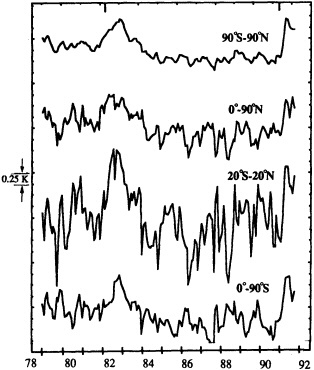
The peaks are due to volcanic eruptions, El Chichon in 1982 and Pinatubo in 1991, such features are present in this type of data and are clearly natural, they're marked by the two vertical down-tags on the top scale of the chart. The overall cooling trend can be seen clearly. This plot montage shows the average over the entire planet, the average over the Northern Hemisphere (0° to 90°N), the average over the tropics (20°N to 20°S), and the average over the Southern Hemisphere (0° to 90°S). The smallest interval marked on the temperature scale is equivalent to 0.25 deg C. Data originally via Dr Roy Spencer (MSU4).
Where's the warming from desaturation?
How will ANY warming up there get back to ground level past the tropopause?
Answers needed - but won't be forthcoming as they are the 'wrong' answers for manmade warming junkscience.
hairykrishna said:
s2art said:
Could we have a bit more on these 'feedback effects' please.
I'm afraid not, there are cocktails to be drunk. I suggest reading http://www.pik-potsdam.de/~stefan/Publications/Boo... for a good CO2 concentrations -> temperature change calculation discussion.hairykrishna said:
So you (TB) post basically the same thing again with added bluster?
nigelfr said:
play the ball not the man
hairykrishna said:
bp1 said:
Can you show and explain the 'correct' calculation/theory then please?
Not really. hairykrishna said:
s2art said:
Could we have a bit more on these 'feedback effects' please.
I'm afraid not
Fortunately it's not needed.
Desaturation - check:
Feedback effects - OK we can take that myth next.
When manmade warmers realise the carbon dioxide game is up, with a calculable but immeasurably small temperature change that is between 0.05 deg C and 0.0002 deg C depending on what values you take for the relevant parameters, the final appeal is to positive feedback
Unfortunately for manmade warming supporters there is no positive feedback seen in the atmosphere response to climate forcings. The chart we see a lot of in these threads showing carbon dioxide and temperature uncorrelated for millions of years shows that when the mean global temperature gets high (naturally, to about 22 deg C ish) it stops and levels out, no thermal runaway. This is negative feedback, not positive feedback.
When there is an ice age the planet does not stay frozen for ever, it warms again (naturally) this is negative feedback.
Think of the planet as a beachball.
In the positive feedback analogy it sits on a climate plateau, where, if it rolls down a slope on any one side i.e. hot one side or cold the other side, it would keep on rolling. This would correspond to the thermal runaway (that doesn't happen).
In the negative feedback analogy it would sit at the bottom of a valley type depression surrounded bu hills that rise up. If it rolls to any one side (hot one side, cold another) it gets so far then rolls back down again. This corresponds to the behaviour our planet displays in the data.
One reason why the modellers get it wrong is by failing to acknowledge the data and its implications. Even then another reason is that the modelled feedback is wrong-minded:
One of several articles including news items on the UAH website said:
Warming can Thin Heat-trapping Clouds
The widely accepted (albeit unproven) theory that man-made global warming will accelerate itself by creating more heat-trapping clouds is challenged this month in new research from The University of Alabama in Huntsville involving IPCC Lead Author Prof John Christy and Dr Roy Spencer.
Instead of creating more clouds as climate models currently envisage, individual tropical warming cycles...saw a decrease in the coverage of heat-trapping cirrus clouds...This was not what he expected to find.
"To give an idea of how strong this enhanced cooling mechanism is, if it was operating on global warming, it would reduce estimates of future warming by over 75 percent," Spencer said.
Spencer and his colleagues anticipate these new findings will be controversial but they are consistent with observations that show a troposphere failing to heat up according to predictions for an enhanced greenhouse effect with water vapour feedback.
Instead it supports the view that an already warm atmosphere has more degrees of freedom than represented in climate models, allowing the transfer of energy and preventing further warming.
Spencer, Roy W.; Braswell, William D.; Christy, John R.; Hnilo, Justin:
'Cloud and radiation budget changes associated with tropical intraseasonal oscillations' Geophys. Res. Lett. 34, 15 (2007)
I've been talking for several years about climate models failing to reflect the fact that data shows an already warm atmosphere has more degrees of freedom than tightly paramaterised climate models allow, this will permit heat to escape to space more quickly than modelled. There it is in a research paper, and it completes the refutation of the positive feedback myth which gets a double whammy from both data and theory.The widely accepted (albeit unproven) theory that man-made global warming will accelerate itself by creating more heat-trapping clouds is challenged this month in new research from The University of Alabama in Huntsville involving IPCC Lead Author Prof John Christy and Dr Roy Spencer.
Instead of creating more clouds as climate models currently envisage, individual tropical warming cycles...saw a decrease in the coverage of heat-trapping cirrus clouds...This was not what he expected to find.
"To give an idea of how strong this enhanced cooling mechanism is, if it was operating on global warming, it would reduce estimates of future warming by over 75 percent," Spencer said.
Spencer and his colleagues anticipate these new findings will be controversial but they are consistent with observations that show a troposphere failing to heat up according to predictions for an enhanced greenhouse effect with water vapour feedback.
Instead it supports the view that an already warm atmosphere has more degrees of freedom than represented in climate models, allowing the transfer of energy and preventing further warming.
Spencer, Roy W.; Braswell, William D.; Christy, John R.; Hnilo, Justin:
'Cloud and radiation budget changes associated with tropical intraseasonal oscillations' Geophys. Res. Lett. 34, 15 (2007)
See the cloud-thinning and other negative feedbacks keep global temperatures from going above about 22 deg C or below about 12 deg C (over a timescale of more than half a billion years of natural experimentation) and note the non-correlation between temperature and carbon dioxide clearly visible.

In the pictorial representation of mythical climate change from the IPCC note the increasing reliance over time on positive feedback - even though it doesn't exist. Note the gradual retreat over the still-mythical carbon dioxide forcing.

In the above chart on IPCC non-existent positive feedback inflation, time runs vertically downwards, i.e. the latest myths are the lowest band.
turbobloke said:
3)The proportion of radiation re-emitted from the ground available to carbon dioxide is ~8% of black body radiation emitted by the ground
This shows the three main peaks at which carbon dioxide absorbs, mine showed a weaker 4th absorption that's barely infra-red just to be thorough.
Still only dealing with surface re-emission.This shows the three main peaks at which carbon dioxide absorbs, mine showed a weaker 4th absorption that's barely infra-red just to be thorough.
Absorption spectra change with temperature, pressure and composition:
You can't take the details at ground level and apply them to the whole atmosphere.
Here's a pic:

In the top bit you can see how the black body radiation changes depending on the temperature you're dealing with. Between the two shown there, there is a different one for each temperature.
The bottom shows the different absorption spectra at 11Km and ground level. Notice that they're different so that what is not absorbed at sea level may be absorbed at 11km.
I haven't managed to find a pic that shows how the concentrations of the Greenhouse gases varies with altitude. But water vapour doesn't make it to the top of the atmosphere, so CO2 has a greater effect there.
Now think of all the different levels that the radiation has to go through before it escapes to space and you will see why TB's explanation is hopelessly out-dated and way too simple.
nigelfr said:
turbobloke said:
3)The proportion of radiation re-emitted from the ground available to carbon dioxide is ~8% of black body radiation emitted by the ground
This shows the three main peaks at which carbon dioxide absorbs, mine showed a weaker 4th absorption that's barely infra-red just to be thorough.
Still only dealing with surface re-emission.This shows the three main peaks at which carbon dioxide absorbs, mine showed a weaker 4th absorption that's barely infra-red just to be thorough.
Absorption spectra change with temperature, pressure and composition:
You can't take the details at ground level and apply them to the whole atmosphere.
It's why I explained the desaturation science, FOUR times now in the recent past.
The latest was at 16:37, about an hour and a half ago.
Gassing Station | News, Politics & Economics | Top of Page | What's New | My Stuff