Climate change - the POLITICAL debate. Vol 4
Discussion


LongQ said:
dickymint said:
LongQ said:
It would be nice to see the adjusted numbers presented with error bars.
That said when there are several adjustment values (and presumably some of the individual adjustments might be dependent upon or otherwise influence one or more of the other values) is there a formal standard for presenting the range of possible results in a graphic? Especially a monochrome graphic for printing?
This is a serious question btw.
If using a graph such as this for illustration as part of a presentation by some means to a politician - especially a busy politician in a position of authority - the image presented needs to be readily understood. More likely the message to be pushed is clearly presented and the variability dismissed as "too complicated" .
Are you talking about 'measurement of uncertainty' as used in calibration? as in combining errors in each stage of a measurement?That said when there are several adjustment values (and presumably some of the individual adjustments might be dependent upon or otherwise influence one or more of the other values) is there a formal standard for presenting the range of possible results in a graphic? Especially a monochrome graphic for printing?
This is a serious question btw.
If using a graph such as this for illustration as part of a presentation by some means to a politician - especially a busy politician in a position of authority - the image presented needs to be readily understood. More likely the message to be pushed is clearly presented and the variability dismissed as "too complicated" .
for example if you use a voltmeter and a signal generator (standards) to calibrate an oscilloscope measurement then you have to combine the measurement of uncertainty of both standards to ascertain the total uncertainty.
This may help (page 4).............
http://nfogm.no/wp-content/uploads/2016/03/Calibra...
I may be teaching you egg sucking and/or way off track

I'll dig up the link once again and find the table used. Seemed to have lost it when the browser froze a while back.
http://etienne.berthier.free.fr/download/Cazenave_...
Top right.
I have read the explanatory text a few times but it's one of those where I think you have to be deeply involved to be able to understand it with any degree of ease. Unless I am over complicating what it seems to be saying.
Now I appreciate that this looks like a science paper but I'm mostly interested in the method and the approach to sharing the results (the graph that might be pretty much all that politicians and the public would see) and therefore how one might attempt to present a possible range of results for general consumption.
Lacking any new data or evidence of any kind, Al Gore has resorted to emotive conparisons in his latest self-interested propaganda outburst, describing climate issues as a battle and likening it to tackling slavery and apartheid.
http://www.foxnews.com/politics/2017/07/13/gore-cl...
Fortunately he steered clear of the temperature at the planet's core.
Last month Our Albert described the 'climate movement' as one of the great moral causes. This is eerily reminiscent of a religious type of chap who held high office in the IPCC.
At least by descrinbing the 'climate movement' in moral terms Gore was implicitly correct in not describing it as an essentially 'scientific movement' (unless we're talking biology and bowel movements).
Gore has a sequel to his first quackumentary on the way complete with jetting about on his publicity tour so it was inevitable that he'd turn up the baseless rhetoric factor to the toppest 'hot air' setting.
There's been more jet noise (not a reference to our esteemed fellow PHer) around today than of late. It's related to Fairford RIAT arrivals. Given the nature of the beast it's surprising that environ mentalists aren't popping a vessel outside the base. After all, with all those unnecessary international flights, who do the world's military aviators think they are? Al Gore? Leo Di Caprio?!
http://www.foxnews.com/politics/2017/07/13/gore-cl...
Fortunately he steered clear of the temperature at the planet's core.
Last month Our Albert described the 'climate movement' as one of the great moral causes. This is eerily reminiscent of a religious type of chap who held high office in the IPCC.
At least by descrinbing the 'climate movement' in moral terms Gore was implicitly correct in not describing it as an essentially 'scientific movement' (unless we're talking biology and bowel movements).
Former IPCC chief scientist Sir John Houghton said:
A reduction of greenhouse gas emissions will contribute powerfully to the material salvation of the planet from mankind's greed and indifference.
Jeez. No, make that Gaia.Gore has a sequel to his first quackumentary on the way complete with jetting about on his publicity tour so it was inevitable that he'd turn up the baseless rhetoric factor to the toppest 'hot air' setting.
There's been more jet noise (not a reference to our esteemed fellow PHer) around today than of late. It's related to Fairford RIAT arrivals. Given the nature of the beast it's surprising that environ mentalists aren't popping a vessel outside the base. After all, with all those unnecessary international flights, who do the world's military aviators think they are? Al Gore? Leo Di Caprio?!
Great climate politics pic here, including lady with shocked expression.
http://www.climatedepot.com/2017/07/13/face-to-fac...
http://www.climatedepot.com/2017/07/13/face-to-fac...
durbster said:
Yes, if you ignore the enormous amount of evidence I have continuously provided to explain why I think what I think. 
Tell me, what evidence have you provided to explain why you think what you think?
I think the world's climate scientists are the people with the best understanding of the climate.
On what grounds do you doubt them?
Where do you get your information from that's better than theirs?
How can you claim your position not based on belief?
Because to me it just looks like you've seen turbobloke use the term "believers" for some unknown reason, and now you're just repeating it like a parrot because you don't know how to think independently. At least, that's what the evidence suggests.
what did you make of the link i posted recently where one of the main scientists responsible for the best ( berkeley earth surface temperature ) data admitted there were issues with the data processing they hadn't considered ?Tell me, what evidence have you provided to explain why you think what you think?
I think the world's climate scientists are the people with the best understanding of the climate.
On what grounds do you doubt them?
Where do you get your information from that's better than theirs?
How can you claim your position not based on belief?
Because to me it just looks like you've seen turbobloke use the term "believers" for some unknown reason, and now you're just repeating it like a parrot because you don't know how to think independently. At least, that's what the evidence suggests.
the surface temperature data sets are the main metric that the hypothesis can be checked against . if they have issues ,how can claims of temp increases or records relying on tenths of degrees c be given any confidence ?
Paddy_N_Murphy said:
Trumps U-Turn seems to be quiet on this thread.
No comments?
He hasn't made a u-turn.No comments?
Trump said that a change in his position on Paris was possible.
Folks are getting hot and bithered about his comment "something could happen with respect to the Paris accords."
Do you have insider info on when he'll do a u-ey?
durbster said:
robinessex said:
That's all you do Durbster. Belief.
Yes, if you ignore the enormous amount of evidence I have continuously provided to explain why I think what I think. Tell me, what evidence have you provided to explain why you think what you think?
I think the world's climate scientists are the people with the best understanding of the climate.
On what grounds do you doubt them?
Where do you get your information from that's better than theirs?
How can you claim your position not based on belief?
Because to me it just looks like you've seen turbobloke use the term "believers" for some unknown reason, and now you're just repeating it like a parrot because you don't know how to think independently. At least, that's what the evidence suggests.
Engineers rule number one. Define the problem. Find a solution.
I was about to post this latest morsel of climate politics before the Trump episode so having started I may as well finish.
More data diddling from NOAA in US temps (Maine).
2012
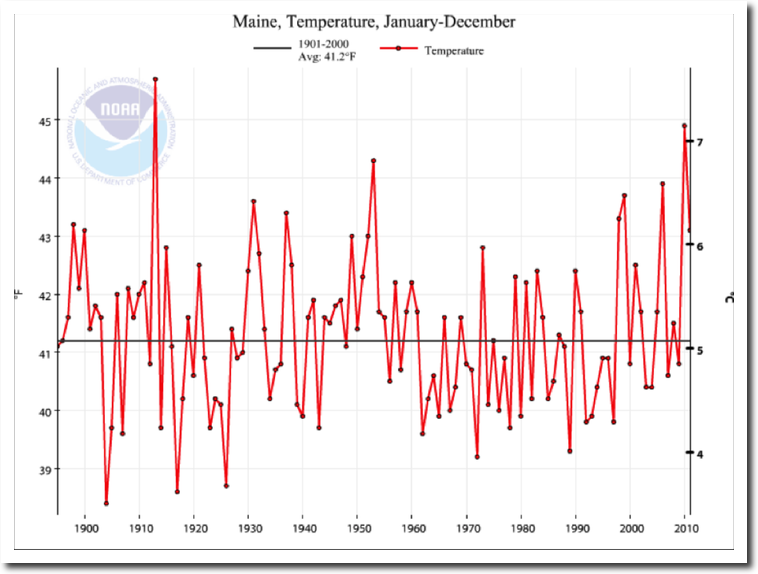
2017
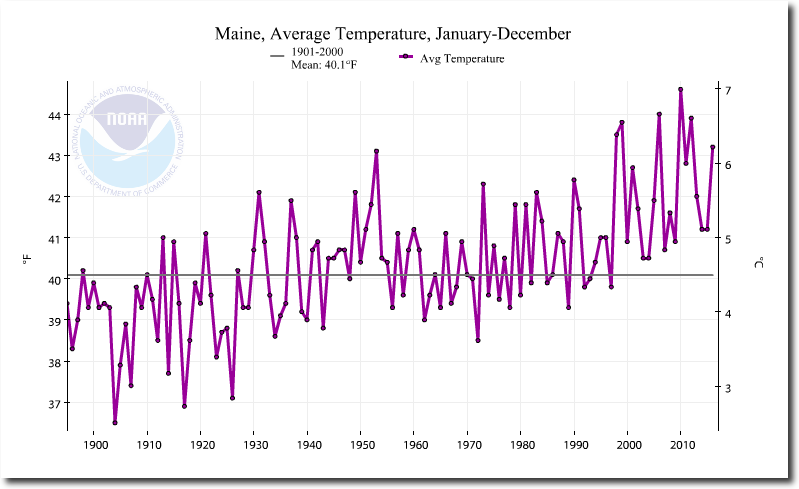
The hottest year (1913) which was also when California set a (world?) record of 134 deg F has been completely erased. The past is cooled, the present is warmed. Climate politics at its best. Diddly dumb.
More data diddling from NOAA in US temps (Maine).
2012
2017
The hottest year (1913) which was also when California set a (world?) record of 134 deg F has been completely erased. The past is cooled, the present is warmed. Climate politics at its best. Diddly dumb.
Paddy_N_Murphy said:
turbobloke said:
It illustrates the validity of this politics thread.
The data hasn't done a u-turn.
Perhaps since he has been put in the position he holds, Voltaire's words are sinking in.The data hasn't done a u-turn.
If the data hasn't changed and he has - it would suggest he has now an understanding of the data.
Why not sort your own words out before misapplying those of others...
If you think Gore, or Trump or Macron understand anywhere near enough to know how many beans make warm, think again.
The data hasn't done a u-turn, There's still no visible causal human signal in any global climate data and the agw hypothesis remains falsified.
turbobloke said:
LongQ said:
It would be nice to see the adjusted numbers presented with error bars.
That said when there are several adjustment values (and presumably some of the individual adjustments might be dependent upon or otherwise influence one or more of the other values) is there a formal standard for presenting the range of possible results in a graphic? Especially a monochrome graphic for printing?
This is a serious question btw.
If using a graph such as this for illustration as part of a presentation by some means to a politician - especially a busy politician in a position of authority - the image presented needs to be readily understood. More likely the message to be pushed is clearly presented and the variability dismissed as "too complicated" .
Data is rarely used in isolation and further to dickymint's reply, there's info on errors and how they combine at the following links, each presentation has a slightly different flavour. These links go to pdf files.That said when there are several adjustment values (and presumably some of the individual adjustments might be dependent upon or otherwise influence one or more of the other values) is there a formal standard for presenting the range of possible results in a graphic? Especially a monochrome graphic for printing?
This is a serious question btw.
If using a graph such as this for illustration as part of a presentation by some means to a politician - especially a busy politician in a position of authority - the image presented needs to be readily understood. More likely the message to be pushed is clearly presented and the variability dismissed as "too complicated" .
www.met.rdg.ac.uk/~swrhgnrj/combining_errors.pdf
www.webpages.uidaho.edu/for274new/Handouts/Combini...
www.phys.columbia.edu/~w3081/exp_files/ESDandCombi...
PS. Durbster when I say "God" I'm not referring to TB

robinessex said:
durbster said:
robinessex said:
That's all you do Durbster. Belief.
Yes, if you ignore the enormous amount of evidence I have continuously provided to explain why I think what I think. Tell me, what evidence have you provided to explain why you think what you think?
I think the world's climate scientists are the people with the best understanding of the climate.
On what grounds do you doubt them?
Where do you get your information from that's better than theirs?
How can you claim your position not based on belief?
Because to me it just looks like you've seen turbobloke use the term "believers" for some unknown reason, and now you're just repeating it like a parrot because you don't know how to think independently. At least, that's what the evidence suggests.
Engineers rule number one. Define the problem. Find a solution.
I've posted this for you at least three times before, but here it is for you to ignore again:
https://climate.nasa.gov/effects/
Now that's sorted, do you have answers to any of my questions?
A good quote from Monckton on the politics of climate junkscience.
Monckton said:
On most of the global-temperature datasets, much of the warming of recent decades was not evident in the raw data and has been created by ex-post-facto manipulation of the data – whether for good reasons or bad.
No Inconvenient Pause will ever again be allowed to show in most datasets, even if there is one. Some parameter or another will be Karlmelized after the event, and numbly acquiescent pal-reviewers will check it not for scientific merit but simply for conformity to the Party Line, whereupon they will wave the paper through.
No Inconvenient Pause will ever again be allowed to show in most datasets, even if there is one. Some parameter or another will be Karlmelized after the event, and numbly acquiescent pal-reviewers will check it not for scientific merit but simply for conformity to the Party Line, whereupon they will wave the paper through.
durbster said:
robinessex said:
durbster said:
robinessex said:
That's all you do Durbster. Belief.
Yes, if you ignore the enormous amount of evidence I have continuously provided to explain why I think what I think. Tell me, what evidence have you provided to explain why you think what you think?
I think the world's climate scientists are the people with the best understanding of the climate.
On what grounds do you doubt them?
Where do you get your information from that's better than theirs?
How can you claim your position not based on belief?
Because to me it just looks like you've seen turbobloke use the term "believers" for some unknown reason, and now you're just repeating it like a parrot because you don't know how to think independently. At least, that's what the evidence suggests.
Engineers rule number one. Define the problem. Find a solution.
I've posted this for you at least three times before, but here it is for you to ignore again:
https://climate.nasa.gov/effects/
Now that's sorted, do you have answers to any of my questions?
Effects that scientists had predicted (HAVE TURNED OUT TO BE COMPLETE b
 kS) in the past would result from global climate change are now occurring: loss of sea ice, accelerated sea level rise and longer, more intense heat waves. (PURE SPECULATION).
Taken as a whole, the range of published evidence INDICATES that the net damage costs of climate change are LIKELY to be significant and to increase over time.
- Intergovernmental Panel on Climate Change
Scientists have high CONFIDENCE that global temperatures will continue to rise for decades to come, largely due to greenhouse gases produced by human activities (WHERE’S THE PROOF) The Intergovernmental Panel on Climate Change (IPCC), which includes more than 1,300 scientists from the United States and other countries, forecasts a temperature rise of 2.5 to 10 degrees Fahrenheit over the next century. (ACCORDING TO THE IPCC'S OWN FAITH AND METHODS, THE PARIS DEAL IF IMPLEMENTED FULLY WOULD LOWER TEMPERATURES BY 0.05 DEG C BY 2100. NEAR-SURFACE TEMPERATURES ARE GOOD FOR +/- 0.07 DEG C SO PARIS WILL BE UNDETECTABLE IN THE SURFACE DATASETS AT THE TURN OF THE CENTURY. THE UAH LTT SATELLITE TREND IS GOOD FOR +/-0.04 DEG C PER DECADE BUT THAT'S NO USE EITHER AS TRENDING DUE TO NATURAL VARIATION IS GREATER, INCLUDING OVER SHORTER AND LONGER TIMESCALES)
According to the IPCC, the extent of climate change effects on individual regions will vary over time and with the ability of different societal and environmental systems to mitigate or adapt to change.
The IPCC PREDICTS that increases in global mean temperature of less than 1.8 to 5.4 degrees Fahrenheit (1 to 3 degrees Celsius) above 1990 levels will produce beneficial impacts in some regions and harmful ones in others. Net annual costs will increase over time as global temperatures increase.
"Taken as a whole," the IPCC states, "the range of published evidence INDICATES that the net damage costs of climate change are likely to be significant and to increase over time." 1
I STOPPED READING THIS FAIRY TAIL HERE
Waste products, not crops, key to boosting UK biofuels
http://www.bbc.co.uk/news/science-environment-4059...
An extract from that article:-
...........When the authors of this study reviewed the global scientific literature, they found that if all the extra emissions involved in changing land use to grow wheat were added in, fuel based on this grain was WORSE FOR THE ENVIRONMENT THAN REGULAR PETROL OR DIESEL. "Generally, we know if land use change is involved, do not use wheat to make biofuels, it is higher than petrol in terms of carbon footprint," said Prof Adisa Azapagic from the University of Manchester who chaired the panel that produced the report...................
Opps !!!!
Cutting flatulence to save the planet
http://www.bbc.co.uk/news/av/magazine-40586209/cut...
CC finally getting truly bonkers !! What about the millions of other animals yes, that includes us, merrily farting away.
http://www.bbc.co.uk/news/av/magazine-40586209/cut...
CC finally getting truly bonkers !! What about the millions of other animals yes, that includes us, merrily farting away.
robinessex said:
Cutting flatulence to save the planet
http://www.bbc.co.uk/news/av/magazine-40586209/cut...
CC finally getting truly bonkers !! What about the millions of other animals yes, that includes us, merrily farting away.
That opening statement from the biased bumbling beeb is priceless.http://www.bbc.co.uk/news/av/magazine-40586209/cut...
CC finally getting truly bonkers !! What about the millions of other animals yes, that includes us, merrily farting away.
BBC muppetry said:
Emissions - belches and farts - from cows' digestive systems have a big impact on global warming.

The age of stupid provides a perfect backdrop for agw, believers and of course the BBC.
robinessex said:
Cutting flatulence to save the planet
http://www.bbc.co.uk/news/av/magazine-40586209/cut...
CC finally getting truly bonkers !! What about the millions of other animals yes, that includes us, merrily farting away.
Slow news day and another example of repetition. Frequent repetition.http://www.bbc.co.uk/news/av/magazine-40586209/cut...
CC finally getting truly bonkers !! What about the millions of other animals yes, that includes us, merrily farting away.
Still, a good story to promote if you have vegan leanings or if you are fixated about obesity perhaps.
Why do people suffer from so much plant hatred that they would have us kill more and more of them for both food and fuel use?
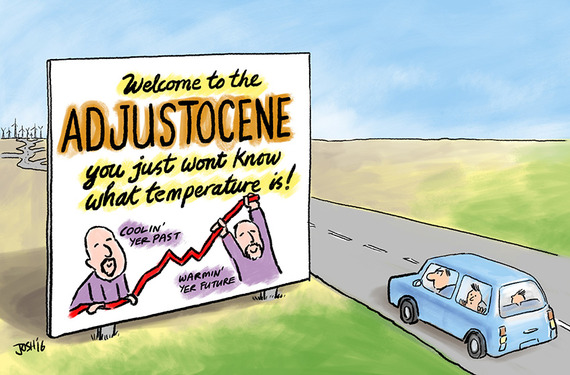
Time for another picture or two of politicised junkscience in action.
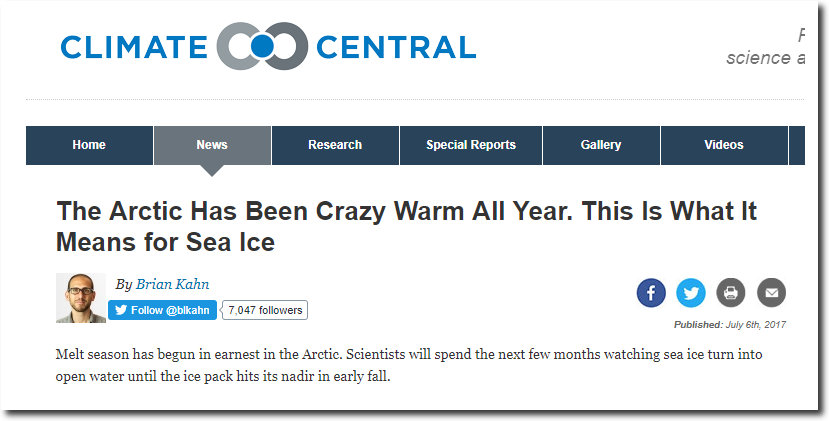
As it happens, in the real world where data matters, the arctic hasn't been crazy warm all year, it's having a cold summer with below average temperatures (north of the 80th parallel) every day since 01 May when compared to the 1958-2002 mean.
The winter-to-spring transition was warmer than average but peaked no higher than around -15 deg C from lows of around -30 deg C for latitudes north of the 80th parallel. This is nothing unusual, the region has long been known for short-term temperature fluctuations.
Last year The Guardian repeated a sure-fire fail of a prediction. So far, so fail.

In 2009 Gore was parroting agw gigo when he publicly stated that the arctic polar cap would vanish by 2014. Ooops. Afterwards his office clarified his statement, saying he meant "nearly ice-free" because ice would be expected to survive in island channels and other locations. Even with these weasel words it was still oopsville.
You have to ask what's Left of government 'science'.
As it happens, in the real world where data matters, the arctic hasn't been crazy warm all year, it's having a cold summer with below average temperatures (north of the 80th parallel) every day since 01 May when compared to the 1958-2002 mean.
The winter-to-spring transition was warmer than average but peaked no higher than around -15 deg C from lows of around -30 deg C for latitudes north of the 80th parallel. This is nothing unusual, the region has long been known for short-term temperature fluctuations.
Last year The Guardian repeated a sure-fire fail of a prediction. So far, so fail.
In 2009 Gore was parroting agw gigo when he publicly stated that the arctic polar cap would vanish by 2014. Ooops. Afterwards his office clarified his statement, saying he meant "nearly ice-free" because ice would be expected to survive in island channels and other locations. Even with these weasel words it was still oopsville.
You have to ask what's Left of government 'science'.
Gassing Station | News, Politics & Economics | Top of Page | What's New | My Stuff