Climate change - the POLITICAL debate. Vol 4
Discussion


wc98 said:
can you describe a naturally occurring weather phenomena(enhanced by agw) that would cause a spike in temperatures like that over a short period of time, like a few minutes ?
those spikes may well occur all the time, but at lower temps ,hence no record to hype for the msm. if you know where i can get the daily data for a year i will take a look.
FFS you'll take a look?those spikes may well occur all the time, but at lower temps ,hence no record to hype for the msm. if you know where i can get the daily data for a year i will take a look.
What.. when you're not peer reviewing papers for Nature ?
Talk about delusions of grandeur.
zygalski said:
wc98 said:
can you describe a naturally occurring weather phenomena(enhanced by agw) that would cause a spike in temperatures like that over a short period of time, like a few minutes ?
those spikes may well occur all the time, but at lower temps ,hence no record to hype for the msm. if you know where i can get the daily data for a year i will take a look.
FFS you'll take a look?those spikes may well occur all the time, but at lower temps ,hence no record to hype for the msm. if you know where i can get the daily data for a year i will take a look.
What.. when you're not peer reviewing papers for Nature ?
Talk about delusions of grandeur.

wc98 said:
can you describe a naturally occurring weather phenomena(enhanced by agw) that would cause a spike in temperatures like that over a short period of time, like a few minutes ?
That's an even better question than El s's. If the spikes at airports were just "sun comes out quickly and goes in quickly" over the same timescale as the Heathrow spike then that's a reason why such spikes would be more common.wc98 said:
those spikes may well occur all the time, but at lower temps ,hence no record to hype for the msm. if you know where i can get the daily data for a year i will take a look.
If you're in a low-carbon pro-agw activist organisation then based on recent history it's likely to be free of charge. Otherwise getting on for a hundred quid is the going rate for a day's worth, best of luck for a year. If the organsation you approach follows a Jones data management protocol, you may be waiting a while.turbobloke said:
I'd offer to decontaminate any dataset containing the scientific-buoy-to-unscientific-heat-contaminated-ship-engine-intake problem with SST but I doubt the offer would be accepted. That keyboard contamination was for Barry and Paris, awww sweet. He'll always have Paris.
Other than...if only there was a visible, measurable, causal carbon dioxide effect to subtract
This has already been done. Turns out the SST data had artefacts in it where correction factors had over compensated for the ship engine intake issue as more buoy data has been included in the overall dataset thus reducing the increase in SST over the last few decades.Other than...if only there was a visible, measurable, causal carbon dioxide effect to subtract
Lotus 50 said:
This has already been done. Turns out the SST data had artefacts in it where correction factors had over compensated for the ship engine intake issue as more buoy data has been included in the overall dataset thus reducing the increase in SST over the last few decades.
So crap data that had to be fiddled with to male it 'credible'Lotus 50 said:
turbobloke said:
I'd offer to decontaminate any dataset containing the scientific-buoy-to-unscientific-heat-contaminated-ship-engine-intake problem with SST but I doubt the offer would be accepted. That keyboard contamination was for Barry and Paris, awww sweet. He'll always have Paris.
Other than...if only there was a visible, measurable, causal carbon dioxide effect to subtract
This has already been done. Turns out the SST data had artefacts in it where correction factors had over compensated for the ship engine intake issue as more buoy data has been included in the overall dataset thus reducing the increase in SST over the last few decades.Other than...if only there was a visible, measurable, causal carbon dioxide effect to subtract
The authors produced adjustments that are at odds with all other surface temperature datasets, as well as those compiled via satellite.
Adjustments included adding 0.12°C to each buoy to bring their measurements in line with those taken from ship engine intakes...that number came from Kennedy et al (2011) where the uncertainty was reported as 0.12 ± 1.7°C.
Estimates of error in their decadal trend figures are far too small (see above) and the authors cite error in a 15-year period to a precision of one thousandth of a degree C.
Changes were largely to sea surface temperatures (SST) and align ship measurements of SST with night marine air temperature (NMAT) estimates, which have their own data bias problems.
When the atmosphere doesn't read IPCC reports, life for The Team is an endless quest to make reality fit in with gigo climate models.
Cherry picking is evident - the authors started their trend measures in 1998 and 2000, this has long been considered unwise as 1998 was a very strong El Nino year and 1999-2000 is a much cooler La Nina period - the difference between them results in distortion.
The authors, by ignoring the above, claim that their analysis produced twice as much warming for 1998-2014 than earlier estimates but this conclusion is, ironically, based on inbuilt biases in the analysis.
The largest changes were made since 1998, which is curious because this involves the highest quality of data with global coverage using several methods, and only one (this) analysis finds any increase in global annual average surface temperature for the period in question.
The extent of the largest SST adjustment made through The Pause, supposedly to reflect a continuing change in ship observations (from buckets to engine intakes) isn't justified by any evidence as to the magnitude of the appropriate adjustment, which appears to be far smaller.
Further to the first point above, The Pause is still present in the Hadley records of land surface and ocean, also in the Hadley sea surface measurements, it’s there in NCDC data, GISS also, and in the satellite data from RSS and UAH; with irony increasing it shows up in the best data available on the oceans, the ARGO buoys.
turbobloke said:
Not 'been done'. You're referring to advocacy blog excuses which have been posted before. The paper was a rush-job for Obama at Paris and did not follow NOAA protocols. As also published and posted previously:
The authors produced adjustments that are at odds with all other surface temperature datasets, as well as those compiled via satellite.
Adjustments included adding 0.12°C to each buoy to bring their measurements in line with those taken from ship engine intakes...that number came from Kennedy et al (2011) where the uncertainty was reported as 0.12 ± 1.7°C.
Estimates of error in their decadal trend figures are far too small (see above) and the authors cite error in a 15-year period to a precision of one thousandth of a degree C.
Changes were largely to sea surface temperatures (SST) and align ship measurements of SST with night marine air temperature (NMAT) estimates, which have their own data bias problems.
When the atmosphere doesn't read IPCC reports, life for The Team is an endless quest to make reality fit in with gigo climate models.
Cherry picking is evident - the authors started their trend measures in 1998 and 2000, this has long been considered unwise as 1998 was a very strong El Nino year and 1999-2000 is a much cooler La Nina period - the difference between them results in distortion.
The authors, by ignoring the above, claim that their analysis produced twice as much warming for 1998-2014 than earlier estimates but this conclusion is, ironically, based on inbuilt biases in the analysis.
The largest changes were made since 1998, which is curious because this involves the highest quality of data with global coverage using several methods, and only one (this) analysis finds any increase in global annual average surface temperature for the period in question.
The extent of the largest SST adjustment made through The Pause, supposedly to reflect a continuing change in ship observations (from buckets to engine intakes) isn't justified by any evidence as to the magnitude of the appropriate adjustment, which appears to be far smaller.
Further to the first point above, The Pause is still present in the Hadley records of land surface and ocean, also in the Hadley sea surface measurements, it’s there in NCDC data, GISS also, and in the satellite data from RSS and UAH; with irony increasing it shows up in the best data available on the oceans, the ARGO buoys.
I'm referring to:The authors produced adjustments that are at odds with all other surface temperature datasets, as well as those compiled via satellite.
Adjustments included adding 0.12°C to each buoy to bring their measurements in line with those taken from ship engine intakes...that number came from Kennedy et al (2011) where the uncertainty was reported as 0.12 ± 1.7°C.
Estimates of error in their decadal trend figures are far too small (see above) and the authors cite error in a 15-year period to a precision of one thousandth of a degree C.
Changes were largely to sea surface temperatures (SST) and align ship measurements of SST with night marine air temperature (NMAT) estimates, which have their own data bias problems.
When the atmosphere doesn't read IPCC reports, life for The Team is an endless quest to make reality fit in with gigo climate models.
Cherry picking is evident - the authors started their trend measures in 1998 and 2000, this has long been considered unwise as 1998 was a very strong El Nino year and 1999-2000 is a much cooler La Nina period - the difference between them results in distortion.
The authors, by ignoring the above, claim that their analysis produced twice as much warming for 1998-2014 than earlier estimates but this conclusion is, ironically, based on inbuilt biases in the analysis.
The largest changes were made since 1998, which is curious because this involves the highest quality of data with global coverage using several methods, and only one (this) analysis finds any increase in global annual average surface temperature for the period in question.
The extent of the largest SST adjustment made through The Pause, supposedly to reflect a continuing change in ship observations (from buckets to engine intakes) isn't justified by any evidence as to the magnitude of the appropriate adjustment, which appears to be far smaller.
Further to the first point above, The Pause is still present in the Hadley records of land surface and ocean, also in the Hadley sea surface measurements, it’s there in NCDC data, GISS also, and in the satellite data from RSS and UAH; with irony increasing it shows up in the best data available on the oceans, the ARGO buoys.
http://science.sciencemag.org/content/348/6242/146...
which was done using ESSRTv4:
https://journals.ametsoc.org/doi/full/10.1175/JCLI...
(version 5 was recently released which refines the corrections https://journals.ametsoc.org/doi/10.1175/JCLI-D-16...
and more recently:
http://advances.sciencemag.org/content/3/1/e160120...
...which confirms the validity of the amendments made to produce ERSSTv4 etc.
As far as other data sets go eg the Hadley Centre info is calculated using different techniques and the data available on the web seems to predate ERSSTv4 so the point that they still show 'the pause' may just relate to the groups concerned still evaluating the new info and taking it into account in their own work.
Coverage of the farce said:
NOAA whistleblowers have told the House Science Committee that Karl “rushed” to publish the climate study “before all appropriate reviews of the underlying science and new methodologies” used on the climate data sets were conducted.
The main blower was a (then) retired NOAA true believer. Pure farce.El stovey said:
turbobloke said:
El stovey said:
Why wouldn’t these spikes happen all the time?
That's a reasonable question. There are more questions.

Why doesn’t it happen at Heathrow all the time when there are aircraft landing and taking off on that runway?
I’ll try one more time,
1,What direction was the wind
2.What direction did the aircraft land in
3.Which exit did they use to vacate the runway
4.Why didn’t other landing aircraft cause a temperature spike.
5.Why would an aircraft slowing down to vacate the runway at idle or even reverse idle power cause a temperature spike at all.
6.If a temperature spike could be caused by landing aircraft at idle power or less, why wouldn’t aircraft taking off at full power be causing these temperature spikes all the time
Edited by El stovey on Saturday 28th July 12:02
 king big. Is there no room for better temperature measuring places? I guess introducing them would be a great opportunity for another round of 'data re-calibration'. That seems to be a favourite way of getting the data to match the models. The rabid green blob ought to be all over that idea. Then this debate would be null and void.
The thing is that urban areas are part of the planet as well as rural and it's important to be able to understand the weather and climate in both. The groups that put together the global surface temperature data sets are well aware of the issues in bringing these data together and take things like urban heat island effects into account when they do so. The very short-term spikes in temp that might be caused by nearby jet engines would be smoothed out/excluded from the data.
For example:
https://journals.ametsoc.org/doi/10.1175/JCLI-D-16...
http://static.berkeleyearth.org/papers/UHI-GIGS-1-...
https://data.giss.nasa.gov/gistemp/
For example:
https://journals.ametsoc.org/doi/10.1175/JCLI-D-16...
http://static.berkeleyearth.org/papers/UHI-GIGS-1-...
https://data.giss.nasa.gov/gistemp/
Davidonly said:
I am an Engineer. Why even consider any readings from places that enable this type of debate? The earth is very fking big. Is there no room for better temperature measuring places? I guess introducing them would be a great opportunity for another round of 'data re-calibration'. That seems to be a favourite way of getting the data to match the models. The rabid green blob ought to be all over that idea. Then this debate would be null and void.
I agree, (with the first bit) I’m just pointing out that the evidence presented by turbobloke for the two landing aircraft causing a spike was unlikely, due to wind directions and power settings and taxiway configurations etc and was asking for the people that all thought it was to explain how it happened. king big. Is there no room for better temperature measuring places? I guess introducing them would be a great opportunity for another round of 'data re-calibration'. That seems to be a favourite way of getting the data to match the models. The rabid green blob ought to be all over that idea. Then this debate would be null and void. As you can see, they haven’t and now moved on to something else.
It happens often in this and the renewables thread, someone quotes some evidence which sounds a bit technical but is incorrect, from a blogger or whoever, it doesn’t really stand up to scrutiny but the same posters all become google experts and jump in supporting it and making out they know all about it.
Then when it gets questioned by someone who does know about it, it all gets snowed under with loads of googled waffle and unrelated graphs and pictures and stories etc.
Then in 6 months when it comes up again they’ll shout about how it’s “already been covered on here FFS” and “attrition loops”
Ali G said:
Therefor it is an unexplained artefact - i.e. crap data.
If this demonstrates anything, it demonstrates data quality issues and the extent that the data has to be post-processed - which is open to abuse (should anyone be so minded to do so).

Possibly but it definitely demonstrates that your cult is made up of people talking bIf this demonstrates anything, it demonstrates data quality issues and the extent that the data has to be post-processed - which is open to abuse (should anyone be so minded to do so).
ks about things they don’t really understand. El stovey said:
Ali G said:
Therefor it is an unexplained artefact - i.e. crap data.
If this demonstrates anything, it demonstrates data quality issues and the extent that the data has to be post-processed - which is open to abuse (should anyone be so minded to do so).
Possibly but it definitely demonstrates that your cult is made up of people talking bIf this demonstrates anything, it demonstrates data quality issues and the extent that the data has to be post-processed - which is open to abuse (should anyone be so minded to do so).
ks about things they don’t really understand. Or has your anal sphincter malfunctioned again?

El stovey said:
Ali G said:
Is that my Physics cult?
Or has your anal sphincter malfunctioned again?
You can tell the rest of the cult don’t even like you, they just let you stay as you make them look clever.Or has your anal sphincter malfunctioned again?
You may yet have a verb named after you too!
The verb 'to Stovey' - meaningless diatribe with extra verbal diarrhea.
Ali G said:
...the data has to be post-processed - which is open to abuse (should anyone be so minded to do so).
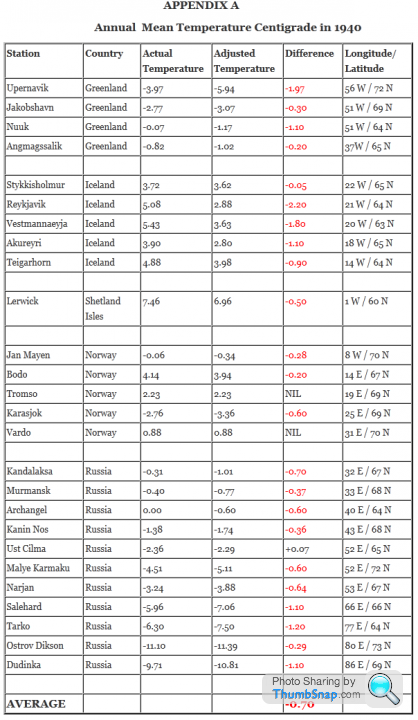
When minded, it's then hidden in plain sight.1 Re-writing history (see also Hide the Decline, Treemometers)
From: Tom Wigley <wigley@xxxx.xx>
To: Phil Jones <p.jones@uea.xx.xx>
Subject: 1940s
Date: Sun, 27 Sep 2009 23:25:38 -0600
Cc: Ben Santer <santer1@xxxx.gov>
It would be good to remove at least part of the 1940s blip, but we are still left with “why the blip”.
2 Warming Equals Adjustment
http://cdiac.ess-dive.lbl.gov/epubs/ndp/ushcn/ts.u...
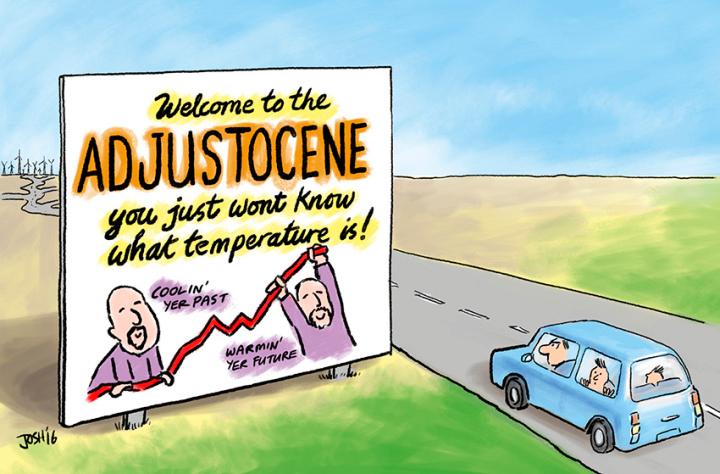
3 Coolin' yer past
4.While also warmin' yer present as models cook yer future
Original location here with article changed. Note 'unremarkable' described as 'remarkable' and see above 'Warming=Adjustment'
https://www.giss.nasa.gov/research/briefs/hansen_0...
5. Putting us in The Adjustocene
PS
100-150 years of flat temperatures in raw data from USA / Canada to Aus / N Zealand. This becomes manmadeup global warming how? Just like that ^^
El stovey said:
Davidonly said:
I am an Engineer. Why even consider any readings from places that enable this type of debate? The earth is very fking big. Is there no room for better temperature measuring places? I guess introducing them would be a great opportunity for another round of 'data re-calibration'. That seems to be a favourite way of getting the data to match the models. The rabid green blob ought to be all over that idea. Then this debate would be null and void.
I agree, (with the first bit) I’m just pointing out that the evidence presented by turbobloke for the two landing aircraft causing a spike was unlikely, due to wind directions and power settings and taxiway configurations etc and was asking for the people that all thought it was to explain how it happened. king big. Is there no room for better temperature measuring places? I guess introducing them would be a great opportunity for another round of 'data re-calibration'. That seems to be a favourite way of getting the data to match the models. The rabid green blob ought to be all over that idea. Then this debate would be null and void. As you can see, they haven’t and now moved on to something else.
It happens often in this and the renewables thread, someone quotes some evidence which sounds a bit technical but is incorrect, from a blogger or whoever, it doesn’t really stand up to scrutiny but the same posters all become google experts and jump in supporting it and making out they know all about it.
Then when it gets questioned by someone who does know about it, it all gets snowed under with loads of googled waffle and unrelated graphs and pictures and stories etc.
Then in 6 months when it comes up again they’ll shout about how it’s “already been covered on here FFS” and “attrition loops”
Gassing Station | News, Politics & Economics | Top of Page | What's New | My Stuff