Climate Change - The Scientific Debate (Vol. II)
Discussion


Kawasicki said:
So, estimated ECS under 1.5C is AGW denier and over 4.5C is AGW alarmist?
We need to get the numbers and the labels defined.
Technically, you're denying the evidence if you sit either side of that range aren't you. We need to get the numbers and the labels defined.
And conspiracy theorists are no less "alarmist" than the extremists at the other end.
Kawasicki said:
Gadgetmac said:
Kawasicki said:
Gadgetmac said:
Of course it's very heartening to see you linking to papers written by pro AGW scientists on the science thread.
You seem quite polarised in your opinion on AGW.At what level of estimated equilibrium climate sensitivity does one go from AGW denier to pro AGW?
I'd like to be able to categorise scientists as pro or against AGW, based on that number.
Is there an upper limit where a scientist changes from pro AGW to AGW alarmist?
When any climate scientist says "our findings are certainly not an excuse to not reduce our carbon emissions" you can very safely assume that they're pretty much in the pro AGW camp.

Can't think why you brought her up.

Equal Ice loss from high Himalaya as there is at the lower altitudes.
Everest region glaciers thinning at high altitudes
https://phys.org/news/2020-11-everest-region-glaci...
Dr. Owen King, of the School of Geography and Sustainable Development at the University of St Andrews, who led the study said: "Our results show that ice mass loss rates have consistently increased since the early 1960s and are now similar to the average global rate of ice loss, despite the regions extreme elevation. Ice loss has even occurred above 6000m above sea level which emphasizes the impact of climatic change on the harsh high mountain environment."
Dr. Atanu Bhattacharya, also of the School of Geography and Sustainable Development at the University of St Andrews, added: "The behavior of glaciers high in the Himalaya provides the clearest evidence of the far-reaching impacts of climate change on this remote region."
An increased rate of glacier recession in response to long-term warming will impact both local mountain communities and those further downstream because of its effect on the magnitude and timing of meltwater supply to rivers and because it enhances the risk from glacial hazards.
Ice loss in the Arctic can (and has in the past) influence ice loss in the Antarctic. There’s something not many will have expected.
Ice sheets on the move: Evidence of the interconnectedness of global climate
https://phys.org/news/2020-11-ice-sheets-north-sou...
Extract:
The study models how this seesaw effect works. They found that when ice on the Northern Hemisphere stayed frozen during the last peak of the Ice Age, about 20,000 to 26,000 years ago, it led to reduced sea-levels in Antarctica and a growth of the ice sheet there. When the climate warmed after that peak, the ice sheets in the north started melting, causing sea-levels in the southern hemisphere to rise. This rising ocean triggered the ice in Antarctica to retreat quickly to about the size it is today over thousands of years.
The question of what caused the Antarctic ice sheet to melt so rapidly during this warming period has been a long-standing enigma.
"That's the really exciting part of this," said Mitrovica, the Frank Baird Jr. Professor of Science in the Department of Earth and Planetary Sciences. "What was driving these dramatic events in which the Antarctic released huge amounts of ice mass? This research shows that the events weren't ultimately driven by anything local. They were driven by sea level rising locally but in response to the melting of ice sheets very far away. The study establishes an underappreciated connection between the stability of the Antarctic ice sheet and significant periods of melting in the Northern Hemisphere."
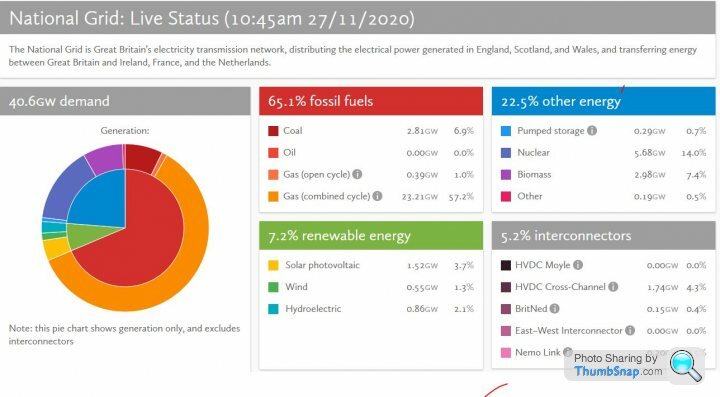
It is UK wind week, and renewables are providing a whole 7 % of UK electricity demand. Thanks to those evil fossil fuels and nuclear stations keeping all our lights on, keeping us warm and in the 21st century. I am waiting for some of this CO2 warming to kick in !
No wind, no sun, no power.
Go green, get medieval.
No wind, no sun, no power.
Go green, get medieval.
Is the Arctic a bellweather of climate change or not, on the ground rather than modelling or such?
If you look at the Arctic there has been a massive reduction in sea ice extent.
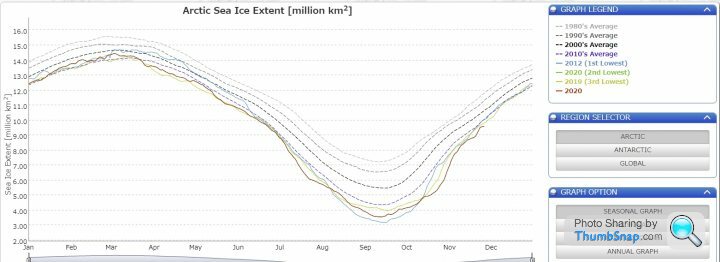
This reduction still has to be linked fully to an underlying cause. Man made global warming is the prime candidate so far.
Global version
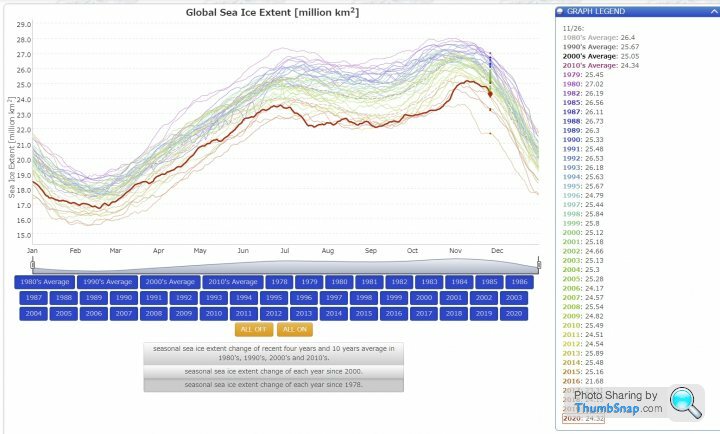
I really like Jaxa's data by the way, I use them all the time for looking at sea ice extent, rather than other sources. However I will be critical of using colours in those graphs. I know they have to use colours to distinguish easily for the human eye, but they are using blue colours, which normally represent cold, and red colours, which normally represent warm, depending on the year. This is a graph not on temps, but on sea ice extent, so colours should not be used here.
You could flip the colour spectrum around and have the higher values red and the lower values blue... it would still be accurate, but how would that be read by the casual observer?
The worst example I have seen on this is an article from The Guardian. Here
https://www.theguardian.com/weather/ng-interactive...
Now note I am not bothering about the words and whether they are right or not, I am just talking about how information is put across using colours.
If you look at
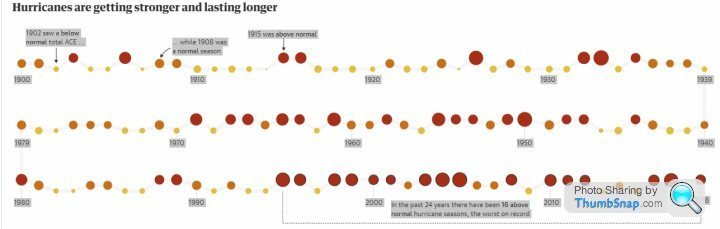
Notice how the biggest get coloured red, rather than just yellow. You could just have picked yellow for all circles and would have still be correct. But no, red means danger !
What value did the person doing this representation ( it's not a chart, has no numbers assigned to the area of the circles) decide to use red rather than yellow?
I've done some work on this using data and I can assure you this newspaper journo is wrong. However that is a different topic.
This is a pure demonstration on how using how the mind works is used to put a point across, rather than just data.
Be careful out there....
If you look at the Arctic there has been a massive reduction in sea ice extent.
This reduction still has to be linked fully to an underlying cause. Man made global warming is the prime candidate so far.
Global version
I really like Jaxa's data by the way, I use them all the time for looking at sea ice extent, rather than other sources. However I will be critical of using colours in those graphs. I know they have to use colours to distinguish easily for the human eye, but they are using blue colours, which normally represent cold, and red colours, which normally represent warm, depending on the year. This is a graph not on temps, but on sea ice extent, so colours should not be used here.
You could flip the colour spectrum around and have the higher values red and the lower values blue... it would still be accurate, but how would that be read by the casual observer?
The worst example I have seen on this is an article from The Guardian. Here
https://www.theguardian.com/weather/ng-interactive...
Now note I am not bothering about the words and whether they are right or not, I am just talking about how information is put across using colours.
If you look at
Notice how the biggest get coloured red, rather than just yellow. You could just have picked yellow for all circles and would have still be correct. But no, red means danger !
What value did the person doing this representation ( it's not a chart, has no numbers assigned to the area of the circles) decide to use red rather than yellow?
I've done some work on this using data and I can assure you this newspaper journo is wrong. However that is a different topic.
This is a pure demonstration on how using how the mind works is used to put a point across, rather than just data.
Be careful out there....
QuantumTokoloshi said:
It is UK wind week, and renewables are providing a whole 7 % of UK electricity demand. Thanks to those evil fossil fuels and nuclear stations keeping all our lights on, keeping us warm and in the 21st century. I am waiting for some of this CO2 warming to kick in !
No wind, no sun, no power.
Go green, get medieval.
Fossil fuels red ... danger.No wind, no sun, no power.
Go green, get medieval.
Renewables .. blue and green ...
See what I am saying?
It's really disingenuous.
Gadgetmac said:
Ice loss in the Arctic can (and has in the past) influence ice loss in the Antarctic. There’s something not many will have expected.
Ice sheets on the move: Evidence of the interconnectedness of global climate
https://phys.org/news/2020-11-ice-sheets-north-sou...
Extract:
The study models how this seesaw effect works. They found that when ice on the Northern Hemisphere stayed frozen during the last peak of the Ice Age, about 20,000 to 26,000 years ago, it led to reduced sea-levels in Antarctica and a growth of the ice sheet there. When the climate warmed after that peak, the ice sheets in the north started melting, causing sea-levels in the southern hemisphere to rise. This rising ocean triggered the ice in Antarctica to retreat quickly to about the size it is today over thousands of years.
The question of what caused the Antarctic ice sheet to melt so rapidly during this warming period has been a long-standing enigma.
"That's the really exciting part of this," said Mitrovica, the Frank Baird Jr. Professor of Science in the Department of Earth and Planetary Sciences. "What was driving these dramatic events in which the Antarctic released huge amounts of ice mass? This research shows that the events weren't ultimately driven by anything local. They were driven by sea level rising locally but in response to the melting of ice sheets very far away. The study establishes an underappreciated connection between the stability of the Antarctic ice sheet and significant periods of melting in the Northern Hemisphere."
I'm not sure what relevance this has to current day. That seems to be over a far longer time scale than the massive reduction in the Arctic sea ice over the last 40 years are so, whereas the Antarctic has not had similar decline.Ice sheets on the move: Evidence of the interconnectedness of global climate
https://phys.org/news/2020-11-ice-sheets-north-sou...
Extract:
The study models how this seesaw effect works. They found that when ice on the Northern Hemisphere stayed frozen during the last peak of the Ice Age, about 20,000 to 26,000 years ago, it led to reduced sea-levels in Antarctica and a growth of the ice sheet there. When the climate warmed after that peak, the ice sheets in the north started melting, causing sea-levels in the southern hemisphere to rise. This rising ocean triggered the ice in Antarctica to retreat quickly to about the size it is today over thousands of years.
The question of what caused the Antarctic ice sheet to melt so rapidly during this warming period has been a long-standing enigma.
"That's the really exciting part of this," said Mitrovica, the Frank Baird Jr. Professor of Science in the Department of Earth and Planetary Sciences. "What was driving these dramatic events in which the Antarctic released huge amounts of ice mass? This research shows that the events weren't ultimately driven by anything local. They were driven by sea level rising locally but in response to the melting of ice sheets very far away. The study establishes an underappreciated connection between the stability of the Antarctic ice sheet and significant periods of melting in the Northern Hemisphere."
Currently Antarctic
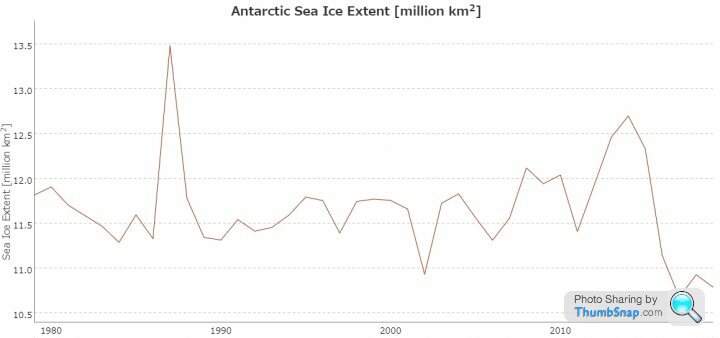 |https://thumbsnap.com/1eNukfKp[/url]
Currently Arctic
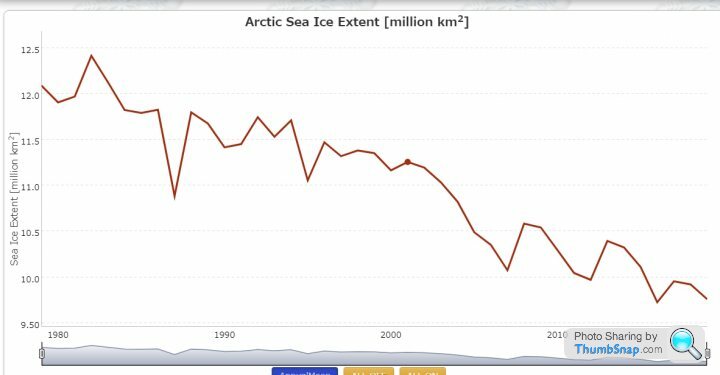
There is talk of AGW increasing the velocity of the southern ocean winds so keeping the Antarctic immune from global warming for a while.
Gadgetmac said:
Is this supposed to mean something in the Climate Change Science debate?
You posted this in the ‘future of power generation’ thread too (which is where it should be) and got asked a question on it by Evanivitch which you haven’t replied to. Can’t think why.
A question which made no sense. Not surprising I did not respond.You posted this in the ‘future of power generation’ thread too (which is where it should be) and got asked a question on it by Evanivitch which you haven’t replied to. Can’t think why.
Much like your point here, the irrational focus on carbon neutral renewables due to AGW has consequences when weather and climate do not follow the script.
The simple maxim of No wind, no sun, no renewable power gets lost amongst all the CO2 zealotry. I like living in the 21 st century, and when the adherence to AGW religion, starts causing an energy generation shortfall, it becomes everyone's issue, including the scientific basis for the decisions taken.
Edited by QuantumTokoloshi on Sunday 29th November 02:53
QuantumTokoloshi said:
A question which made no sense. Not surprising I did not respond.
Much like your point here, the irrational focus on carbon neutral renewables due to AGW has consequences when weather and climate do not follow the script.
The simple maxim of No wind, no sun, no renewable power gets lost amongst all the CO2 zealotry. I like living in the 21 st century, and when the adherence to AGW religion, starts causing an energy generation shortfall, it becomes everyone's issue, including the scientific basis for the decisions taken.
There's a thread specifically for you conspiracy theorists. You bring nothing to this one.Much like your point here, the irrational focus on carbon neutral renewables due to AGW has consequences when weather and climate do not follow the script.
The simple maxim of No wind, no sun, no renewable power gets lost amongst all the CO2 zealotry. I like living in the 21 st century, and when the adherence to AGW religion, starts causing an energy generation shortfall, it becomes everyone's issue, including the scientific basis for the decisions taken.
Average winter temperatures in Northeast (USA) have warmed by up to 4.8 degrees since 1970, new research shows
https://phys.org/news/2020-11-average-winter-tempe...
Extract:
In the winter of 1969-70, Philadelphia had an average temperature of 30.3 degrees Fahrenheit. Last year, the average was 39.4.
No one says snow and cold spells are things of the past. But winters have warmed considerably since 1970 in the Northeast, according to data compiled by Climate Central, an organization of scientists and journalists that research and report on climate.
Overall, the group found that winter not only is warmer than it was 50 years ago, it is warming faster than any other season in 38 states, including Pennsylvania and New Jersey.
Consider:
-In Philadelphia, Climate Central calculated that average winter temperatures have risen 4.8 degrees since 1970, and the season has 19 more days with above-normal temperatures.
-Atlantic City, New Jersey, winters have warmed 4.3 degrees with 14 more days above normal.
-Allentown, Pennsylvania, has warmed 3.8 degrees with 14 more days above normal.
To derive its findings, Climate Central used data from the Applied Climate Information System for 242 U.S. weather stations.
It calculated average temperatures and days above normal in December, January and February 1969-70, and compared the same months through 2019-20. An above-normal winter day was defined as one with an average temperature above the 1981-2010 normal.
Of the meteorological stations, 98% saw an increase in average winter temperatures since 1970, with most warming 2 degrees or more.
Overall, average winter temperatures increased the most around the Great Lakes and Northeast region, as did the number of days with above-normal temperatures.
Sean Sublette, a meteorologist at Climate Central who lives in Bucks County, said the 50-year data show an undeniable warming in the Philadelphia region.
However, even going back 150 years, minimum winter temperatures were rising though not as quickly. Still, the data indicate a steady upward trend over time, he said.
"All these minimums here are going up," Sublette said. "There's been no going back down. You start seeing a very consistent rise about 50 years ago."
He noted that temperatures are still rising even though the sun is currently in a less-active portion of its normal cycle. Low periods like we are now seeing should mean cooler temperatures.
However, Sublette said, the temperature trend is still rising, which scientists attribute to climate change.
Gadgetmac said:
QuantumTokoloshi said:
A question which made no sense. Not surprising I did not respond.
Much like your point here, the irrational focus on carbon neutral renewables due to AGW has consequences when weather and climate do not follow the script.
The simple maxim of No wind, no sun, no renewable power gets lost amongst all the CO2 zealotry. I like living in the 21 st century, and when the adherence to AGW religion, starts causing an energy generation shortfall, it becomes everyone's issue, including the scientific basis for the decisions taken.
There's a thread specifically for you conspiracy theorists. You bring nothing to this one.Much like your point here, the irrational focus on carbon neutral renewables due to AGW has consequences when weather and climate do not follow the script.
The simple maxim of No wind, no sun, no renewable power gets lost amongst all the CO2 zealotry. I like living in the 21 st century, and when the adherence to AGW religion, starts causing an energy generation shortfall, it becomes everyone's issue, including the scientific basis for the decisions taken.
There is a thread for your conspiracy theories, It is called, what Sci-fi have you read today. You bring comedy to this thread.
 k. Me. The irony! Glad I dipped in to see this one. I'll be off again now.

jshell said:
kerplunk][adopts patronising nasal tone said:
AGW denial zealots.
Hmm, that is paronising AF. How many posters here completely 'Deny', with zeal, any effects of mankind upon the climate?(similarly by red-herring I don't mean your question really is a fish)
Gassing Station | Science! | Top of Page | What's New | My Stuff