Climate Change - The Scientific Debate (Vol. II)
Discussion


PRTVR said:
kerplunk said:
PRTVR said:
There has been a few times where personally I have experienced a 20°C difference in temperatures over a 400 mile distance , living in the North east we get use to it 
Depending on the choice of temperature data (high or low) you are going to get a large variations in result and this is over a relatively small area if you pick a single point.
Scotland vs England mean temps. Quite similar annual variations and overall trends. England appears to have warmed a bit more than scotlandDepending on the choice of temperature data (high or low) you are going to get a large variations in result and this is over a relatively small area if you pick a single point.
if you apply it to somewhere like south America the error bars become so large as to make the data irrelevant.

jshell said:
Interesting - a quick search in Google scholar provides no link to any papers on temperature cycles by John Shewchuk. However I did find the following that provides a reconstruction of global temps for the Holocene (including error bars) which is very different from the image you've posted.https://www.nature.com/articles/s41597-020-0530-7
Can you provide a proper reference/link to your info?
kerplunk said:
PRTVR said:
kerplunk said:
PRTVR said:
There has been a few times where personally I have experienced a 20°C difference in temperatures over a 400 mile distance , living in the North east we get use to it
Depending on the choice of temperature data (high or low) you are going to get a large variations in result and this is over a relatively small area if you pick a single point.
Scotland vs England mean temps. Quite similar annual variations and overall trends. England appears to have warmed a bit more than scotlandDepending on the choice of temperature data (high or low) you are going to get a large variations in result and this is over a relatively small area if you pick a single point.
if you apply it to somewhere like south America the error bars become so large as to make the data irrelevant.
kerplunk said:
PRTVR said:
KP I struggle with that concept, the idea may work but accuracy must surely suffer.
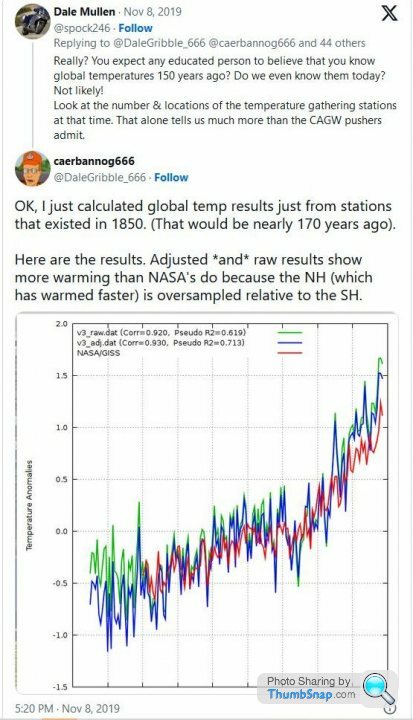
Yes of course, the post mentions one way it suffers due to NH sampling bias and it's there in the wider uncertainy bars in the early part of the record. Diderot thinks it's just flat out 'impossible' however - yet when you run 1850 sampling for the whole period a quite similar picture emerges.
Remember this came up as a result of declarations of 'warmest on record since 1850' as though 1850 sampling makes that a dodgy claim.
Edited by Diderot on Thursday 25th January 14:16
jshell said:
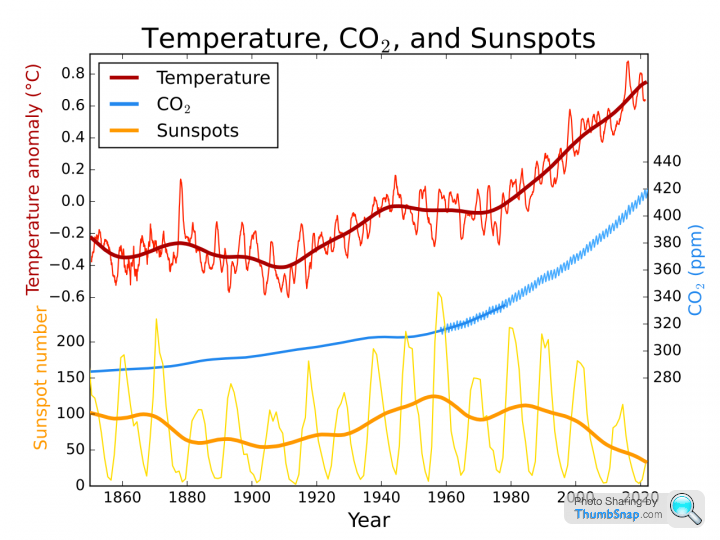
"The earth warming since the LIA ended in 1850 is natural"Because El Sol (full stop)
But then you need to explain why increasing greenhouse gases isn't a causal factor. Also why reduced volcanic activity wasn't a factor.
Early twentieth century warming has been attributed to a combination of those three elements. Why is it wrong?
Why is it El Sol? Because correlation.
But also correlation with increasing GHGs and reduced volcanic activity.
And then there's this breakdown for El Sol:
mko9 said:
kerplunk said:
PRTVR said:
kerplunk said:
PRTVR said:
There has been a few times where personally I have experienced a 20°C difference in temperatures over a 400 mile distance , living in the North east we get use to it
Depending on the choice of temperature data (high or low) you are going to get a large variations in result and this is over a relatively small area if you pick a single point.
Scotland vs England mean temps. Quite similar annual variations and overall trends. England appears to have warmed a bit more than scotlandDepending on the choice of temperature data (high or low) you are going to get a large variations in result and this is over a relatively small area if you pick a single point.
if you apply it to somewhere like south America the error bars become so large as to make the data irrelevant.
kerplunk said:
mko9 said:
kerplunk said:
PRTVR said:
kerplunk said:
PRTVR said:
There has been a few times where personally I have experienced a 20°C difference in temperatures over a 400 mile distance , living in the North east we get use to it
Depending on the choice of temperature data (high or low) you are going to get a large variations in result and this is over a relatively small area if you pick a single point.
Scotland vs England mean temps. Quite similar annual variations and overall trends. England appears to have warmed a bit more than scotlandDepending on the choice of temperature data (high or low) you are going to get a large variations in result and this is over a relatively small area if you pick a single point.
if you apply it to somewhere like south America the error bars become so large as to make the data irrelevant.
PRTVR said:
But can we claim the pluses and minuses would cancel each other out if we don't have the data, it could as easily be mostly pluses......
For actual weather it would be a random distribution and there would be cancelling out I think. To be fair though you could punt a 'systemic' bias eg UHI effect, which could potentially bias the resultDiderot said:
kerplunk said:
They are geographically proximate. You can’t legitimately compare that to having no data for most of the African continent, or Canada, or Russia, or South America. PRTVR said:
But can we claim the pluses and minuses would cancel each other out if we don't have the data, it could as easily be mostly pluses......
Absolutely it could, but how likely is it? I would expect the line to have a different wiggle but you're talking about places that would have to be spectacularly different to what we know to break out of the noise of whole record. If we could fill out some of the gaps, all I think it'd do is shunt the dates of hot/cold records around a bit but not a lot else.
You have to also consider that this is not our only source. There is the physical evidence that supports the temperature record e.g. loss rates of glaciers, permafrost etc. If there were places that were so hot to make a difference, there would surely be some kind of geological record of that (in things like bore hole data, for example) but afaik, there's no physical evidence to support that theory.
kerplunk said:
mko9 said:
kerplunk said:
PRTVR said:
kerplunk said:
PRTVR said:
There has been a few times where personally I have experienced a 20°C difference in temperatures over a 400 mile distance , living in the North east we get use to it
Depending on the choice of temperature data (high or low) you are going to get a large variations in result and this is over a relatively small area if you pick a single point.
Scotland vs England mean temps. Quite similar annual variations and overall trends. England appears to have warmed a bit more than scotlandDepending on the choice of temperature data (high or low) you are going to get a large variations in result and this is over a relatively small area if you pick a single point.
if you apply it to somewhere like south America the error bars become so large as to make the data irrelevant.
 t, that is totally unknowable. Maybe it would, or maybe the errors would compound themselves.
And even there your example is working off London and Edinbrough, which are on the same island and in the same region. What about when your only weather station in Africa south of the Sahara Desert is in Cape Town? Filling in the rest of the continent off that one weather station is pie in the sky, wishful thinking bulls
t. mko9 said:
Bullst, that is totally unknowable. Maybe it would, or maybe the errors would compound themselves.
And even there your example is working off London and Edinbrough, which are on the same island and in the same region. What about when your only weather station in Africa south of the Sahara Desert is in Cape Town? Filling in the rest of the continent off that one weather station is pie in the sky, wishful thinking bullst.
lol, PRTVR brought up weather variation in the UK potty mouth - calm yourself, you sound stressed out t, that is totally unknowable. Maybe it would, or maybe the errors would compound themselves.And even there your example is working off London and Edinbrough, which are on the same island and in the same region. What about when your only weather station in Africa south of the Sahara Desert is in Cape Town? Filling in the rest of the continent off that one weather station is pie in the sky, wishful thinking bulls
t. durbster said:
mko9 said:
Bullst, that is totally unknowable. Maybe it would, or maybe the errors would compound themselves.
It's totally unknowable, and yet somehow you know it's wrong.t, that is totally unknowable. Maybe it would, or maybe the errors would compound themselves.mko9 said:
But it would still be wrong.

Gassing Station | Science! | Top of Page | What's New | My Stuff