F430 Market Watch
Discussion


OK - time for another update. IF you're interested in 360 prices then head over here: Aldous Voice Blog.
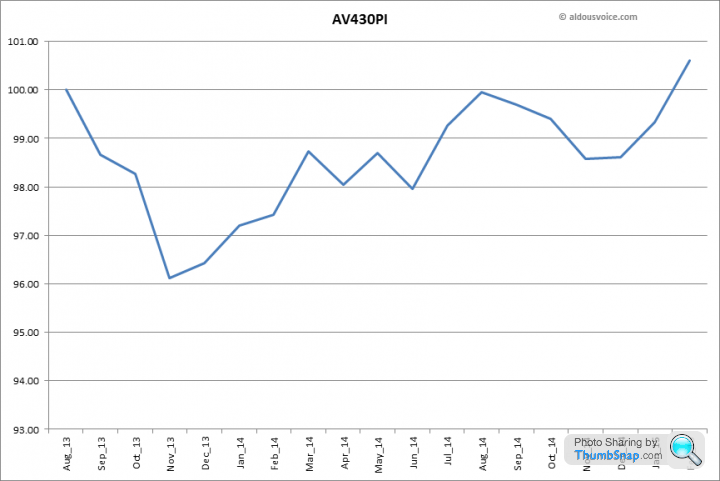
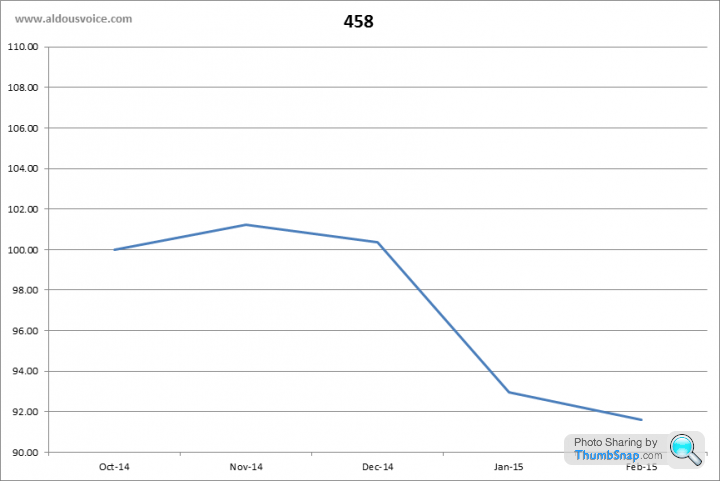
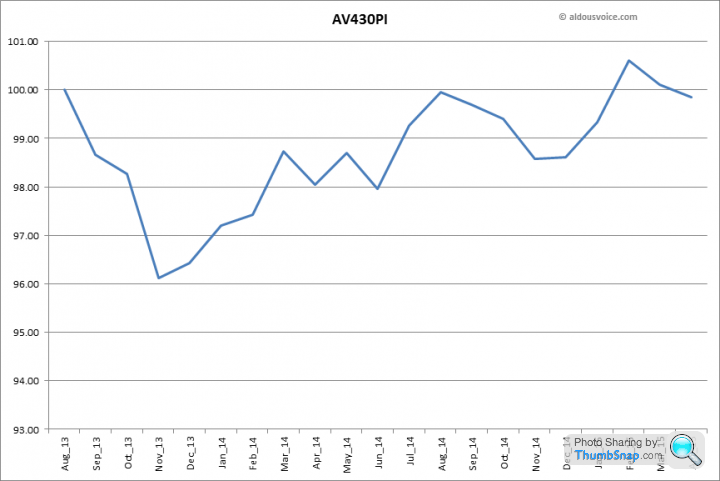
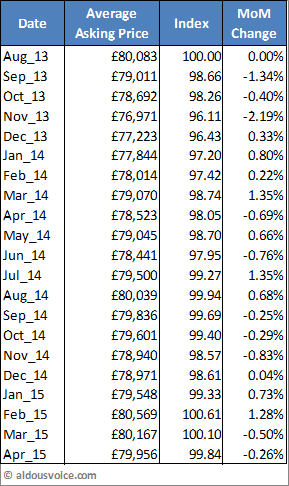
F430 prices have firmed for a 3rd month in a row. The average (mean) asking price has increased 1.28% from last month which leaves the index at 100.61. That means are back to the level when I first started collecting data back in August 2013.
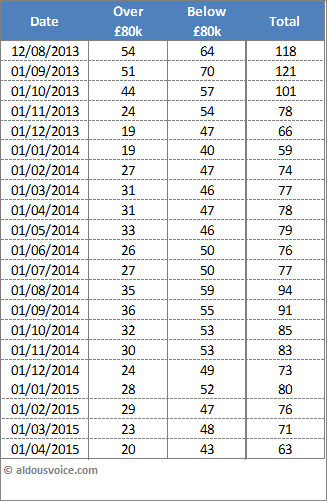
I see 23 cars dropping out of the data (and presumably sold), 19 new cars and 51 unsold. The number of cars priced below £80k has fallen suggesting that activity is skewed to the bottom of the market.

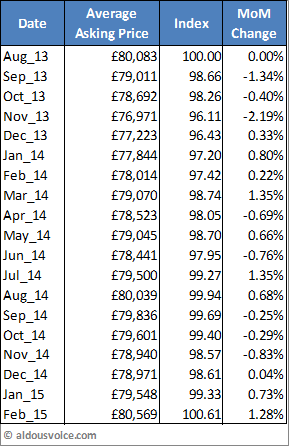
Here's the main data table:
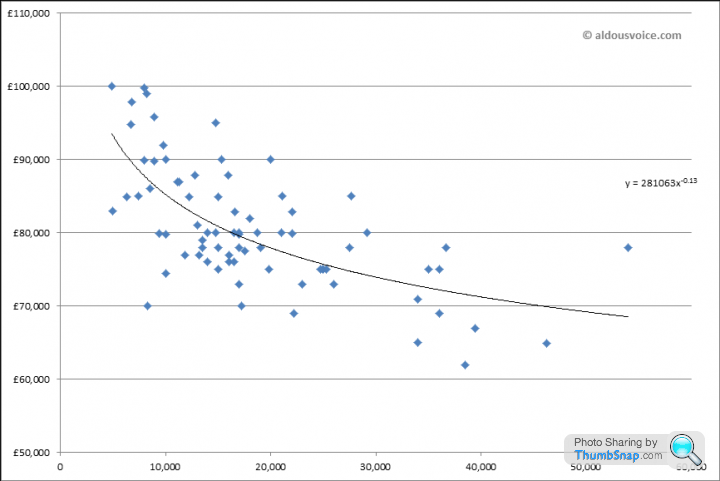
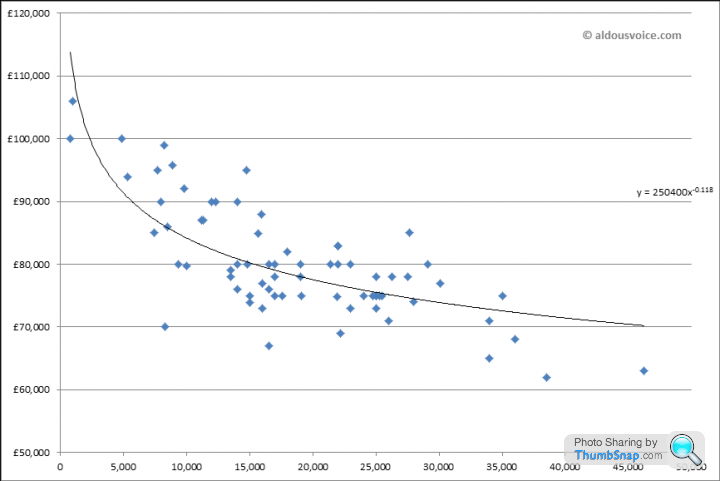
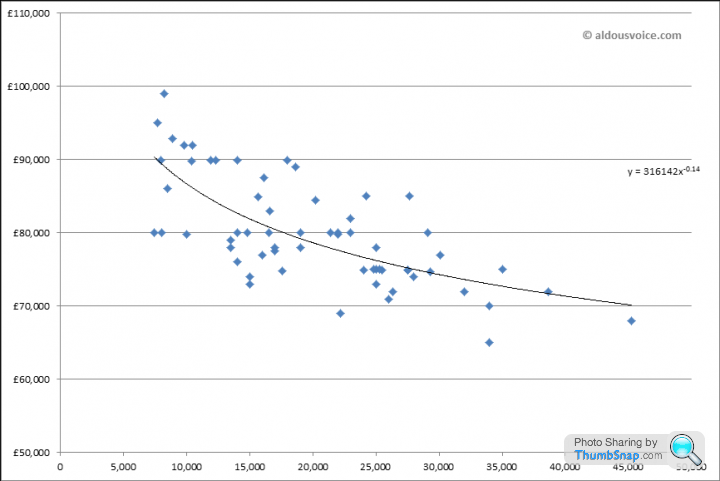
And here's the plot of asking price vs mileage:
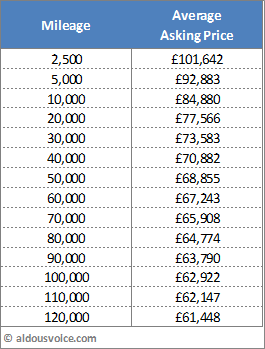
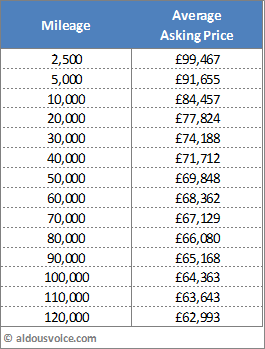
Average asking prices for the different mileage points:
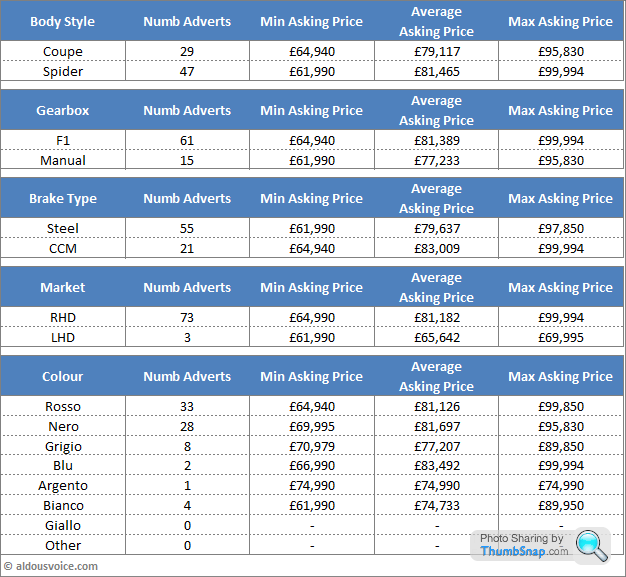
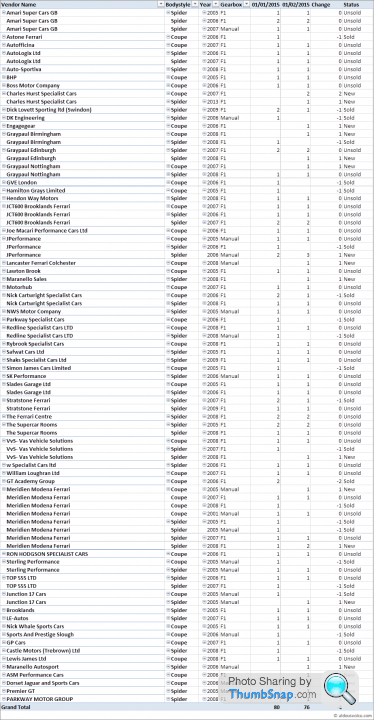
Here's the big table which tries to show which cars are moving and which are sticking around:
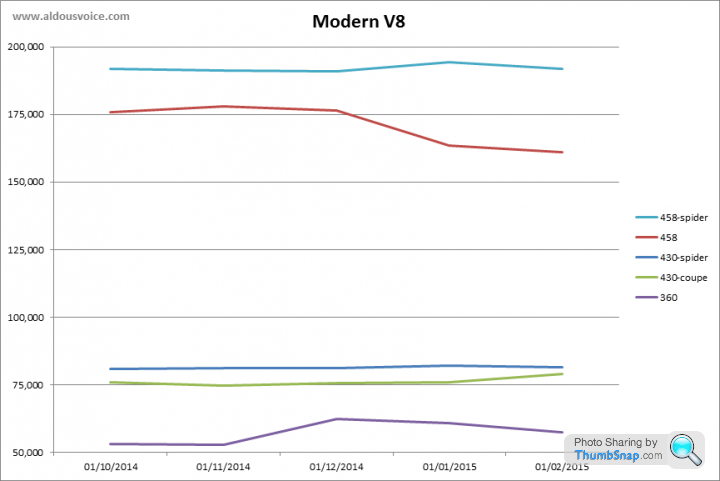
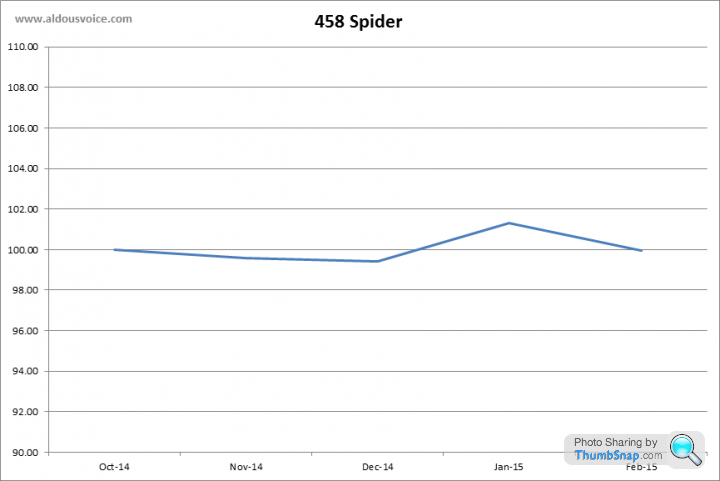
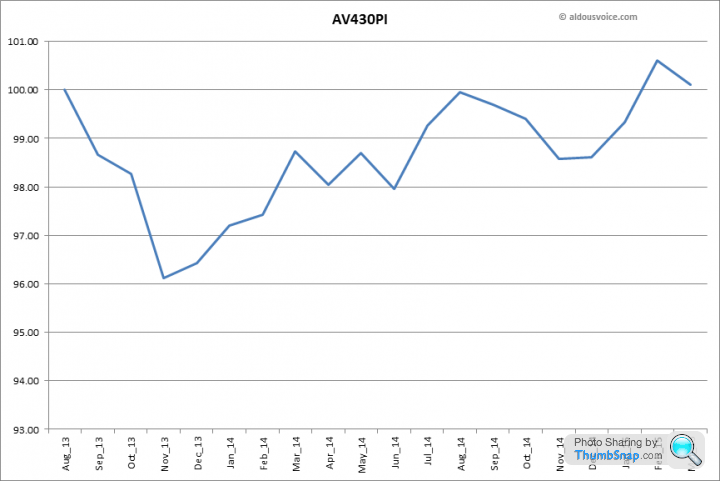
Here's a chart from something new that I'm developing. I have data on all Ferrari tipos (and am actually collecting more marques). I am toying with the idea of publishing indices for more models as well as charts showing the gaps in prices between different models. Here's the chart for modern V8 Ferraris.
The data hasn't been cleaned as much as the data that goes into my 360 and F430 updates but does serve to show the differences between the different models. What is interesting is the gulf between the 430 and 458. This can only be good for F430 residuals.
Please let me know if there's anything in particular that you'd like to see.
Regards,
Aldous Voice.
F430 prices have firmed for a 3rd month in a row. The average (mean) asking price has increased 1.28% from last month which leaves the index at 100.61. That means are back to the level when I first started collecting data back in August 2013.
I see 23 cars dropping out of the data (and presumably sold), 19 new cars and 51 unsold. The number of cars priced below £80k has fallen suggesting that activity is skewed to the bottom of the market.
Here's the main data table:
And here's the plot of asking price vs mileage:
Average asking prices for the different mileage points:
Here's the big table which tries to show which cars are moving and which are sticking around:
Here's a chart from something new that I'm developing. I have data on all Ferrari tipos (and am actually collecting more marques). I am toying with the idea of publishing indices for more models as well as charts showing the gaps in prices between different models. Here's the chart for modern V8 Ferraris.
The data hasn't been cleaned as much as the data that goes into my 360 and F430 updates but does serve to show the differences between the different models. What is interesting is the gulf between the 430 and 458. This can only be good for F430 residuals.
Please let me know if there's anything in particular that you'd like to see.
Regards,
Aldous Voice.
Average F430 asking prices have dropped back a modest 50bp since this time last month. The price index now stands at 100.10 - pretty much exactly where it was when I started collecting data. The MoM drop has been caused by a number of top end cars being sold which has pushed the average price down a touch.

Activity appears robust with 26 cars falling out of the data (presumably sold) and 21 new cars appearing - a drop of five in total. Interestingly, the numbers have fallen from the above £80k bracket suggesting that the top end of the market is active.
Here's the main table:
And here's the plot of asking price vs mileage:
Average asking prices for the different mileage points. Compare this table to last month's for further support for the assertion that the drop in average price has been caused by the top of the market.
Here's the big table which tries to show which cars are moving and which are sticking around:
That's it for now - I'm monumentally busy at the moment so don't really have time for much else. However, if you want anything in particular you know how to contact me.
Regards,
Aldous Voice.
Thanks for taking the time to prepare these stats Aldous.
I don't really follow the spider market other than to note there are usually twice as many spiders for sale than coupes. Makes me wonder if Ferrari sold more spiders than coupes in the first place? Will be interesting to see if fears of an expensive mechanical failure make spider roofs less attractive in the long term.
I don't really follow the spider market other than to note there are usually twice as many spiders for sale than coupes. Makes me wonder if Ferrari sold more spiders than coupes in the first place? Will be interesting to see if fears of an expensive mechanical failure make spider roofs less attractive in the long term.
For those who haven't seen it, the rise in 360 prices seems to be relentless: Aldous Voice Blog.
However, the same can't be said for the F430. Average asking prices have dropped a little (again) and has pushed the index down to 99.84.
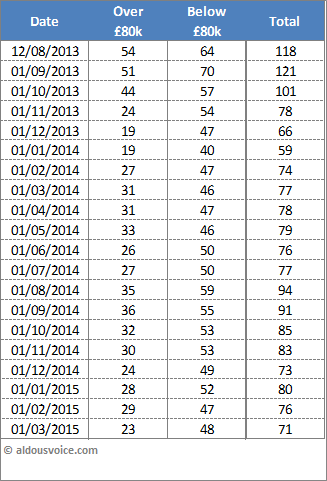
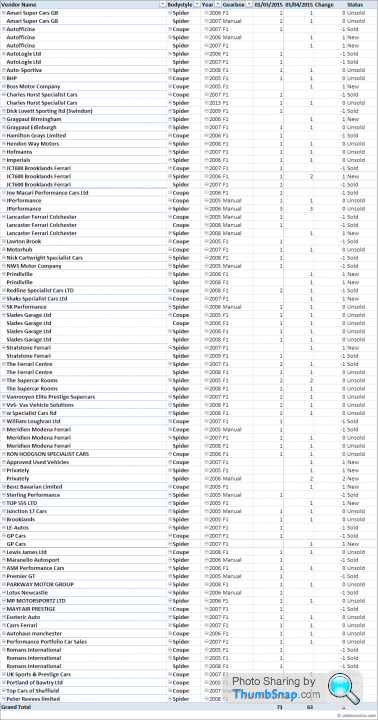
Cars are being sold though, I know of a number of transaction going through this month and the data also suggests 29 sold with 21 new cars to the market. What is very interesting is that the number of higher prices cars is declining as a proporation of those for sale. When I first started collecting the data it was as near as damn it a 50:50 split of those priced around the £80k mark. These days it is now 1/3 above £80k and 2/3 below.
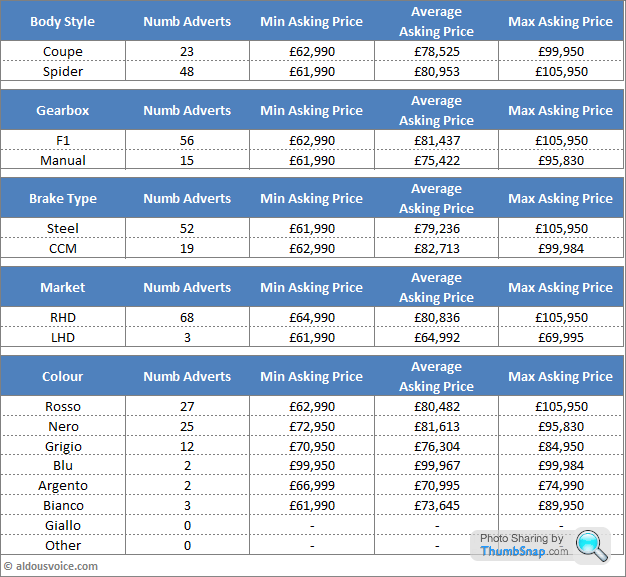
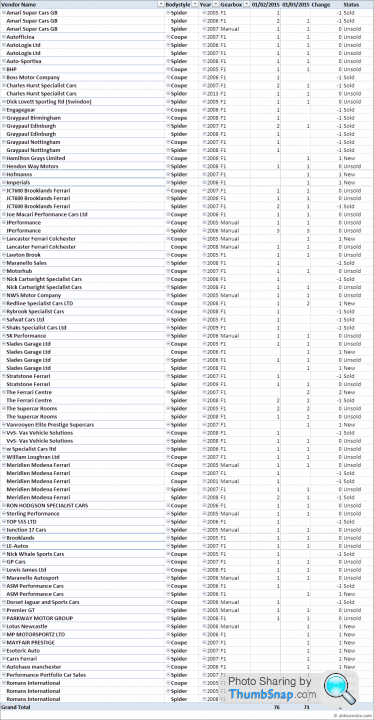
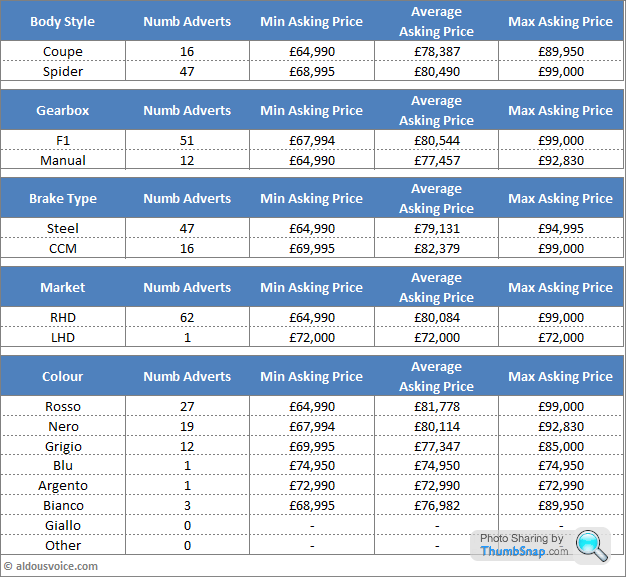
Here's the main table. Note that the number of coupes is declining - talking to people in the trade, this seems to be due to cars being bought for RHD markets in Singapore and Malaysia. They don't wont spiders as it is too hot (apparently).
And here's the data for asking price vs mileage:
Here's the big table showing how the population has changed over the month:
I'll end with a warning. I've been involved with a number of F430 purchases over the last few months and have looked at quite a few cars - I am surprised at the number of dogs I have seen. If you're in the market for an F430 and don't know what you're looking at, please get a professional opinion before committing your money.
However, the same can't be said for the F430. Average asking prices have dropped a little (again) and has pushed the index down to 99.84.
Cars are being sold though, I know of a number of transaction going through this month and the data also suggests 29 sold with 21 new cars to the market. What is very interesting is that the number of higher prices cars is declining as a proporation of those for sale. When I first started collecting the data it was as near as damn it a 50:50 split of those priced around the £80k mark. These days it is now 1/3 above £80k and 2/3 below.
Here's the main table. Note that the number of coupes is declining - talking to people in the trade, this seems to be due to cars being bought for RHD markets in Singapore and Malaysia. They don't wont spiders as it is too hot (apparently).
And here's the data for asking price vs mileage:
Here's the big table showing how the population has changed over the month:
I'll end with a warning. I've been involved with a number of F430 purchases over the last few months and have looked at quite a few cars - I am surprised at the number of dogs I have seen. If you're in the market for an F430 and don't know what you're looking at, please get a professional opinion before committing your money.
That seems a lot of cars sold this month. Is it possible to plot also number of cars sold per month. I know people feel the seasonal trend is quite well known but I think it would be interesting to track activity level.
Following on with your findings of the number of below par cars available for sale. If the market loses a proportion of the good cars as you say the coupes are being snapped up. Is it possible this will cause a skew of the prices to fall when in fact the market is more buoyant. That is why I think it would be interesting to see activity plotted against price. An above average rise in activity accompanied by a drop in price could signify good quality cars being removed from the market rather than a drop in overall value. Just a thought.
Great work by the way.
Good line of thought. I have tweaked my code to produce stats on cars dropping out of the data (presumably sold). It's not perfect but given the limited time I can devote to this it'll do.
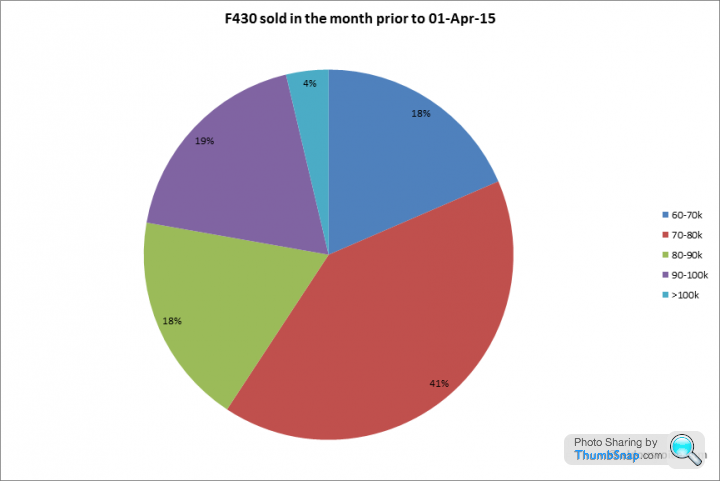
Here's a pie chart showing which price bracket the cars were previosuly in. It is interesting to note that nearly 1/4 of sales were for cars advertised above £90k (not this doesn't include those advertised at £89,995).
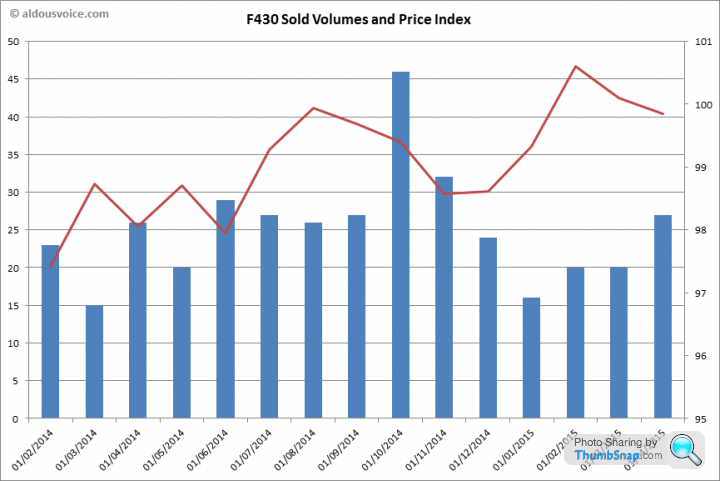
And here's what you were asking for (I think). On the face of it, the price action does seem to be negatively correlated with volumes...
Here's a pie chart showing which price bracket the cars were previosuly in. It is interesting to note that nearly 1/4 of sales were for cars advertised above £90k (not this doesn't include those advertised at £89,995).
And here's what you were asking for (I think). On the face of it, the price action does seem to be negatively correlated with volumes...
Very interesting stats and certainly gives us an idea of asking prices and the trend.
What's not so transparent is the actual transaction price.
We do something similar on new car list prices but then there are so many tactical and marketing offers on new cars the chart showing actual transaction prices in real terms is more interesting with some big differentials to the Advertised list prices.
Good work though
GRBF430F1 said:
Very interesting stats and certainly gives us an idea of asking prices and the trend.
What's not so transparent is the actual transaction price.
We do something similar on new car list prices but then there are so many tactical and marketing offers on new cars the chart showing actual transaction prices in real terms is more interesting with some big differentials to the Advertised list prices.
Good work though
I do have some visibility of transaction prices as I get involved with (to varying degrees) quite a few transactions and talk to a few dealers regularly. The problem for me is how to incorporate such anecdotal data into the hard data set that the adverts provide.What's not so transparent is the actual transaction price.
We do something similar on new car list prices but then there are so many tactical and marketing offers on new cars the chart showing actual transaction prices in real terms is more interesting with some big differentials to the Advertised list prices.
Good work though
I don't think anyone thinks there is no delta between the advertised and transaction prices. The whole point of this analysis is to provide information on trends that lie within the data.
I can say that the delta for 360s is very low (based on my info). I guess this is reflective of how hot that market is right now and the lack of really good cars. On the F430 side, the delta is a little more pronounced but on average seems to be held back by the main dealers negotiating hard.
You mention you compile data on new car prices - do you publish this? Also, how to you enrich the data with transaction prices (I assume you have a statistically different sized data set for each set)?
If the 488 is priced at the same level as the 458 then that has to put further pressure on 458 prices in the near term. The good news for the 430 is that there's still a reasonable buffer between it and the 458, as well as support from the 360.
This got me thinking for reasons why prior models might become more desirable than it's successor. Please feel free to add/correct my thoughts...
355 vs 360 (Obviously this has been real for a while)
"Classic" looks
Pop up headlights
Last truly analogue V8
360 vs F430
Softer front end which is aging really well
Nicer rear lights
Last of the dino engine
Last (practically) analogue V8
F430 vs 458
Erm, can't really think of anything. Perhaps it'll age better like the 360 did...
458 vs 488
Last of the mid-engined N/A V8's
not sure if you spotted this one - 430 on for shade under 103k.
http://www.stratstone.com/search/VehicleDetails/us...
btw as to your comparison - 430 v 458: good mix of analogue with not too much tech, less synthesised engine noise, single clutch F1 shift more visceral, back end looks better with twin lights/Enzo inspired design/normal exhaust ports...all totally subjective of course
Edited by supercampeao on Friday 10th April 09:46
voicey said:
This got me thinking for reasons why prior models might become more desirable than it's successor. Please feel free to add/correct my thoughts...
355 vs 360 (Obviously this has been real for a while)
"Classic" looks
Pop up headlights
Last truly analogue V8
360 vs F430
Softer front end which is aging really well
Nicer rear lights
Last of the dino engine
Last (practically) analogue V8
F430 vs 458
Erm, can't really think of anything. Perhaps it'll age better like the 360 did...
458 vs 488
Last of the mid-engined N/A V8's
Agreed on all counts 355 vs 360 (Obviously this has been real for a while)
"Classic" looks
Pop up headlights
Last truly analogue V8
360 vs F430
Softer front end which is aging really well
Nicer rear lights
Last of the dino engine
Last (practically) analogue V8
F430 vs 458
Erm, can't really think of anything. Perhaps it'll age better like the 360 did...
458 vs 488
Last of the mid-engined N/A V8's

Gassing Station | Supercar General | Top of Page | What's New | My Stuff