Grassing up a Covid **** taker.
Discussion


Phil. said:
The laugh on you because I don’t see the second wave of deaths that you predicted in that graph , but interpreting data/graphs isn’t one of your strengths is it 
Yeah, you looking to find any graph that flattens out what you actually predicted. I read the graphs just fine - and I'm certainly happy I didnt make the claims you did. I could post some updated ones if you want. I mean, 367 is a sizable leap.You still have ignored my question on Sweden, which you champion and ignore any other country (loads of them) who have so far performed better. Its entertaining. But where are the facts you talk about?
Killboy said:
I mean, imagine looking at this and saying the second wave is not possible. Why, because its ever so slightly slower?


I do certainly hope the numbers start to decrease by Christmas, because the current trajectory is certainly not looking good right now
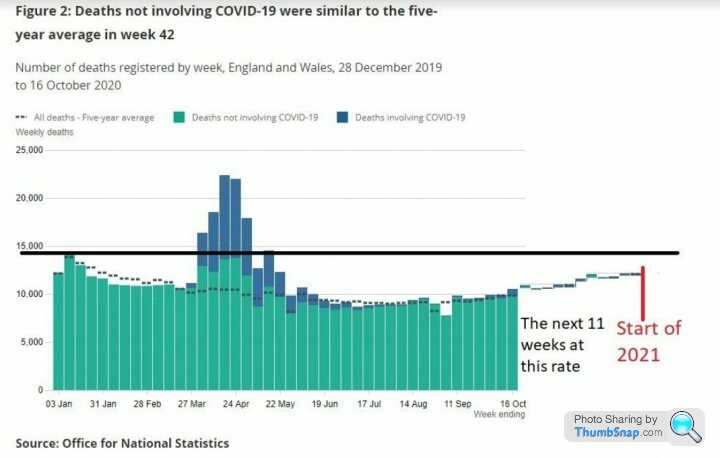
It's interesting. It's tempting to look at that curve and think 'second wave' or comparable to Spring. But when you see the ONS graphs for the same data the curve doesn't look nearly so steep, just because the x axis is a little longer. Figs 6 and 7 I do certainly hope the numbers start to decrease by Christmas, because the current trajectory is certainly not looking good right now
https://www.ons.gov.uk/peoplepopulationandcommunit...
But which one is 'the truth' ? Which ever one supports your argument, obviously

Killboy said:
I mean, imagine looking at this and saying the second wave is not possible. Why, because its ever so slightly slower?
I do certainly hope the numbers start to decrease by Christmas, because the current trajectory is certainly not looking good right now
Despite you banging on about the 2nd wave, viruses don't actually have 2nd waves. They just pass through the succeptible people until they run out of succeptible people. Places like London have basically got very few hosts left, hence continued low levels. The north was never really affected earlier in the year, hence why it's catching up now. This is what herd immunity is, and it's the only outcome whether the virus does it naturally, or whether a vaccine is introduced. By the time a vaccine comes it will be as good as useless, because there'll be very few succeptible people to need it.I do certainly hope the numbers start to decrease by Christmas, because the current trajectory is certainly not looking good right now
'Cases' and 'hospitalisations' are irrelevant. The data collection around them is so poor that it's meaningless.
Killboy said:
Phil. said:
The laugh on you because I don’t see the second wave of deaths that you predicted in that graph , but interpreting data/graphs isn’t one of your strengths is it
Yeah, you looking to find any graph that flattens out what you actually predicted. I read the graphs just fine - and I'm certainly happy I didnt make the claims you did. I could post some updated ones if you want. I mean, 367 is a sizable leap.You still have ignored my question on Sweden, which you champion and ignore any other country (loads of them) who have so far performed better. Its entertaining. But where are the facts you talk about?
Sticks. said:
It's interesting. It's tempting to look at that curve and think 'second wave' or comparable to Spring. But when you see the ONS graphs for the same data the curve doesn't look nearly so steep, just because the x axis is a little longer. Figs 6 and 7
https://www.ons.gov.uk/peoplepopulationandcommunit...
But which one is 'the truth' ? Which ever one supports your argument, obviously
Yes, its great to hide silly numbers in the "big picture". That data is sadly slow to update, and during the week ending 16 October the highest death count due to COVID was 137 (double check, apparently I'm not good at reading graphs). Today we've had 367 deaths. I'm sure to be told this is normal.https://www.ons.gov.uk/peoplepopulationandcommunit...
But which one is 'the truth' ? Which ever one supports your argument, obviously
Killboy said:
I mean, imagine looking at this and saying the second wave is not possible. Why, because its ever so slightly slower?
I do certainly hope the numbers start to decrease by Christmas, because the current trajectory is certainly not looking good right now
I posted this explanation of why we are not in a second wave using the curve you posted yesterday and again today, which you either didn’t understand, have ignored or have forgotten. Now do you understand why it’s becoming tiresome being asked the same old stupid questions over and over again?I do certainly hope the numbers start to decrease by Christmas, because the current trajectory is certainly not looking good right now
Phil. said:
Thank you Killboy you've just proved my point that we are not in a pandemic anymore and what we are seeing now is the much lower and expected seasonal affect of a flu virus. Certainly nothing worthy of lockdowns and other restrictions.
I've added a couple of lines to your graph to highlight what a pandemic looks like in terms of rate of increasing deaths, and to show when its not a pandemic because the increase in deaths is much lower, seasonal in fact. The pandemic has gone, we're in a political casedemic now.
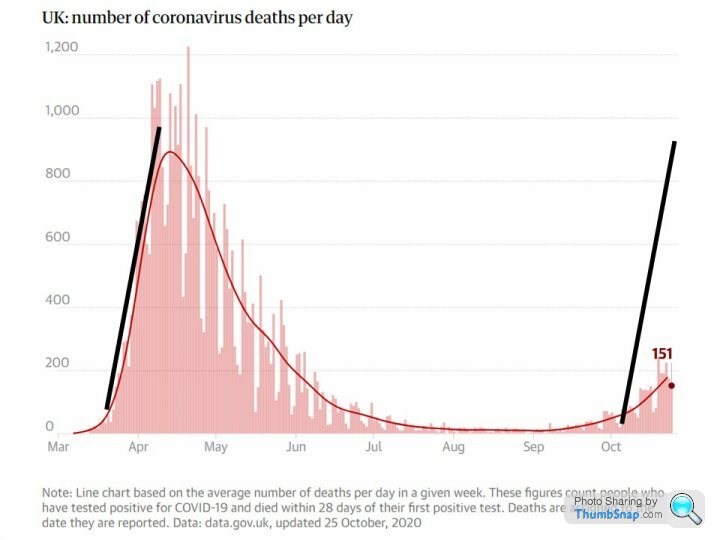
I've added a couple of lines to your graph to highlight what a pandemic looks like in terms of rate of increasing deaths, and to show when its not a pandemic because the increase in deaths is much lower, seasonal in fact. The pandemic has gone, we're in a political casedemic now.
I have recently been informed by an MD that they have been told (the chinese whispers gossip vine is shaking furiously) that anyone admitted to a hospice is immediately tested.. This then leads to a death within 28 days and............ In short, cooking the books. Can anyone admit or deny this ??
witko999 said:
Despite you banging on about the 2nd wave, viruses don't actually have 2nd waves. They just pass through the succeptible people until they run out of succeptible people. Places like London have basically got very few hosts left, hence continued low levels. The north was never really affected earlier in the year, hence why it's catching up now. This is what herd immunity is, and it's the only outcome whether the virus does it naturally, or whether a vaccine is introduced. By the time a vaccine comes it will be as good as useless, because there'll be very few succeptible people to need it.
'Cases' and 'hospitalisations' are irrelevant. The data collection around them is so poor that it's meaningless.
100% correct and there is a lot of evidence in support of the above. No conspiracy theories or tin foil. Scientific facts. But I doubt the COVID Warriors and Worriers will remember this by tomorrow though 'Cases' and 'hospitalisations' are irrelevant. The data collection around them is so poor that it's meaningless.

Next question
Killboy said:
Sticks. said:
It's interesting. It's tempting to look at that curve and think 'second wave' or comparable to Spring. But when you see the ONS graphs for the same data the curve doesn't look nearly so steep, just because the x axis is a little longer. Figs 6 and 7
https://www.ons.gov.uk/peoplepopulationandcommunit...
But which one is 'the truth' ? Which ever one supports your argument, obviously
Yes, its great to hide silly numbers in the "big picture". That data is sadly slow to update, and during the week ending 16 October the highest death count due to COVID was 137 (double check, apparently I'm not good at reading graphs). Today we've had 367 deaths. I'm sure to be told this is normal.https://www.ons.gov.uk/peoplepopulationandcommunit...
But which one is 'the truth' ? Which ever one supports your argument, obviously
The point still stands re graphs and curves. You can make them look like what you want.

Sticks. said:
I think the ONS data and graphs comparing current deaths to the 5 year average will be out in 10 days or so, so we shall see to what degree it's normal.
The point still stands re graphs and curves. You can make them look like what you want.
To what degree is 367 people dying from something that didn't exist last year normal? We've blown the flu budget some time around May. LolThe point still stands re graphs and curves. You can make them look like what you want.
Phil. said:
Killboy said:
I mean, imagine looking at this and saying the second wave is not possible. Why, because its ever so slightly slower?
I do certainly hope the numbers start to decrease by Christmas, because the current trajectory is certainly not looking good right now
I posted this explanation of why we are not in a second wave using the curve you posted yesterday and again today, which you either didn’t understand, have ignored or have forgotten. Now do you understand why it’s becoming tiresome being asked the same old stupid questions over and over again?I do certainly hope the numbers start to decrease by Christmas, because the current trajectory is certainly not looking good right now
Phil. said:
Thank you Killboy you've just proved my point that we are not in a pandemic anymore and what we are seeing now is the much lower and expected seasonal affect of a flu virus. Certainly nothing worthy of lockdowns and other restrictions.
I've added a couple of lines to your graph to highlight what a pandemic looks like in terms of rate of increasing deaths, and to show when its not a pandemic because the increase in deaths is much lower, seasonal in fact. The pandemic has gone, we're in a political casedemic now.
I've added a couple of lines to your graph to highlight what a pandemic looks like in terms of rate of increasing deaths, and to show when its not a pandemic because the increase in deaths is much lower, seasonal in fact. The pandemic has gone, we're in a political casedemic now.
Killboy said:
Phil. said:
Killboy said:
I mean, imagine looking at this and saying the second wave is not possible. Why, because its ever so slightly slower?
I do certainly hope the numbers start to decrease by Christmas, because the current trajectory is certainly not looking good right now
I posted this explanation of why we are not in a second wave using the curve you posted yesterday and again today, which you either didn’t understand, have ignored or have forgotten. Now do you understand why it’s becoming tiresome being asked the same old stupid questions over and over again?I do certainly hope the numbers start to decrease by Christmas, because the current trajectory is certainly not looking good right now
Phil. said:
Thank you Killboy you've just proved my point that we are not in a pandemic anymore and what we are seeing now is the much lower and expected seasonal affect of a flu virus. Certainly nothing worthy of lockdowns and other restrictions.
I've added a couple of lines to your graph to highlight what a pandemic looks like in terms of rate of increasing deaths, and to show when its not a pandemic because the increase in deaths is much lower, seasonal in fact. The pandemic has gone, we're in a political casedemic now.
I've added a couple of lines to your graph to highlight what a pandemic looks like in terms of rate of increasing deaths, and to show when its not a pandemic because the increase in deaths is much lower, seasonal in fact. The pandemic has gone, we're in a political casedemic now.
Killboy said:
Sticks. said:
I think the ONS data and graphs comparing current deaths to the 5 year average will be out in 10 days or so, so we shall see to what degree it's normal.
The point still stands re graphs and curves. You can make them look like what you want.
To what degree is 367 people dying from something that didn't exist last year normal? We've blown the flu budget some time around May. LolThe point still stands re graphs and curves. You can make them look like what you want.
Gassing Station | Speed, Plod & the Law | Top of Page | What's New | My Stuff