More 'Audiophile' bullsh*t
Discussion


TonyRPH said:
[...
A typical CD player when playing music recorded at 'normal' levels (e.g. peaking just below 0dbFS will output just below 2v constantly.
A 1kHz sine wave at 0dBFS will register 2v output.
...]
Not really sure what you're saying here, unless your idea of 'music' is 'peak loudness war'A typical CD player when playing music recorded at 'normal' levels (e.g. peaking just below 0dbFS will output just below 2v constantly.
A 1kHz sine wave at 0dBFS will register 2v output.
...]
Did you mean a CD player might have 2V DC on it?
Music will have crest factors or peak to mean anywhere from 6dB to 20dB
So the average RMS signal level is several dB below 'peak' or 'full scale'.
Tape decks are probably quite variable, but an FM tuner is working to a defined full scale of FM modulation that the signal must not go beyond.
That will be an ITU standard or something?
No doubt some pirate stations push the limits.

OutInTheShed said:
Not really sure what you're saying here, unless your idea of 'music' is 'peak loudness war'
Did you mean a CD player might have 2V DC on it?
My idea of music is not peak loudness war - but it's a sad fact that many CDs are mastered in this manner (as per the screenshot below).Did you mean a CD player might have 2V DC on it?
Regarding DC - of course not, what use would that be? I mean that 0dBFS will produce 2v RMS at the output of the majority of CD players and DACs.
Therefore depending on the music content, the average amplitude will range from 0v RMS to 2v RMS, but with a track like I used for my illustration below, with such limited dynamic range, the output (on average) of the CD player / DAC will be a fairly constant 2vRMS but obviously will vary according to content.
I never said anything about DC - I assumed (perhaps incorrectly!) that given the nature of the discussion, that it was safe to assume that all figures quoted were in vRMS and not vDC...
OutInTheShed said:
Music will have crest factors or peak to mean anywhere from 6dB to 20dB
So the average RMS signal level is several dB below 'peak' or 'full scale'.
Yes of course - but my point was that 0dBFS will yield 2vRMS - and there is a lot of (pop & rock) music that has an average amplitude hovering just below 0dBFS.So the average RMS signal level is several dB below 'peak' or 'full scale'.
OutInTheShed said:
Tape decks are probably quite variable, but an FM tuner is working to a defined full scale of FM modulation that the signal must not go beyond.
That will be an ITU standard or something?
No doubt some pirate stations push the limits.
My comments are based on a typical FM broadcast - and most stations aim for maximum modulation.That will be an ITU standard or something?
No doubt some pirate stations push the limits.
The output voltage (RMS) specs for an FM tuner are usually based on maximum modulation (although some will state the modulation level for a given output level).
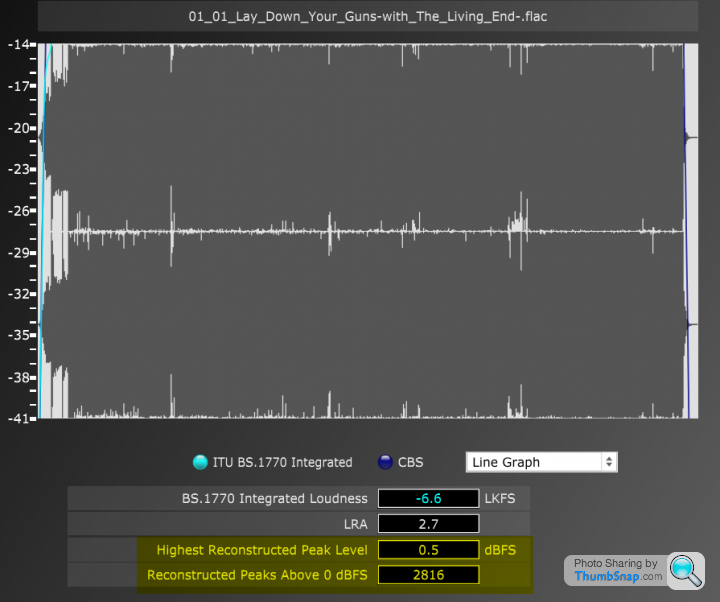
Regarding CD output - take the attached image for example, this is a level scan of a .flac file (the CD is the same of course) and as you will see, this is nudging 0dBFS throughout the entire song, and there were also 2816 peaks above 0dBFS.
This will drive the output of a DAC or typical CD player to an almost constant 2vRMS (with obvious variations according to content levels).

 t lol.
911hope said:
Gary C said:
That doesn't make a great deal of sense.
The recombination, interpolation was only bit to bit but if they were that slow they would tend to make it dull not bright ?
Some background...The recombination, interpolation was only bit to bit but if they were that slow they would tend to make it dull not bright ?
Interpolation is not bit to bit..
Interpolation is reconstructing the signal between the converted samples. This is done through the use of a low pass filter, with stop band at sample rate/2. Perfect reproduction requires a perfect filter, which does not exist. Infinite attenuation on the stop band.
Nyquist is responsible for this basic sampling theory work.
Early CD players had DACs, which were far from perfect so had inadequate roll off rates in the stop band and hence inadequate attenuation and allowed aliasing frequencies through.
A reasonable work around was to reduce the frequency of the stop band below FS/2. Harmless for CD with FS of 44.4kHz. 20kHz was a reasonable compromise.
So it was the difference frequencies ?
nebpor said:
911hope said:
Being sensible..the ADCs used in professional studio equipment have somewhat higher performance than the prosumer equipment used by hobbyists.
RME isn’t prosumer though so that’s an odd thing to say - they’re just very clean. The more expensive stuff is usually for the higher quality mic preamps where people desire a particular colour, but obviously that is different from a straight ADC for a line level signal The Chord DACs are very much worth the money, if you've ever heard a Mojo (the most basic device they sell) into decent headphones you'll be surprised. Then Qutest is a step up. Chord don't use off the shelf DAC chips. Watch this to see how they do it, all based on established and accepted maths, just implemented differently by Chord: https://www.youtube.com/watch?v=hCYUujl1zTM
SteveKTMer said:
If it works for you then that's great, but studios mixing music for the majors don't use the kit you are using, that's 100% for sure.
The Chord DACs are very much worth the money, if you've ever heard a Mojo (the most basic device they sell) into decent headphones you'll be surprised. Then Qutest is a step up. Chord don't use off the shelf DAC chips. Watch this to see how they do it, all based on established and accepted maths, just implemented differently by Chord: https://www.youtube.com/watch?v=hCYUujl1zTM
What’s your source of that info Steve? As always, you never know who you are chatting to across the ether - I’m happy and willing to accept you have more experience than me here. I also appreciate the studio being used to produce Taylor swift is a bit different, but I doubt folk on here are listening to heavily engineered pop music like that - though maybe they are!The Chord DACs are very much worth the money, if you've ever heard a Mojo (the most basic device they sell) into decent headphones you'll be surprised. Then Qutest is a step up. Chord don't use off the shelf DAC chips. Watch this to see how they do it, all based on established and accepted maths, just implemented differently by Chord: https://www.youtube.com/watch?v=hCYUujl1zTM
Having a quick scan of Chord (which I hadn’t heard of) sees a bit of discussion on its suitability for the studio compared to the normal culprits
RME is definitely pro kit. Is it the best kit on earth? Not claiming that. Are they clean and transparent and used by professional engineers? Absolutely. I bought RME because two of my sound engineer friends recommended them to me when I started upping my game from home level kit. One of them engineers in a high-end studio. One teaches as he can’t get a job!
TonyRPH said:
Can't work out what that graph is supposed to be saying.Scales on the X axis and z label on the y would help.
The dBFS thing in CD seems to be 0dBFS is a sine wave going from 0000 to FFFF. That is 2Vrms,
2Vrms is 5.656V peak to peak. For a sine wave.
A square wave 0000 to FFFF is still 5.656V pk/pk, but its RMS is 2.828V which is 3dB above a sinewave of the same peak.
The numbers below your graph show it has some peaks, the biggest of which it sees as a little bit of something other than a sine wave, 0.5dB
I'm not sure taking the RMS over a very short period to capture a peak is mathematically meaningful, unless you state the period you've averaging the mean square over, but maybe there's a standard for that?
What is doesn't mean is any sample is outside the 0000 to FFFF or 65536 range.
You can get spikes bigger than the peak value of signal by putting it through a filter which delays the harmonics differently to the fundamental for instance. E.g. turning your square wave into 'a funny shape'. An audio amp will have bandwidth and slew rate limitations. Presumably the filters on the output of a CD player might also do some odd things to fast squarewaves resulting in spikes?
Generally there's no great desire to listen to square waves, but anything that been clipped might have a square top or bottom...
OutInTheShed said:
Can't work out what that graph is supposed to be saying.
Scales on the X axis and z label on the y would help.
The dBFS thing in CD seems to be 0dBFS is a sine wave going from 0000 to FFFF. That is 2Vrms,
2Vrms is 5.656V peak to peak. For a sine wave.
A square wave 0000 to FFFF is still 5.656V pk/pk, but its RMS is 2.828V which is 3dB above a sinewave of the same peak.
The numbers below your graph show it has some peaks, the biggest of which it sees as a little bit of something other than a sine wave, 0.5dB
I'm not sure taking the RMS over a very short period to capture a peak is mathematically meaningful, unless you state the period you've averaging the mean square over, but maybe there's a standard for that?
What is doesn't mean is any sample is outside the 0000 to FFFF or 65536 range.
You can get spikes bigger than the peak value of signal by putting it through a filter which delays the harmonics differently to the fundamental for instance. E.g. turning your square wave into 'a funny shape'. An audio amp will have bandwidth and slew rate limitations. Presumably the filters on the output of a CD player might also do some odd things to fast squarewaves resulting in spikes?
Generally there's no great desire to listen to square waves, but anything that been clipped might have a square top or bottom...
Not sure what you are saying with the digital signal references, but don't forget to cater for negative numbers in the digital signal range, using 2's complement representation.Scales on the X axis and z label on the y would help.
The dBFS thing in CD seems to be 0dBFS is a sine wave going from 0000 to FFFF. That is 2Vrms,
2Vrms is 5.656V peak to peak. For a sine wave.
A square wave 0000 to FFFF is still 5.656V pk/pk, but its RMS is 2.828V which is 3dB above a sinewave of the same peak.
The numbers below your graph show it has some peaks, the biggest of which it sees as a little bit of something other than a sine wave, 0.5dB
I'm not sure taking the RMS over a very short period to capture a peak is mathematically meaningful, unless you state the period you've averaging the mean square over, but maybe there's a standard for that?
What is doesn't mean is any sample is outside the 0000 to FFFF or 65536 range.
You can get spikes bigger than the peak value of signal by putting it through a filter which delays the harmonics differently to the fundamental for instance. E.g. turning your square wave into 'a funny shape'. An audio amp will have bandwidth and slew rate limitations. Presumably the filters on the output of a CD player might also do some odd things to fast squarewaves resulting in spikes?
Generally there's no great desire to listen to square waves, but anything that been clipped might have a square top or bottom...
OutInTheShed said:
Can't work out what that graph is supposed to be saying.
Scales on the X axis and z label on the y would help.
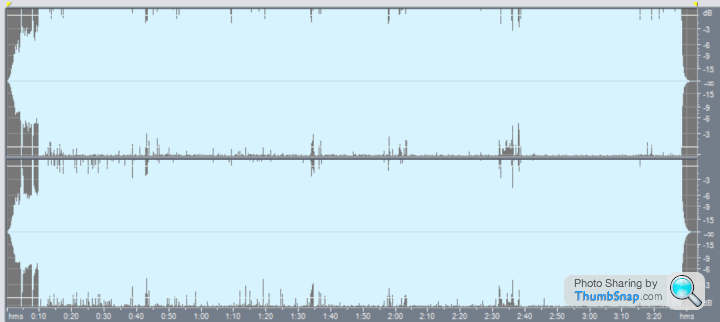
See new graph with both time and dB scales.Scales on the X axis and z label on the y would help.
OutInTheShed said:
The dBFS thing in CD seems to be 0dBFS is a sine wave going from 0000 to FFFF. That is 2Vrms,
2Vrms is 5.656V peak to peak. For a sine wave.
A square wave 0000 to FFFF is still 5.656V pk/pk, but its RMS is 2.828V which is 3dB above a sinewave of the same peak.
The numbers below your graph show it has some peaks, the biggest of which it sees as a little bit of something other than a sine wave, 0.5dB
I'm not sure taking the RMS over a very short period to capture a peak is mathematically meaningful, unless you state the period you've averaging the mean square over, but maybe there's a standard for that?
What is doesn't mean is any sample is outside the 0000 to FFFF or 65536 range.
You can get spikes bigger than the peak value of signal by putting it through a filter which delays the harmonics differently to the fundamental for instance. E.g. turning your square wave into 'a funny shape'. An audio amp will have bandwidth and slew rate limitations. Presumably the filters on the output of a CD player might also do some odd things to fast squarewaves resulting in spikes?
Generally there's no great desire to listen to square waves, but anything that been clipped might have a square top or bottom...
The initial graph I posted (and this latest one) is sampling the entire song.2Vrms is 5.656V peak to peak. For a sine wave.
A square wave 0000 to FFFF is still 5.656V pk/pk, but its RMS is 2.828V which is 3dB above a sinewave of the same peak.
The numbers below your graph show it has some peaks, the biggest of which it sees as a little bit of something other than a sine wave, 0.5dB
I'm not sure taking the RMS over a very short period to capture a peak is mathematically meaningful, unless you state the period you've averaging the mean square over, but maybe there's a standard for that?
What is doesn't mean is any sample is outside the 0000 to FFFF or 65536 range.
You can get spikes bigger than the peak value of signal by putting it through a filter which delays the harmonics differently to the fundamental for instance. E.g. turning your square wave into 'a funny shape'. An audio amp will have bandwidth and slew rate limitations. Presumably the filters on the output of a CD player might also do some odd things to fast squarewaves resulting in spikes?
Generally there's no great desire to listen to square waves, but anything that been clipped might have a square top or bottom...
Graph with time vs. amplitude.
TonyRPH said:
My comments are based on a typical FM broadcast - and most stations aim for maximum modulation.
The output voltage (RMS) specs for an FM tuner are usually based on maximum modulation (although some will state the modulation level for a given output level).
Regarding CD output - take the attached image for example, this is a level scan of a .flac file (the CD is the same of course) and as you will see, this is nudging 0dBFS throughout the entire song, and there were also 2816 peaks above 0dBFS.
This will drive the output of a DAC or typical CD player to an almost constant 2vRMS (with obvious variations according to content levels).
How can you have a peak above 0dBFS?The output voltage (RMS) specs for an FM tuner are usually based on maximum modulation (although some will state the modulation level for a given output level).
Regarding CD output - take the attached image for example, this is a level scan of a .flac file (the CD is the same of course) and as you will see, this is nudging 0dBFS throughout the entire song, and there were also 2816 peaks above 0dBFS.
This will drive the output of a DAC or typical CD player to an almost constant 2vRMS (with obvious variations according to content levels).
Other than this, the key thing to understand is whether the content is compressed to 0dBFS, or clipped at 0dBFS.
911hope said:
How can you have a peak above 0dBFS?
Other than this, the key thing to understand is whether the content is compressed to 0dBFS, or clipped at 0dBFS.
Peaks above 0dBFS are caused by Intersample overs if my understanding of the linked article is correct.Other than this, the key thing to understand is whether the content is compressed to 0dBFS, or clipped at 0dBFS.
If intersample overs are giving a true representation of the original audio, then surely the audio is in fact clipped to get the actual samples?
Is it an artefact of digital mixing, creating a stream of samples which imply clipping, even if none of the component tracks were ever clipped?
But will this in fact be audible, because the clipping will create harmonics up at the sample rate and beyond?
Does putting such a track through FLAC have any adverse effect?
Is the +0.?? dBFS reported by whatever program Tony was using actually 'intersample' or does that program only know about the actual samples? Is the program upsampling, or is the upsampling only done in the DAC?
How close is the 'intersample clipped' sound which comes out of my CD player to what the band intended?
Gassing Station | Home Cinema & Hi-Fi | Top of Page | What's New | My Stuff