Climate change - the POLITICAL debate. Vol 4
Discussion


El stovey said:
jjlynn27 said:
LoonyTunes said:
jjlynn27 said:
But I'm curious about that reply that was edited by a Mod. Tell me more about that one 


kerplunk said:
wc98 said:
El stovey said:
So the record at Heathrow was caused by UHI or a spike caused by two aircraft landing?
can you describe a naturally occurring weather phenomena(enhanced by agw) that would cause a spike in temperatures like that over a short period of time, like a few minutes ?those spikes may well occur all the time, but at lower temps ,hence no record to hype for the msm. if you know where i can get the daily data for a year i will take a look.
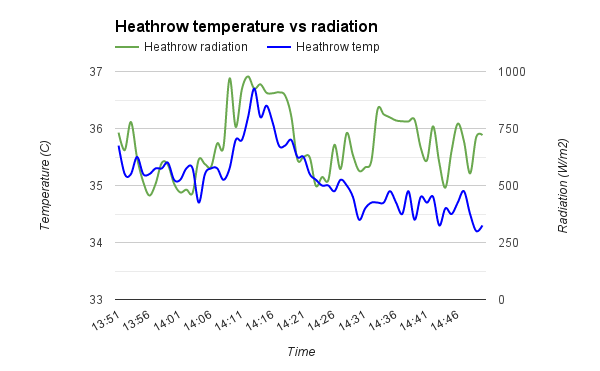
https://www.carbonbrief.org/met-office-wind-data-d...
. first the wind data , note the direction is correct for carrying heat from engines toward the weather station. secondly,ind rarely blows at a steady speed, do we have wind speed data ? i suspect they do but haven't shown it. next , looking at the aerial image of the airport there is a turn off the runway onto a taxi way just to the south east of the weather station. it would help to know if this is the turning the aircraft made off the runway. if it was it puts the exhaust stream roughly inline with the wind direction and weather station during the turn.
regarding the aircraft taxiing. the 747 is a heavy old lump when full of luggage and passengers (surprisngly agile with only 8 people on board as i once found out on a test flight) and when turning on the ground more throttle can sometimes be required due to tyre scrub. el stovey might know if it is required on that particular turn. also the 747 has four engines where many more modern airliners have two ,hence more heat in a wider spread.
the data will be there to check all of that out. whether the will is or not is a completely different thing.
another thing to take into consideration in terms of historical weather records is airport expansion and increase in traffic. does anyone really believe that if the airport wasn't there the temperature would be the same ? if the temp had been over an hour or more it may be more significant. comparing 5 minute automatic measurements with historical readings taken twice a day that would miss short term spikes is a bit apples to oranges for me.
there are clear and well defined reasons for siting weather stations where anthropogenic effects are minimised ,any airport with a tarmac runway never mind acres of concrete is bad site.
Been waiting for this
Soggy 2017 was fifth warmest year in UK record
https://www.bbc.co.uk/news/science-environment-450...
2017 was the fifth warmest year in the UK climate record that stretches back to 1910 according to a new analysis from the Met Office.
Their State of the Climate Report says that nine of the ten warmest years on record for the UK have occurred since 2002.
The study says that 2017 was more than 1 degree C above the 1961-1990 baseline temperature.
Summer rainfall has also increased significantly over the last ten years.
Compared to the sun kissed scorcher of a summer that the UK has generally been experiencing this year, 2017 was a rather soggy year with above average rainfall from June through August.
Despite the rain, temperatures from February to June were also above average - and the number of days with air frosts was 45, which is nine below average.
The overall mean temperature for the 2017 was 9.6 degrees C, which made it the fifth warmest in the UK series dating from 1910, and the eight warmest in the Central England temperature series which dates back to 1659.
And last, but not least, we have:-
The authors say if you look at the trend over a decade or more, it is further evidence that the climate is changing both globally and here in the UK.
Oh really, can you publish the proof of that ?
The whole 'story' is complete b ks of course, as some arbitary starting point has been chosen. The whole article is a puff piece about, er, nothing.
Soggy 2017 was fifth warmest year in UK record
https://www.bbc.co.uk/news/science-environment-450...
2017 was the fifth warmest year in the UK climate record that stretches back to 1910 according to a new analysis from the Met Office.
Their State of the Climate Report says that nine of the ten warmest years on record for the UK have occurred since 2002.
The study says that 2017 was more than 1 degree C above the 1961-1990 baseline temperature.
Summer rainfall has also increased significantly over the last ten years.
Compared to the sun kissed scorcher of a summer that the UK has generally been experiencing this year, 2017 was a rather soggy year with above average rainfall from June through August.
Despite the rain, temperatures from February to June were also above average - and the number of days with air frosts was 45, which is nine below average.
The overall mean temperature for the 2017 was 9.6 degrees C, which made it the fifth warmest in the UK series dating from 1910, and the eight warmest in the Central England temperature series which dates back to 1659.
And last, but not least, we have:-
The authors say if you look at the trend over a decade or more, it is further evidence that the climate is changing both globally and here in the UK.
Oh really, can you publish the proof of that ?
The whole 'story' is complete b
ks of course, as some arbitary starting point has been chosen. The whole article is a puff piece about, er, nothing.Records were better in the 70s (Bowie, T Rex etc).
Still no causality so the hype is luvverly but with nothing whatsoever to say on what caused anything.
This is glossed over by the beeb and individual believers. Otherwise the agw corpse would finally lie down, as opposed to being paraded about with politicians' hands up its backside, so it has to be repeatedly ignored even though it's the key point to consider.
Still no causality so the hype is luvverly
but with nothing whatsoever to say on what caused anything.This is glossed over by the beeb and individual believers. Otherwise the agw corpse would finally lie down, as opposed to being paraded about with politicians' hands up its backside, so it has to be repeatedly ignored even though it's the key point to consider.
Nobody says 'Yes' to everything.
Teen spirit has a voice too.
https://www.youtube.com/watch?v=hTWKbfoikeg
A bit of a cheap trick - I know.
Teen spirit has a voice too.
https://www.youtube.com/watch?v=hTWKbfoikeg
A bit of a cheap trick - I know.
Demonstrated! Another unsurprising benefit of atmospheric carbon dioxide levels being marginally above photosynthetic starvation levels: as well as greening the planet in general with lush grasses / trees / vegetation and higher crop yields, we're getting flowery tropical forests with rising tax gas levels as the most significant factor.
https://www.thegwpf.com/climate-change-leading-to-...
https://www.thegwpf.com/climate-change-leading-to-...
NASA proclaims a pleasing and appealing result: carbon dioxide (and nirtogen) greening the planet.
https://www.nasa.gov/feature/goddard/2016/carbon-d...
result: carbon dioxide (and nirtogen) greening the planet.https://www.nasa.gov/feature/goddard/2016/carbon-d...
turbobloke said:
NASA proclaims a pleasing and appealing result: carbon dioxide (and nirtogen) greening the planet.
https://www.nasa.gov/feature/goddard/2016/carbon-d...
I note a computer model was used, do we have to resort to those to understand what we can observe with our eyes, plus a bit of commonsense? result: carbon dioxide (and nirtogen) greening the planet.https://www.nasa.gov/feature/goddard/2016/carbon-d...
robinessex said:
turbobloke said:
NASA proclaims a pleasing and appealing result: carbon dioxide (and nirtogen) greening the planet.
https://www.nasa.gov/feature/goddard/2016/carbon-d...
I note a computer model was used, do we have to resort to those to understand what we can observe with our eyes, plus a bit of commonsense? result: carbon dioxide (and nirtogen) greening the planet.https://www.nasa.gov/feature/goddard/2016/carbon-d...
The point about modelling relates to quantifying matters giving contributions from e.g. CO2 and N2. The outputs described don't conflict with the qualitative observations but if the assumptions plugged into the models are changed then the outputs will change/
At least in this case as indicated above the outputs are in keeping with observations and nobody is forced into saying "the data don't matter" because the model output doesn't fit the observations as happaned very early on with inadequate CO2-coupled climate models.
From the very name CO2-coupled climate models, the modellers are assuming a significant CO2 effect and that's the problem. This assumption is faithfully reproduced in outputs, hence gigo. It leads to climate models being wrong and then wrongly adjusted, as pointed out n times by various people when looking at the consequences of Stephens et al - TOA radiative imbalance and the lack of any visible measurable anthropogenic forcing.
When amplified solar irradiance (Shaviv, using data) and solar eruptivity are included, the space left for carbon dioxide in the manner of VIP Seating gets plugged and it's not needed. This fits with the data as per Christy commenting on Hansen's original three scenarios but cannot be allowed to happen.
This is what Prof Christy had to say about Hansen's original scenarios A/B/C from 30 years ago against the numbers now available via UAH LTT temperature data.
& in particular
No need for carbon dioxide since 1990s = fits Humlum et al using data 1980-2011 and lack of causality to CO2
No need for carbon dioxide since 1990s = fits Stephens et al on TOA radiative imbalance and lack of visible measurable anthropogenic forcing
No need for carbon dioxide since 1990s = fits the current position regardless of causality-free UHI 'records'.
Prof Christy of UAH said:
So, the scenario that matches the observations most closely over the post-1980 interval is C. Hypothesis testing (using the VF method) shows that Scenarios A and B significantly over-predict the warming trend (even ignoring the El Nino and volcano effects). Emphasising the point here: Scenario A overstates CO2 and other greenhouse gas growth and rejects against the observations; Scenario B slightly understates CO2 growth, overstates methane and CFCs and zeroes-out other greenhouse gas growth, and it too significantly overstates the warming.
The trend in Scenario C does not reject against the observed data, in fact the two are about equal. But this is the one that left out the rise of all greenhouse gases after 2000. The observed CO2 level reached 368 ppm in 1999 and continued going up thereafter to 407 ppm in 2017. The Scenario C CO2 level reached 368 ppm in 2000 but remained fixed thereafter. Yet this scenario ended up with a warming trend most like the real world.
How can this be? Here is one possibility. Suppose Hansen had offered a Scenario D, in which greenhouse gases continue to rise, but after the 1990s they have very little effect on the climate. That would play out similarly in his model to Scenario C, and it would match the data.
No need for carbon dioxide since 1990s = fits the data The trend in Scenario C does not reject against the observed data, in fact the two are about equal. But this is the one that left out the rise of all greenhouse gases after 2000. The observed CO2 level reached 368 ppm in 1999 and continued going up thereafter to 407 ppm in 2017. The Scenario C CO2 level reached 368 ppm in 2000 but remained fixed thereafter. Yet this scenario ended up with a warming trend most like the real world.
How can this be? Here is one possibility. Suppose Hansen had offered a Scenario D, in which greenhouse gases continue to rise, but after the 1990s they have very little effect on the climate. That would play out similarly in his model to Scenario C, and it would match the data.
& in particular
No need for carbon dioxide since 1990s = fits Humlum et al using data 1980-2011 and lack of causality to CO2
No need for carbon dioxide since 1990s = fits Stephens et al on TOA radiative imbalance and lack of visible measurable anthropogenic forcing
No need for carbon dioxide since 1990s = fits the current position regardless of causality-free UHI 'records'.
turbobloke said:
From the very name CO2-coupled climate models, the modellers are assuming a significant CO2 effect and that's the problem. This assumption is faithfully reproduced in outputs, hence gigo. It leads to climate models being wrong and then wrongly adjusted, as pointed out n times by various people when looking at the consequences of Stephens et al - TOA radiative imbalance and the lack of any visible measurable anthropogenic forcing.
When amplified solar irradiance (Shaviv, using data) and solar eruptivity are included, the space left for carbon dioxide in the manner of VIP Seating gets plugged and it's not needed. This fits with the data as per Christy commenting on Hansen's original three scenarios but cannot be allowed to happen.
Still banging on with this like nobody has noticed your duality I see. When amplified solar irradiance (Shaviv, using data) and solar eruptivity are included, the space left for carbon dioxide in the manner of VIP Seating gets plugged and it's not needed. This fits with the data as per Christy commenting on Hansen's original three scenarios but cannot be allowed to happen.
You still haven't explained how there's a visible radiative imbalance for Shaviv's theory but is INvisible for anthropogenic (ghg) forcing.
Because you can't of course - there's either a visible imbalance or there isn't.
kerplunk said:
turbobloke said:
From the very name CO2-coupled climate models, the modellers are assuming a significant CO2 effect and that's the problem. This assumption is faithfully reproduced in outputs, hence gigo. It leads to climate models being wrong and then wrongly adjusted, as pointed out n times by various people when looking at the consequences of Stephens et al - TOA radiative imbalance and the lack of any visible measurable anthropogenic forcing.
When amplified solar irradiance (Shaviv, using data) and solar eruptivity are included, the space left for carbon dioxide in the manner of VIP Seating gets plugged and it's not needed. This fits with the data as per Christy commenting on Hansen's original three scenarios but cannot be allowed to happen.
Still banging on with this like nobody has noticed your duality I see. When amplified solar irradiance (Shaviv, using data) and solar eruptivity are included, the space left for carbon dioxide in the manner of VIP Seating gets plugged and it's not needed. This fits with the data as per Christy commenting on Hansen's original three scenarios but cannot be allowed to happen.
You still haven't explained how there's a visible radiative imbalance for Shaviv's theory but is INvisible for anthropogenic (ghg) forcing.
Because you can't of course - there's either a visible imbalance or there isn't.
 Good point, wonder if you'll get an answer this time.
LoonyTunes said:
kerplunk said:
turbobloke said:
From the very name CO2-coupled climate models, the modellers are assuming a significant CO2 effect and that's the problem. This assumption is faithfully reproduced in outputs, hence gigo. It leads to climate models being wrong and then wrongly adjusted, as pointed out n times by various people when looking at the consequences of Stephens et al - TOA radiative imbalance and the lack of any visible measurable anthropogenic forcing.
When amplified solar irradiance (Shaviv, using data) and solar eruptivity are included, the space left for carbon dioxide in the manner of VIP Seating gets plugged and it's not needed. This fits with the data as per Christy commenting on Hansen's original three scenarios but cannot be allowed to happen.
Still banging on with this like nobody has noticed your duality I see. When amplified solar irradiance (Shaviv, using data) and solar eruptivity are included, the space left for carbon dioxide in the manner of VIP Seating gets plugged and it's not needed. This fits with the data as per Christy commenting on Hansen's original three scenarios but cannot be allowed to happen.
You still haven't explained how there's a visible radiative imbalance for Shaviv's theory but is INvisible for anthropogenic (ghg) forcing.
Because you can't of course - there's either a visible imbalance or there isn't.
Good point, wonder if you'll get an answer this time.kerplunk said:
Still banging on with this like nobody has noticed your duality I see.
You still haven't explained how there's a visible radiative imbalance for Shaviv's theory but is INvisible for anthropogenic (ghg) forcing.
Because you can't of course - there's either a visible imbalance or there isn't.
Still banging on You still haven't explained how there's a visible radiative imbalance for Shaviv's theory but is INvisible for anthropogenic (ghg) forcing.
Because you can't of course - there's either a visible imbalance or there isn't.
translated means still posting data that you and others on the faith side have no answer to except the personal angle/abuse as above. What I can or cannot do is irrelevant, it's not about me. Clearly, what you can't do is put forward any credible empirical data to support your position.I have discussed that which you falsely claimed I haven't explained.
In a recent post - days not months - I discussed amplified solar irradiance variation / forcing based on data from IPCC AR4 SPM for solar irradiance in the context of Shaviv (obviously) and TOA radiative imbalance found by Stephens et al.
The amplification found from data by Shaviv will partly account for the absent solar eruptivity forcing in terms of the IPCC's incomplete considerations which reserve room for non-existent CO2 effects.
I also pointed out that the significantly larger IPCC forcing claimed for CO2 doesn't show up even within the overall error bars (you forgot or chose to ignore the point that there are other constraints beyond CERES instrumentation). In addition I indicated that date matters as well as data, since overall forcing and CO2 effects have declined from one report to the next. This has been over-compensated by feedback inflation (also not seen in the data),
I guess somebody at IPCC HQ has an ounce of shame that the relatively large forcing claimed is simply not seen, so it's been shrinking over time as CO2 impotence becomes clearer.
Your sloppy wording in the last part of your post " there's either a visible imbalance or there isn't" is not what was said and not what I posted in relaying information around Stephens et al.
What was posted is that there is no anthropogenic forcing visible / measurable in TOA radiative imbalance data.
Recall what the agw's brightest and best IPCC disciple has to say about how agw junkscience isn't coping at all in this context:
Trenberth said:
...we are no where close to knowing where energy is going or whether clouds are changing to make the planet brighter. We are not close to balancing the energy budget. The fact that we can not account for what is happening in the climate system makes any consideration of geoengineering quite hopeless.
My emphasis added. How come you've got any idea what's happening in the climate system from an agw perspective when its architect(s) cannot account for it? It's better to look at the data that do matter.Natural forcing / natural variation = present in the data on all timescales despite reasoning-by-assertion to the contrary.
Having gone from personal angle to obfuscation you still got nowhere and until you have new credible empirical data to support your view, that won't change.
kerplunk said:
I doubt he'll have anything good. He made a failed attempt to claim an inconsistancy between the 1.66W/m2 CO2 forcing (in AR4) and the 0.6W/m2 in Stephens et al, but he either doesn't understand what that 1.66W/m2 actually represents or he's trying to pull the wool over everyone's eyes.
Hi KP - quick question, given the error margins at TOA estimates are an order of magnitude greater than the 1.66 W/m2 AR4 CO2 forcing estimate what evidence is there that this forcing is not merely an artifact of using a precision in the calculations that the measurements themselves do not warrant?Stephens et al (2015) on TOA RI constraints beyond satellite instrumentation:
"although the uncertainty in TOA fluxes is also larger than the imbalance inferred from OHC, both Wong et al. (2006) and later Loeb et al. (2012) demonstrated that changes to TOA net fluxes generally track the changes in OHC. It is for this reason that the OHC serves as a constraint on the overall TOA balance"
"The planet continues to be out of balance with additional heat being added to it at the rate of 0.6±0.4 W/m^2 which is being taken up by the world's oceans."
Shaviv amplified solar irradiance forcing from IPCC AR4 and Shaviv is 0.6 W/m^2. The amplification mechanism is not specified but will include solar eruptivity elements (e.g. sunspots) that are part of irradiance considerations while excluding other elements (e.g. coronal holes) that are less / not.
OHC = ocean heat content, the method used by Shaviv to determine solar irradiance amplification
Edited by turbobloke on Wednesday 1st August 13:36
turbobloke said:
I also pointed out that the significantly larger IPCC forcing claimed for CO2 doesn't show up even within the overall error bars (you forgot or chose to ignore the point that there are other constraints beyond CERES instrumentation). In addition I indicated that date matters as well as data, since overall forcing and CO2 effects have declined from one report to the next. This has been over-compensated by feedback inflation (also not seen in the data),
I guess somebody at IPCC HQ has an ounce of shame that the relatively large forcing claimed is simply not seen, so it's been shrinking over time as CO2 impotence becomes clearer.
So despite me explaining to you already (days ago not months) that there would be no expectation of finding the full anthropgenic forcing since 1750 in current TOA radiative imbalance measurments (because the planet will have warmed up to redress the balance) you still don't get it.I guess somebody at IPCC HQ has an ounce of shame that the relatively large forcing claimed is simply not seen, so it's been shrinking over time as CO2 impotence becomes clearer.
btw you used the 1.66Wm2 figure for CO2 from AR4 when you should be using the total anthropogenic forcing which includes methane and CFCs etc, minus a bit for aerosol emissions. That figure from AR5 is 2.3Wm2 - an even BIGGER inconsistancy with Stephens et al according to your flawed logic, but as above you apparently don't understand straightforward thermodynamics.
I've not seen a theoretical consideration of what the TOA radiative imbalance should be at any one time, but it would be somewhere south of 2.3 and somewhere north of zero. I'd expect 'most' of the forcing since 1750 has been used up already so the 0.6W/m2 in Stephens et al doesn't sound particularly out of the way to me.
kerplunk said:
turbobloke said:
I also pointed out that the significantly larger IPCC forcing claimed for CO2 doesn't show up even within the overall error bars (you forgot or chose to ignore the point that there are other constraints beyond CERES instrumentation). In addition I indicated that date matters as well as data, since overall forcing and CO2 effects have declined from one report to the next. This has been over-compensated by feedback inflation (also not seen in the data),
I guess somebody at IPCC HQ has an ounce of shame that the relatively large forcing claimed is simply not seen, so it's been shrinking over time as CO2 impotence becomes clearer.
So despite me explaining to you already (days ago not months) that there would be no expectation of finding the full anthropgenic forcing since 1750 in current TOA radiative imbalance measurments (because the planet will have warmed up to redress the balance) you still don't get it.I guess somebody at IPCC HQ has an ounce of shame that the relatively large forcing claimed is simply not seen, so it's been shrinking over time as CO2 impotence becomes clearer.
btw you used the 1.66Wm2 figure for CO2 from AR4 when you should be using the total anthropogenic forcing which includes methane and CFCs etc, minus a bit for aerosol emissions. That figure from AR5 is 2.3Wm2 - an even BIGGER inconsistancy with Stephens et al according to your flawed logic, but as above you apparently don't understand straightforward thermodynamics.
I've not seen a theoretical consideration of what the TOA radiative imbalance should be at any one time, but it would be somewhere south of 2.3 and somewhere north of zero. I'd expect 'most' of the forcing since 1750 has been used up already so the 0.6W/m2 in Stephens et al doesn't sound particularly out of the way to me.

Jinx said:
kerplunk said:
I doubt he'll have anything good. He made a failed attempt to claim an inconsistancy between the 1.66W/m2 CO2 forcing (in AR4) and the 0.6W/m2 in Stephens et al, but he either doesn't understand what that 1.66W/m2 actually represents or he's trying to pull the wool over everyone's eyes.
Hi KP - quick question, given the error margins at TOA estimates are an order of magnitude greater than the 1.66 W/m2 AR4 CO2 forcing estimate what evidence is there that this forcing is not merely an artifact of using a precision in the calculations that the measurements themselves do not warrant?dickymint said:
kerplunk said:
turbobloke said:
I also pointed out that the significantly larger IPCC forcing claimed for CO2 doesn't show up even within the overall error bars (you forgot or chose to ignore the point that there are other constraints beyond CERES instrumentation). In addition I indicated that date matters as well as data, since overall forcing and CO2 effects have declined from one report to the next. This has been over-compensated by feedback inflation (also not seen in the data),
I guess somebody at IPCC HQ has an ounce of shame that the relatively large forcing claimed is simply not seen, so it's been shrinking over time as CO2 impotence becomes clearer.
So despite me explaining to you already (days ago not months) that there would be no expectation of finding the full anthropgenic forcing since 1750 in current TOA radiative imbalance measurments (because the planet will have warmed up to redress the balance) you still don't get it.I guess somebody at IPCC HQ has an ounce of shame that the relatively large forcing claimed is simply not seen, so it's been shrinking over time as CO2 impotence becomes clearer.
btw you used the 1.66Wm2 figure for CO2 from AR4 when you should be using the total anthropogenic forcing which includes methane and CFCs etc, minus a bit for aerosol emissions. That figure from AR5 is 2.3Wm2 - an even BIGGER inconsistancy with Stephens et al according to your flawed logic, but as above you apparently don't understand straightforward thermodynamics.
I've not seen a theoretical consideration of what the TOA radiative imbalance should be at any one time, but it would be somewhere south of 2.3 and somewhere north of zero. I'd expect 'most' of the forcing since 1750 has been used up already so the 0.6W/m2 in Stephens et al doesn't sound particularly out of the way to me.
Gassing Station | News, Politics & Economics | Top of Page | What's New | My Stuff