Coronavirus - Data Analysis Thread
Discussion


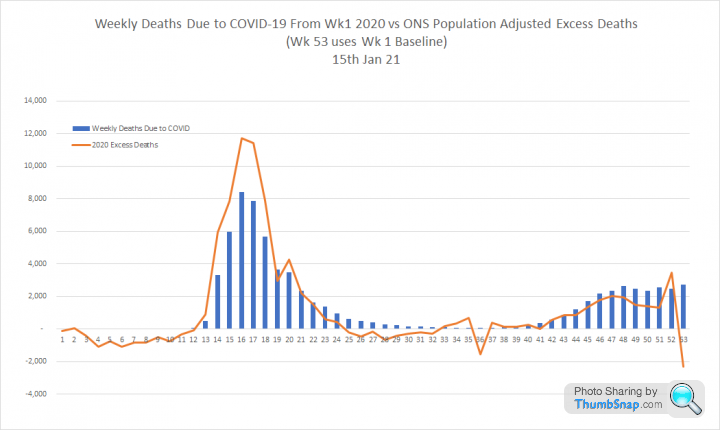
I have updated my excess deaths graphs to capture the full 2020 impact.
Confusingly, there are 53 weeks in the ONS data for 2020, which run from the 28th Dec 2019 to the 1st Jan 2021. This causes a bit of a problem as there is no corresponding wk 53 in the 5 year average. The ONS have used wk 52, which seems an odd decision as it doubles up the impact of the double bank holiday in 2020 which results in a false spike in excess deaths.
I have decided to adopt the same approach as the CMI:
1. Wk 53 uses the Wk 1 baseline
2. 2021 will use 2015 to 2019 as a baseline so the 5 year average does not include the 2020 pandemic impacts
This approach makes sense when you look at the graphs as it reverses the wk 52 false spike.
Graphs for todays data:
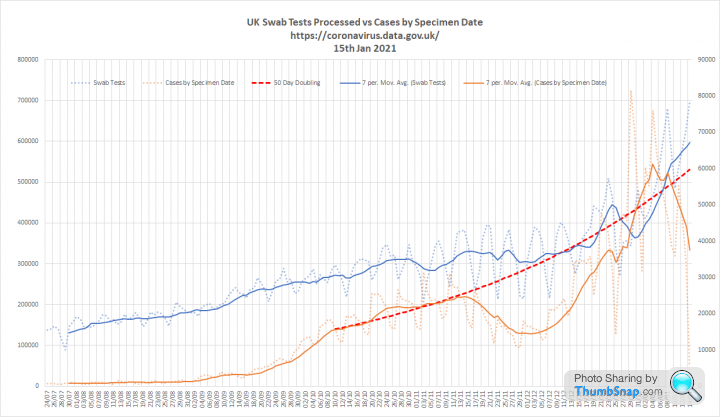
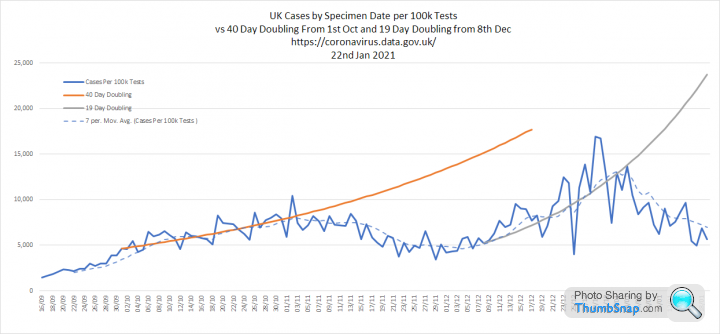
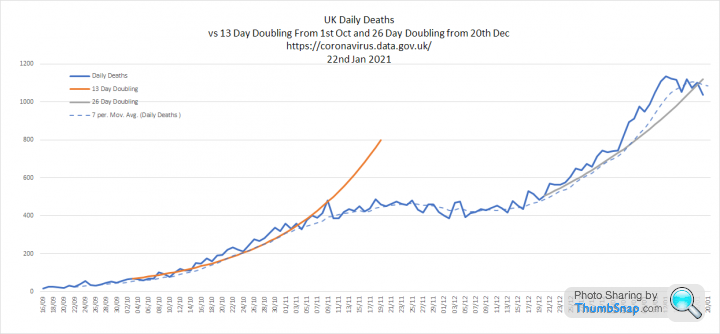
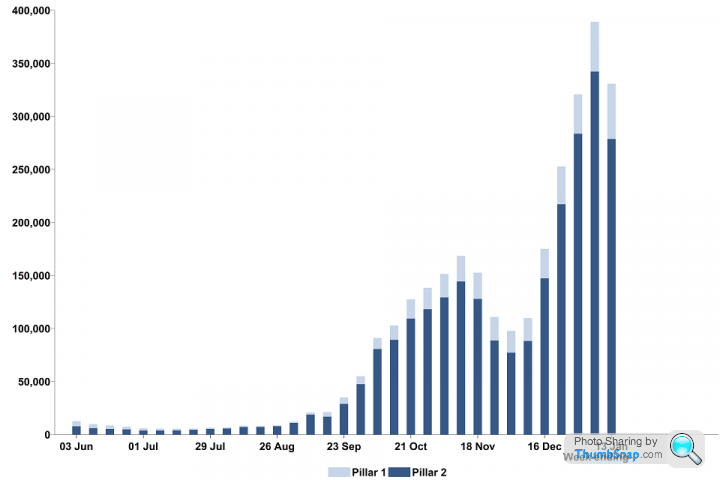
1. Tests and cases. Cases have been falling steadily for long enough to be confident it is not down to reporting lag. We continue to increase testing and are nudging 700k test processed per day, which is simply when you consider it was 10 times lower in the summer. The 50 day doubling that we were following in Oct aligns pretty closely with the peak:
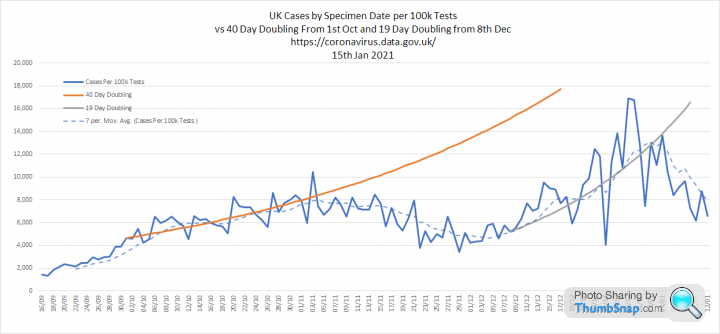
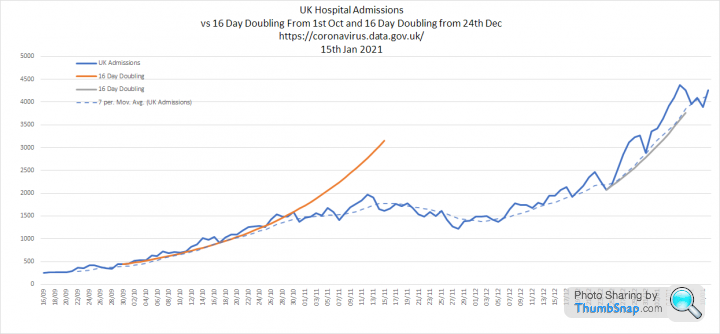
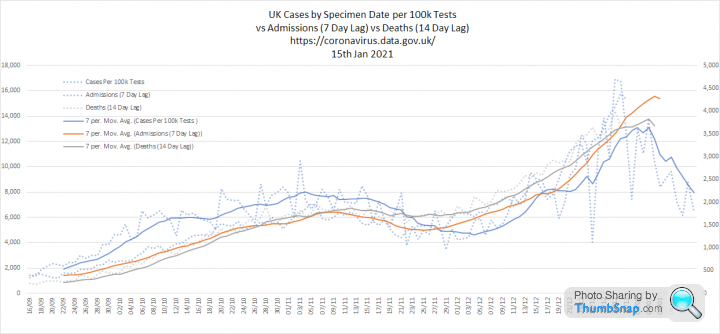
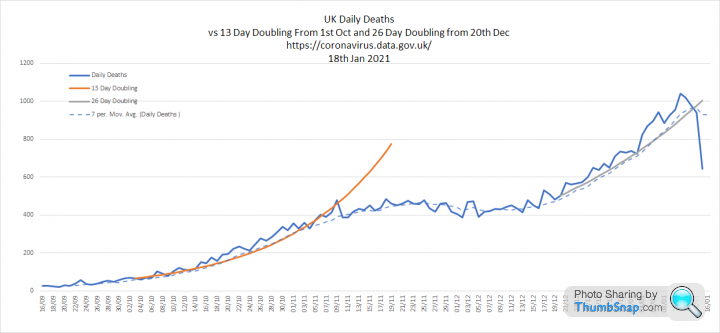
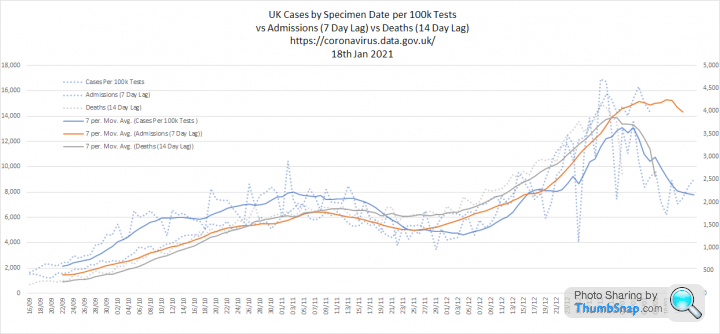
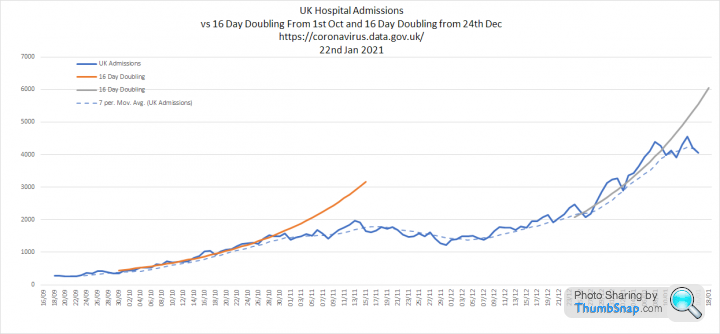
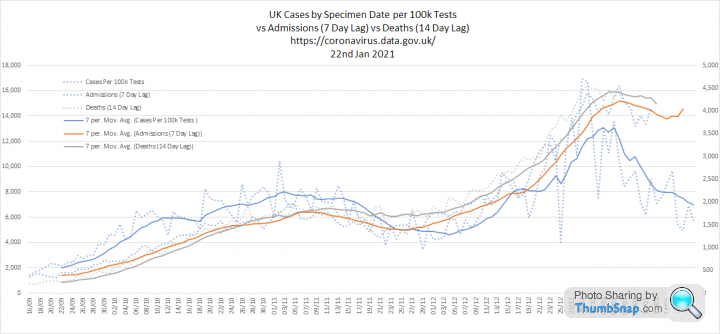
2. Cases per 100k tests, admissions and deaths. Cases are clearly reducing and after correction for testing volume are back to early Nov levels. Admissions were doubling every 16 days, similar to Oct. Deaths are doubling every 26 days.
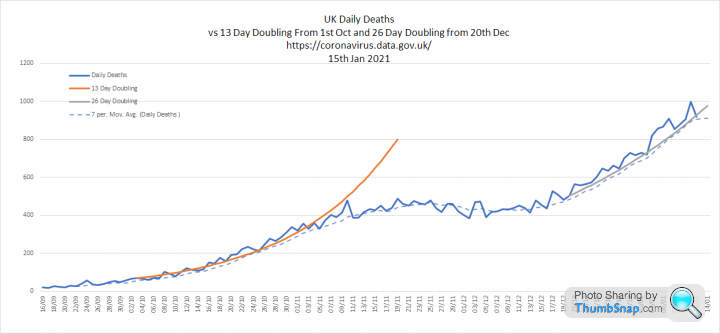
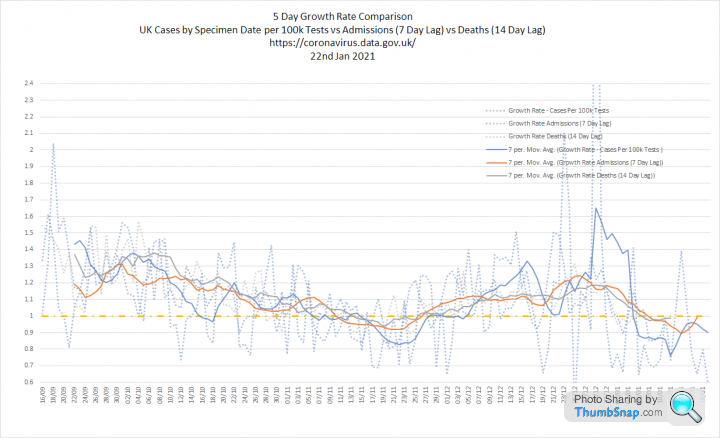
3. All three overlaid with growth rates. Suggests Rt for cases is now below 1

1. Tests and cases. Cases have been falling steadily for long enough to be confident it is not down to reporting lag. We continue to increase testing and are nudging 700k test processed per day, which is simply when you consider it was 10 times lower in the summer. The 50 day doubling that we were following in Oct aligns pretty closely with the peak:
2. Cases per 100k tests, admissions and deaths. Cases are clearly reducing and after correction for testing volume are back to early Nov levels. Admissions were doubling every 16 days, similar to Oct. Deaths are doubling every 26 days.
3. All three overlaid with growth rates. Suggests Rt for cases is now below 1
Elysium said:
I have updated my excess deaths graphs to capture the full 2020 impact.
Confusingly, there are 53 weeks in the ONS data for 2020, which run from the 28th Dec 2019 to the 1st Jan 2021. This causes a bit of a problem as there is no corresponding wk 53 in the 5 year average. The ONS have used wk 52, which seems an odd decision as it doubles up the impact of the double bank holiday in 2020 which results in a false spike in excess deaths.
I have decided to adopt the same approach as the CMI:
1. Wk 53 uses the Wk 1 baseline
2. 2021 will use 2015 to 2019 as a baseline so the 5 year average does not include the 2020 pandemic impacts
This approach makes sense when you look at the graphs as it reverses the wk 52 false spike.
Interesting to see deaths low vs 50-60k of +ive cases (not on table) especially vs March 2020. Does this suggest the new variant is "weaker" which we never hear in the News?Confusingly, there are 53 weeks in the ONS data for 2020, which run from the 28th Dec 2019 to the 1st Jan 2021. This causes a bit of a problem as there is no corresponding wk 53 in the 5 year average. The ONS have used wk 52, which seems an odd decision as it doubles up the impact of the double bank holiday in 2020 which results in a false spike in excess deaths.
I have decided to adopt the same approach as the CMI:
1. Wk 53 uses the Wk 1 baseline
2. 2021 will use 2015 to 2019 as a baseline so the 5 year average does not include the 2020 pandemic impacts
This approach makes sense when you look at the graphs as it reverses the wk 52 false spike.
TX.
Terminator X said:
Elysium said:
I have updated my excess deaths graphs to capture the full 2020 impact.
Confusingly, there are 53 weeks in the ONS data for 2020, which run from the 28th Dec 2019 to the 1st Jan 2021. This causes a bit of a problem as there is no corresponding wk 53 in the 5 year average. The ONS have used wk 52, which seems an odd decision as it doubles up the impact of the double bank holiday in 2020 which results in a false spike in excess deaths.
I have decided to adopt the same approach as the CMI:
1. Wk 53 uses the Wk 1 baseline
2. 2021 will use 2015 to 2019 as a baseline so the 5 year average does not include the 2020 pandemic impacts
This approach makes sense when you look at the graphs as it reverses the wk 52 false spike.
Interesting to see deaths low vs 50-60k of +ive cases (not on table) especially vs March 2020. Does this suggest the new variant is "weaker" which we never hear in the News?Confusingly, there are 53 weeks in the ONS data for 2020, which run from the 28th Dec 2019 to the 1st Jan 2021. This causes a bit of a problem as there is no corresponding wk 53 in the 5 year average. The ONS have used wk 52, which seems an odd decision as it doubles up the impact of the double bank holiday in 2020 which results in a false spike in excess deaths.
I have decided to adopt the same approach as the CMI:
1. Wk 53 uses the Wk 1 baseline
2. 2021 will use 2015 to 2019 as a baseline so the 5 year average does not include the 2020 pandemic impacts
This approach makes sense when you look at the graphs as it reverses the wk 52 false spike.
TX.
Updated data for today:
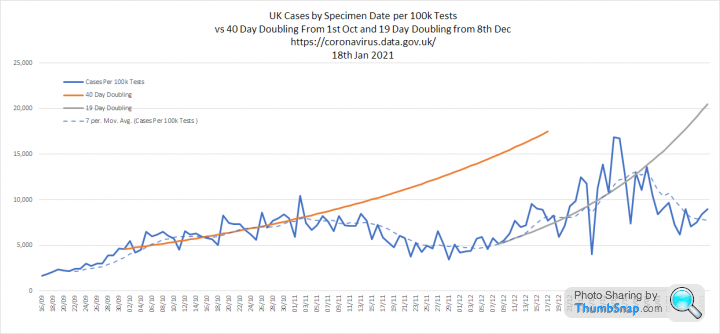
1. Cases and tests. Cases are definitely dropping, despite increasing testing. However the last few days will lag.

2. Cases per 100k tests, admissions and deaths. There is now a clear drop in test positivity around the New Year. Admissions have slowed, but its not translating into quite the same reduction. Peak daily deaths are now 1,041 on the 11th Jan. Hopefully we will not see this figure rise much further:
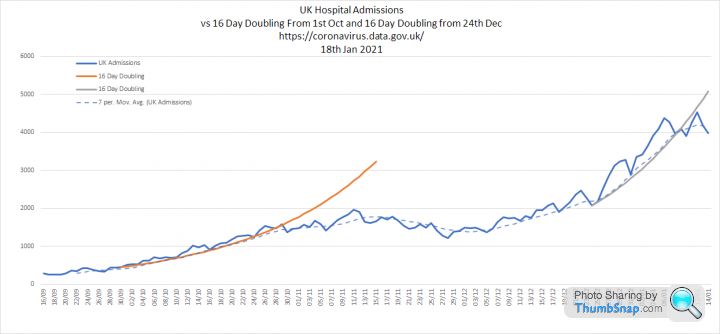
3. Three metrics overlaid and growth rates. The main thing to note here is that admissions are levelling off, rather than falling in line with cases.

1. Cases and tests. Cases are definitely dropping, despite increasing testing. However the last few days will lag.
2. Cases per 100k tests, admissions and deaths. There is now a clear drop in test positivity around the New Year. Admissions have slowed, but its not translating into quite the same reduction. Peak daily deaths are now 1,041 on the 11th Jan. Hopefully we will not see this figure rise much further:
3. Three metrics overlaid and growth rates. The main thing to note here is that admissions are levelling off, rather than falling in line with cases.
Edited by Elysium on Monday 18th January 20:18
Todays numbers:
1. Tests and cases. Cases continue to fall as testing increases.

2. Cases per 100k tests, Admissions and Deaths. The reduction in cases per 100k tests is very obvious, but admissions are still staying high. There are also signs that deaths accelerated slightly around New Year.
3. All three overlaid with growth rates. Admissions and deaths are not dropping as quickly as I expected in response to the reduction in positive cases.
1. Tests and cases. Cases continue to fall as testing increases.
2. Cases per 100k tests, Admissions and Deaths. The reduction in cases per 100k tests is very obvious, but admissions are still staying high. There are also signs that deaths accelerated slightly around New Year.
3. All three overlaid with growth rates. Admissions and deaths are not dropping as quickly as I expected in response to the reduction in positive cases.
Elysium said:
3. All three overlaid with growth rates. Admissions and deaths are not dropping as quickly as I expected in response to the reduction in positive cases.
Odd.I would have expected there to be a 1-2 week 'lag' from the Cases curve to the Admissions curve, and the same again from Admissions to Deaths.
...but I'm not really seeing that in either case.
In the first case it possibly suggests that a lot of serious cases aren't being diagnosed until at/just before the point of admission.
In the second case it possibly suggests that hospitals HAVE reached capacity, and the in-hospital fatality rate is now increasing due to lack of suffient resources.
Other ideas?
havoc said:
Elysium said:
3. All three overlaid with growth rates. Admissions and deaths are not dropping as quickly as I expected in response to the reduction in positive cases.
Odd.I would have expected there to be a 1-2 week 'lag' from the Cases curve to the Admissions curve, and the same again from Admissions to Deaths.
...but I'm not really seeing that in either case.
In the first case it possibly suggests that a lot of serious cases aren't being diagnosed until at/just before the point of admission.
In the second case it possibly suggests that hospitals HAVE reached capacity, and the in-hospital fatality rate is now increasing due to lack of suffient resources.
Other ideas?
Cases are in real time
Admissions are lagged 7 days - so numbers from 21st Jan are shown against 14th Jan
Deaths are lagged 14 days so numbers on the 21st Jan are shown against 7th Jan
The idea is that admissions and deaths appear next to the cases that caused them, so the three curves should move in relative unison.
That has been broadly the case until now. I have cast this one back a bit further to 1st August:

havoc said:
Elysium said:
3. All three overlaid with growth rates. Admissions and deaths are not dropping as quickly as I expected in response to the reduction in positive cases.
Odd.I would have expected there to be a 1-2 week 'lag' from the Cases curve to the Admissions curve, and the same again from Admissions to Deaths.
...but I'm not really seeing that in either case.
In the first case it possibly suggests that a lot of serious cases aren't being diagnosed until at/just before the point of admission.
In the second case it possibly suggests that hospitals HAVE reached capacity, and the in-hospital fatality rate is now increasing due to lack of suffient resources.
Other ideas?

Lord.Vader said:
Is there data that shows death from COVID with / without underlying issues against age?
I did see it somewhere but I seem to remember it was split by NHS trust, or potentially released by some individual trusts.
Afaik the %age without underlying issues is tiny, I'd be interested to see the data too.I did see it somewhere but I seem to remember it was split by NHS trust, or potentially released by some individual trusts.
TX.
Terminator X said:
Lord.Vader said:
Is there data that shows death from COVID with / without underlying issues against age?
I did see it somewhere but I seem to remember it was split by NHS trust, or potentially released by some individual trusts.
Afaik the %age without underlying issues is tiny, I'd be interested to see the data too.I did see it somewhere but I seem to remember it was split by NHS trust, or potentially released by some individual trusts.
TX.
https://www.england.nhs.uk/statistics/wp-content/u...
56,266 out of 58,712 had at least one pre existing condition.
A total of 59 'healthy' under 40's have died during the whole pandemic and I'd wager the majority of those were obese.
What interests me is the 28 day measure... deaths ‘with’ COVID. Have any of the Gov scientists explained the science behind this? Constant apocryphal tales of someone testing positive then getting hit by a bus and are therefore COVID deaths... How do the stats deal with this?
-Genuine interest not making a point. Frontline emergency service worker and the whole thing scares the s t out of me!
-Genuine interest not making a point. Frontline emergency service worker and the whole thing scares the s
t out of me!GMT13 said:
Terminator X said:
Lord.Vader said:
Is there data that shows death from COVID with / without underlying issues against age?
I did see it somewhere but I seem to remember it was split by NHS trust, or potentially released by some individual trusts.
Afaik the %age without underlying issues is tiny, I'd be interested to see the data too.I did see it somewhere but I seem to remember it was split by NHS trust, or potentially released by some individual trusts.
TX.
https://www.england.nhs.uk/statistics/wp-content/u...
56,266 out of 58,712 had at least one pre existing condition.
A total of 59 'healthy' under 40's have died during the whole pandemic and I'd wager the majority of those were obese.
Fully agree, iirc around December last year my mum (NHS Practise Manager) said all of their patients who had died from covid had preexisting conditions.
59 of how many infections? 1M+?
99+% survivability, funny how this data isn’t being communicated on the news.
I can’t remember the usernames of the two posts, I assume, being facetious in what they’ve posted with respect to pre-existing conditions but just because the data doesn’t support your continuous hysteric message in relation to the ‘pandemic’, it doesn’t make the data any less real or relevant.
I gave up following the news re CV and rules months ago, the risk is absolutely non-existent for me, I don’t visit those deemed to be at risk, so I’ve just cracked on with life.
Gassing Station | News, Politics & Economics | Top of Page | What's New | My Stuff