Coronavirus - Data Analysis Thread
Discussion


I'm not sure if this date of Israel booster roll-out is correct?
But if it is...
https://twitter.com/MrsAndySellers/status/14359486...

But if it is...
https://twitter.com/MrsAndySellers/status/14359486...

RSTurboPaul said:
I'm not sure if this date on Israel booster roll out is correct?
But if it is...
https://twitter.com/MrsAndySellers/status/14359486...
Not convinced that association hangs together. But if it is...
https://twitter.com/MrsAndySellers/status/14359486...
Cases were increasing prior to the commencement of the booster programme. Deaths appear to correlate due to a lag, but on closer inspection are not that different to the UK:


My guess is that Israel has a bit less infection derived immunity due to milder 1st and second waves.

scenario8 said:
“How far ‘under 65’?” might be a nice question to have answered. Sadly that data appears to be unavailable.
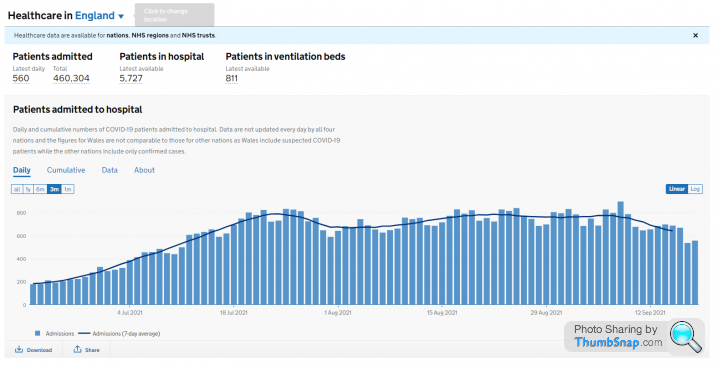
English data. Comparing 2nd wave hospitalisations to now. (Some other good stuff on his profile, he's Planet Normal's (Telegraph podcast / youtube channel) NHS insider )https://twitter.com/george_stats/status/1433339343...

Update on UK figures. Monday is not the best day to do it, but I won't get another chance:
1. Testing and Cases
There has been a clear boost in testing, probably due to schools returning, which is having an impact on cases:

2. Cases per 100k tests is looking much flatter and the idea that the increases in cases are linked to testing seems to be confirmed by the CFR which remains pretty flat. 0.37% in the last two weeks or 37 deaths per 10,000 cases:

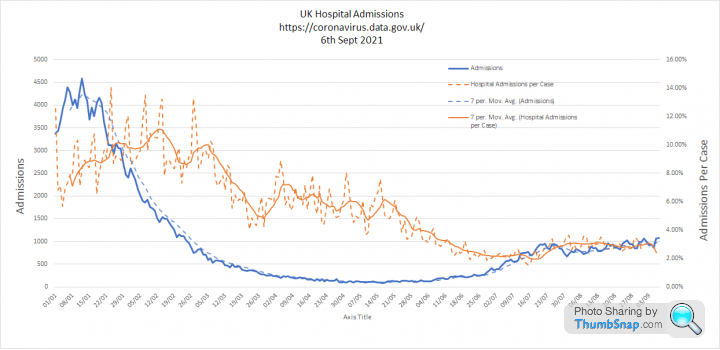
Admissions per case also very flat at 2.87% in the last two weeks or 287 admissions per 10,000 cases:
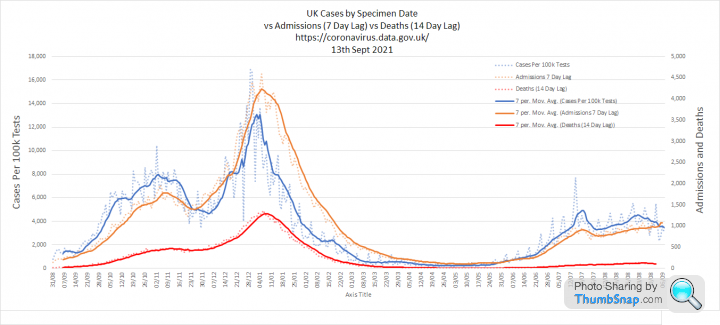
3. This shows how the relationship between cases, admissions and deaths has changed since the second wave. We are in this much better position despite having had very little few restrictions since 19th July:
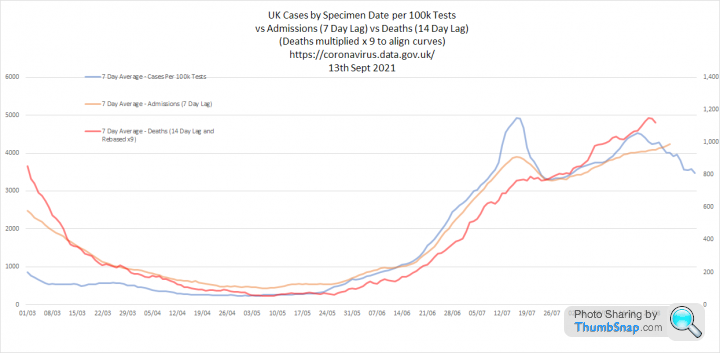
This alternative view zooms in on the recent period and rebased the deaths x9 so they align with the other curves. The three metrics clearly remain very closely aligned. It is simply that the proportion of cases being admitted to hospital or dying is dramatically lower than before:
1. Testing and Cases
There has been a clear boost in testing, probably due to schools returning, which is having an impact on cases:
2. Cases per 100k tests is looking much flatter and the idea that the increases in cases are linked to testing seems to be confirmed by the CFR which remains pretty flat. 0.37% in the last two weeks or 37 deaths per 10,000 cases:
Admissions per case also very flat at 2.87% in the last two weeks or 287 admissions per 10,000 cases:
3. This shows how the relationship between cases, admissions and deaths has changed since the second wave. We are in this much better position despite having had very little few restrictions since 19th July:
This alternative view zooms in on the recent period and rebased the deaths x9 so they align with the other curves. The three metrics clearly remain very closely aligned. It is simply that the proportion of cases being admitted to hospital or dying is dramatically lower than before:
Elysium, have you followed this guys work on the numbers, Andrew Mather? He's put together a presentation here based on ONS numbers with some anti-censoring humour in there too: https://peerlessreads.s3.us-east-2.amazonaws.com/C...
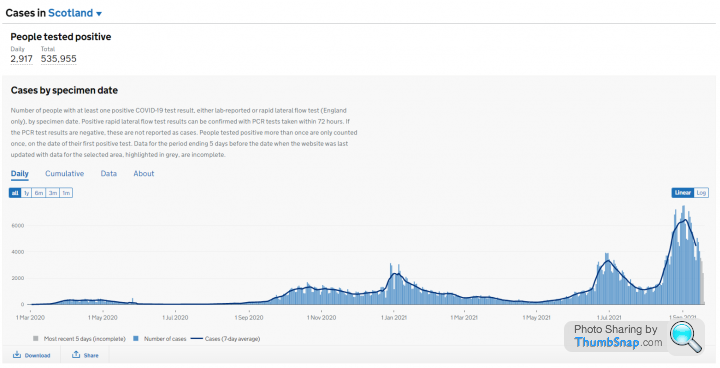
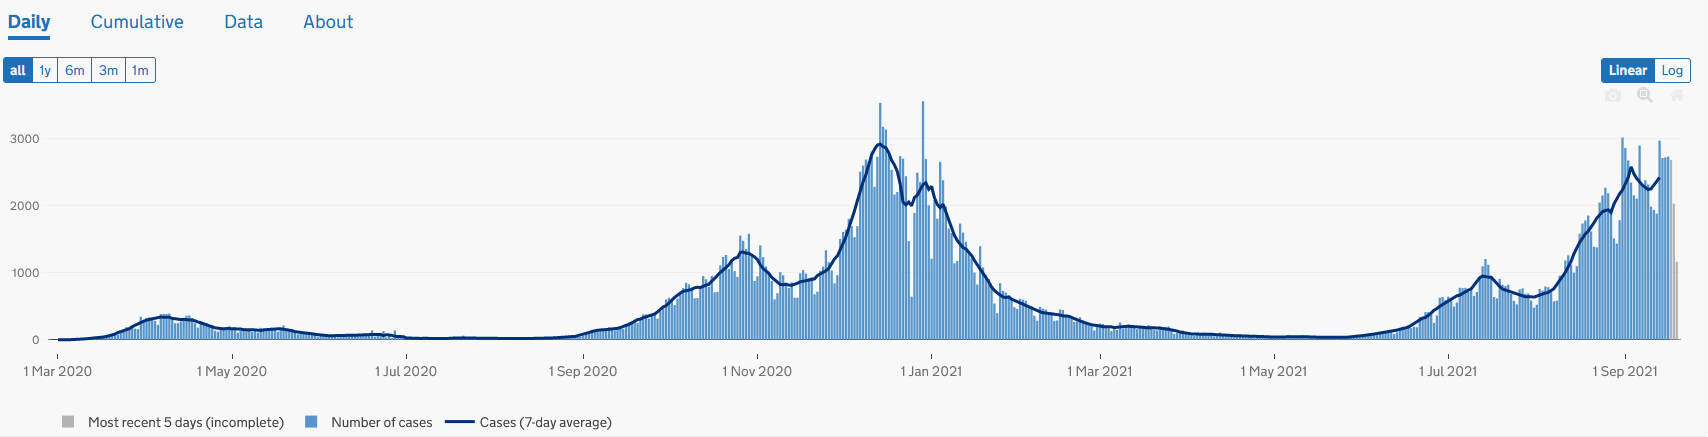
English cases have been flat for weeks . Recent increases have been focused largely in Scotland, which somehow seems to have had it's first substantial wave of COVID. This is calming down and cases in the UK as a whole are falling.
Good time to look at the numbers:
1. Cases peaked about a week ago, so this is a definite signal rather than reporting lag.

2. Cases per 100k tests looking interesting. Now back to late July levels. Looks like we did not need restrictions after all. The CFR is falling back and Admissions per Case is also falling:


3. After correcting for testing cases are still resulting in much lower admissions and deaths than in the winter wave. The second graph rebases the death numbers to align all three curves. These three metrics continue to track each other very closely. Just with a paradigm shift in the proportion of severe illness and death.


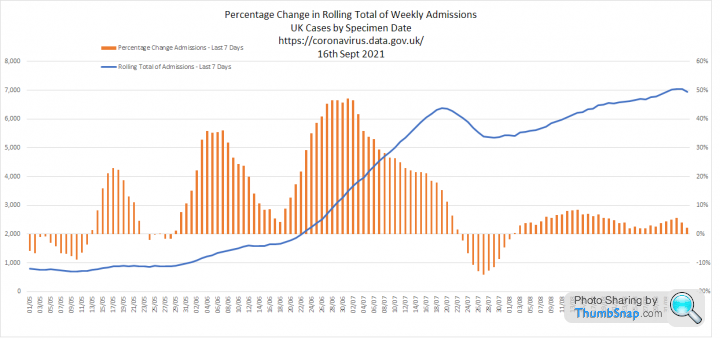
4. These two graphs look at growth. The rolling 7 day total of cases per 100k tests is now back at pre-freedom day / early July levels. I think this is significant. The orange bars below the line indicate that case numbers are falling. Same story with admissions, just lagged by a week.

Good time to look at the numbers:
1. Cases peaked about a week ago, so this is a definite signal rather than reporting lag.
2. Cases per 100k tests looking interesting. Now back to late July levels. Looks like we did not need restrictions after all. The CFR is falling back and Admissions per Case is also falling:
3. After correcting for testing cases are still resulting in much lower admissions and deaths than in the winter wave. The second graph rebases the death numbers to align all three curves. These three metrics continue to track each other very closely. Just with a paradigm shift in the proportion of severe illness and death.
4. These two graphs look at growth. The rolling 7 day total of cases per 100k tests is now back at pre-freedom day / early July levels. I think this is significant. The orange bars below the line indicate that case numbers are falling. Same story with admissions, just lagged by a week.


b0rk said:
Elysium said:
Any thoughts on why it’s flat in England but not in Scotland? Vanden Saab said:
b0rk said:
More people in England have had it already so it is just Scotland catching up. remember lockdowns etc. only delay the inevitable... everybody will catch it at some point... 
Vanden Saab said:
More people in England have had it already so it is just Scotland catching up. remember lockdowns etc. only delay the inevitable... everybody will catch it at some point...
I was pondering that but then there is Wales which has an autumn and spring curve not too dissimilar to England yet is far from flat post July. Harder and longer measures than England yet a worse situation (for cases) currently. Almost as if the restrictions aren't really that helpful long term. 
Gassing Station | News, Politics & Economics | Top of Page | What's New | My Stuff