Coronavirus - Data Analysis Thread
Discussion


Terminator X said:
Pretty much no one under 50 dies from it and the ones that do mostly have "something" wrong with them.
And that makes it less of an issue for society does it? FFS, the attitude amongst some of PH is quite disturbing..."Oh, he had high blood pressure...tough break, eh?"
"Oh, she was fat...she should have exercised!"
"He had a minor autoimmune condition and now he's got Long Covid and hasn't been in work for 6 months...they're going to medically retire him at 35."
"Turns out she had an undiagnosed heart murmur...lasted 3 days in ICU before Covid got her. Oh well, at least I'm OK Jack..."
"His kids brought it home from school...he spent two weeks in ICU, he's not been the same since"
"Her employer insisted she come into work...she needed to pay the bills, thought her diabetes was under control."
Terminator X said:
^^ it is fact that 4 of 5 covid deaths are aged 70+
Pretty much no one under 50 dies from it and the ones that do mostly have "something" wrong with them.
TX.
22.3 million in the UK have "pre existing" conditions, but how many are over 70? Near 9 mil are registered disabled, again, how many over 70? Pretty much no one under 50 dies from it and the ones that do mostly have "something" wrong with them.
TX.
It is easy to write such people off to Covid if you are not one of them but the reality is that about 1 in 3 people do have "something" wrong with them! And the powers that be know that.
The majority of the 22.3 million btw are employed and work for a living too.
Elysium said:
We finally got a decent update from PHE today after the Easter break:
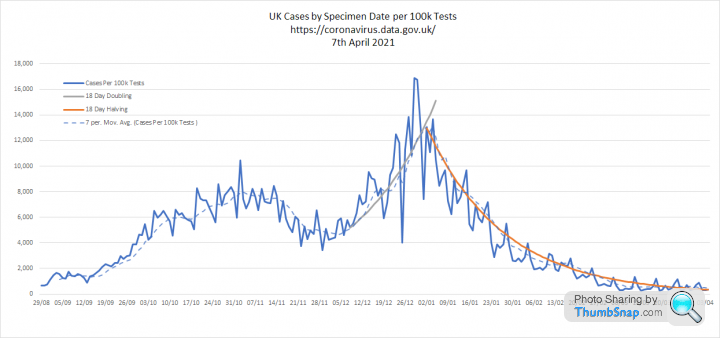
1. Tests and cases. Testing volumes have really dropped down and cases are dropping back to the dotted red line, indicating an 18 day halving time since New Year. I am guessing that compliance with the twice weekly school testing, which was intended to continue through the holidays has fallen substantially. This is probably a good indicator of what will happen with the proposed extension of LFD to the population as a whole:

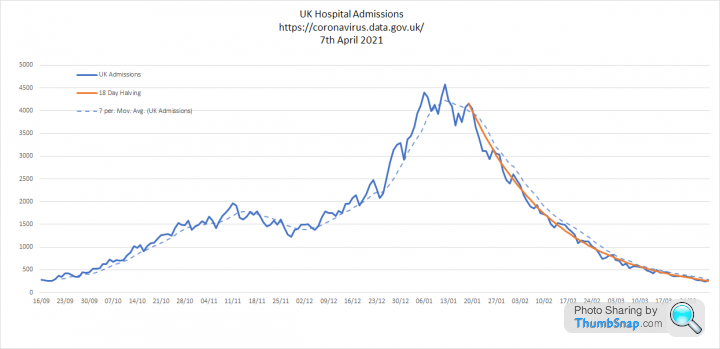
2. Key metrics. Cases per 100k tests and admissions are still following the long 18 day halving. I would have liked to see some acceleration here to signal a growing level of protection due to vaccination, but to me this seems to be 'on rails'. Deaths fell faster initially, but now also seem to be tracking the same line. We have been below 100 deaths per day since 9th March. Almost a month now:

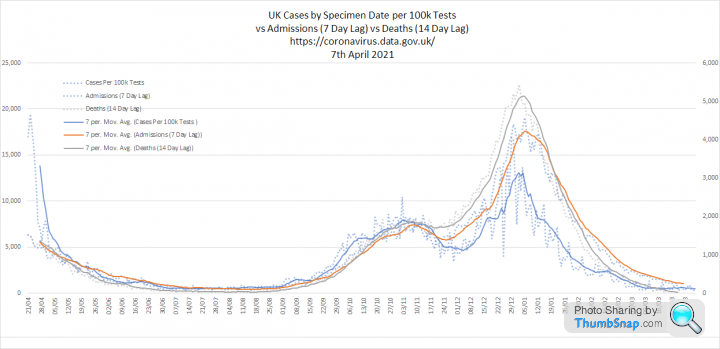
3. All three metrics overlaid. My simple assumption of a 7 day lag between cases and admissions and a 14 day lag between cases and deaths is still checking out. This also shows how admissions and deaths are moving in lockstep now. Again with that 18 day halving:
Elysium -1. Tests and cases. Testing volumes have really dropped down and cases are dropping back to the dotted red line, indicating an 18 day halving time since New Year. I am guessing that compliance with the twice weekly school testing, which was intended to continue through the holidays has fallen substantially. This is probably a good indicator of what will happen with the proposed extension of LFD to the population as a whole:
2. Key metrics. Cases per 100k tests and admissions are still following the long 18 day halving. I would have liked to see some acceleration here to signal a growing level of protection due to vaccination, but to me this seems to be 'on rails'. Deaths fell faster initially, but now also seem to be tracking the same line. We have been below 100 deaths per day since 9th March. Almost a month now:
3. All three metrics overlaid. My simple assumption of a 7 day lag between cases and admissions and a 14 day lag between cases and deaths is still checking out. This also shows how admissions and deaths are moving in lockstep now. Again with that 18 day halving:
Apologies, this is a super-lazy post as I have to get to bed!
What was the 'half-life' of the 'first' wave's rate of decline?
Was it also 18 days?
I'm trying to ponder on if vaccination would make any difference to the infection rate increases/decreases but it's late and my brain is failing me.
poo at Paul's said:
Terminator X said:
^^ it is fact that 4 of 5 covid deaths are aged 70+
Pretty much no one under 50 dies from it and the ones that do mostly have "something" wrong with them.
TX.
22.3 million in the UK have "pre existing" conditions, but how many are over 70? Near 9 mil are registered disabled, again, how many over 70? Pretty much no one under 50 dies from it and the ones that do mostly have "something" wrong with them.
TX.
It is easy to write such people off to Covid if you are not one of them but the reality is that about 1 in 3 people do have "something" wrong with them! And the powers that be know that.
The majority of the 22.3 million btw are employed and work for a living too.
About 550k people in the UK die every year as unfortunate as that is. I'd hazard a guess that the vast majority of them are 70+ as well? The older you are the more likely you are to die of something. I'm no Professor of Maths however I suspect that the odds of not dying of anything are low.
Interesting to see flu and pneumonia deaths over the last few years. Not zero of course yet people seem to want zero Covid deaths (ONS data).
Year - deaths per year - deaths from flue / pneumonia
2015 528k 29k
2016 523k 27k
2017 532k 27k
2018 540k 29k
2019 529k 26k
TX.
Terminator X said:
As I say pretty much no one under 50 though dies of Covid regardless of your 22.3m. 4 of 5 (so 80%) of deaths are 70+ again despite your 22.3m.
About 550k people in the UK die every year as unfortunate as that is. I'd hazard a guess that the vast majority of them are 70+ as well? The older you are the more likely you are to die of something. I'm no Professor of Maths however I suspect that the odds of not dying of anything are low.
Interesting to see flu and pneumonia deaths over the last few years. Not zero of course yet people seem to want zero Covid deaths (ONS data).
Year - deaths per year - deaths from flue / pneumonia
2015 528k 29k
2016 523k 27k
2017 532k 27k
2018 540k 29k
2019 529k 26k
TX.
This is the “ CORONAVIRUS - DATA ANALYSIS THREAD”.About 550k people in the UK die every year as unfortunate as that is. I'd hazard a guess that the vast majority of them are 70+ as well? The older you are the more likely you are to die of something. I'm no Professor of Maths however I suspect that the odds of not dying of anything are low.
Interesting to see flu and pneumonia deaths over the last few years. Not zero of course yet people seem to want zero Covid deaths (ONS data).
Year - deaths per year - deaths from flue / pneumonia
2015 528k 29k
2016 523k 27k
2017 532k 27k
2018 540k 29k
2019 529k 26k
TX.
Could you post your stuff elsewhere in a suitable thread, or start a new one?
Thanks.
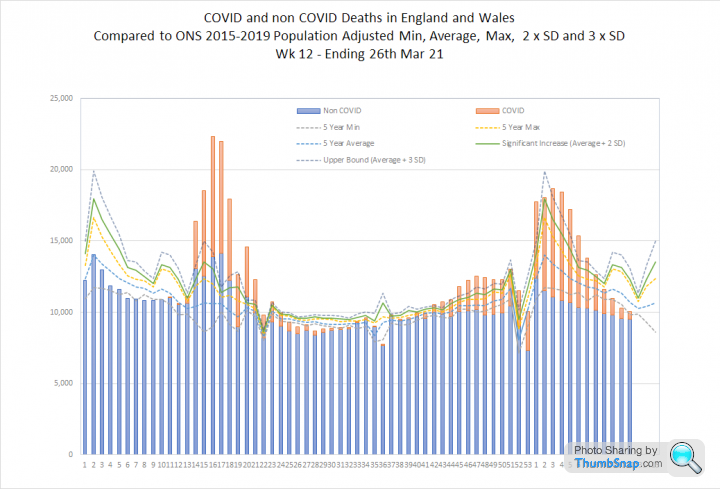
ONS deaths data is now out for week 12 ending 26th March 21. This was the third consecutive week of below average all cause deaths.
It is striking that the second wave closely follows the pattern of normal winter deaths, but at particularly high levels, sometimes more than 3 standard deviations from the 2015-2019 average.

It is striking that the second wave closely follows the pattern of normal winter deaths, but at particularly high levels, sometimes more than 3 standard deviations from the 2015-2019 average.
RSTurboPaul said:
Apologies, this is a super-lazy post as I have to get to bed!
What was the 'half-life' of the 'first' wave's rate of decline?
Was it also 18 days?
I'm trying to ponder on if vaccination would make any difference to the infection rate increases/decreases but it's late and my brain is failing me.
This looks at ONS weekly deaths by age band. I looked a this a couple of weeks ago and was struck by the similarity between waves 1 and 2. What was the 'half-life' of the 'first' wave's rate of decline?
Was it also 18 days?
I'm trying to ponder on if vaccination would make any difference to the infection rate increases/decreases but it's late and my brain is failing me.

I decided that the easiest comparison would be a simple variance. Deaths in each age group in wave 2 minus the equivalent week in wave 1. Where this is flat (e.g. under 40's) the rate of decline is the same for both waves. Where this slopes downward, wave 2 is falling faster than wave 1.
Wave 2 is declining faster for older age groups. Most noticeably the over 80's but with the same trend emerging for the over 70's. This seems likely to be the impact of vaccines. The benefit is subtle at this point, because it is masked by a seasonal decline, but I think it is there:
https://datawrapper.dwcdn.net/jSwB6/3/

Elysium said:
I decided that the easiest comparison would be a simple variance. Deaths in each age group in wave 2 minus the equivalent week in wave 1. Where this is flat (e.g. under 40's) the rate of decline is the same for both waves. Where this slopes downward, wave 2 is falling faster than wave 1.
Wave 2 is declining faster for older age groups. Most noticeably the over 80's but with the same trend emerging for the over 70's. This seems likely to be the impact of vaccines. The benefit is subtle at this point, because it is masked by a seasonal decline, but I think it is there:
https://datawrapper.dwcdn.net/jSwB6/3/

I think it's clear
- all the post-retirement age-groups show a downward trend, with the younger groups in that bracket starting their trend later, as the vaccine (with the consequent benefits) take effect later for them.
- all the pre-retirement age-groups are (statistically) flat.
The PHE data is a little less easy to compare between waves. Our testing regime means that cases and admissions are not the same.
However, I think it is possible to look at deaths:
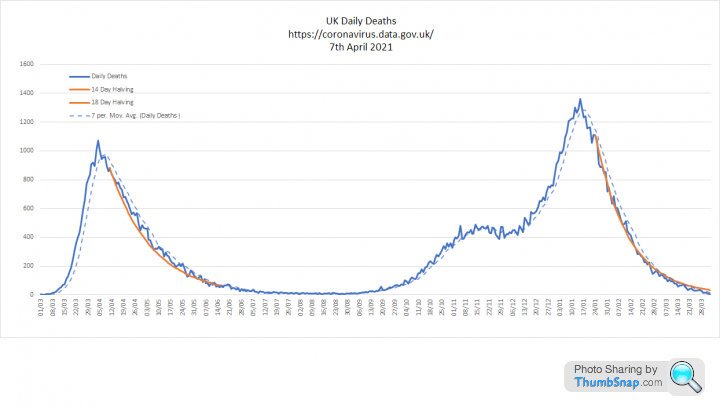
In the second wave deaths appear to be halving every 14 days. In the first wave, they halved every 18 days, which is what we currently see for admissions and cases per 100k tests.
Again, I think this could be a vaccine effect.
14 days is equivalent to a 5% fall per day
18 days is equivalent to a 4% fall per day
However, I think it is possible to look at deaths:
In the second wave deaths appear to be halving every 14 days. In the first wave, they halved every 18 days, which is what we currently see for admissions and cases per 100k tests.
Again, I think this could be a vaccine effect.
14 days is equivalent to a 5% fall per day
18 days is equivalent to a 4% fall per day
havoc said:
I think it's clear
- all the post-retirement age-groups show a downward trend, with the younger groups in that bracket starting their trend later, as the vaccine (with the consequent benefits) take effect later for them.
- all the pre-retirement age-groups are (statistically) flat.
Rt is below 1 for everyone, which I think is due to seasonality. However, it is lower for older age groups, which is likely to be the vaccines impact.
vaud said:
Elysium said:
Agreed. It does seem to fit.
Rt is below 1 for everyone, which I think is due to seasonality. However, it is lower for older age groups, which is likely to be the vaccines impact.
R is below 1 due to restrictions.Rt is below 1 for everyone, which I think is due to seasonality. However, it is lower for older age groups, which is likely to be the vaccines impact.
In the meantime, these graphs show fatalities per million population for UK, Portugal and Sweden and the associated growth rates, which roughly approximate Rt. There is close correlation between all three countries, despite very different restrictions being imposed at very different times. This leads me to conclude that other factors are at play. Seasonality in particular.

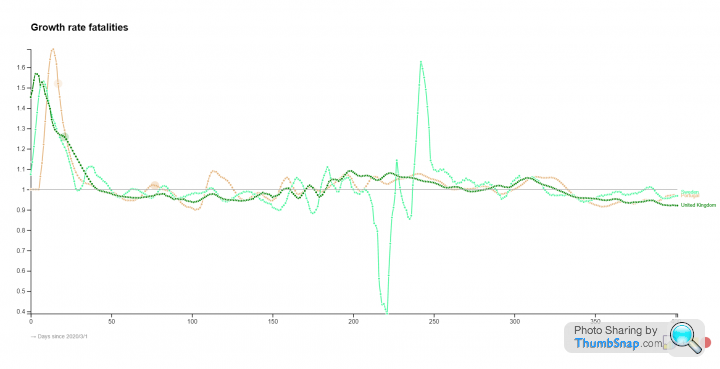
There is a great paper here which finds that restrictions have clear impacts, but that more severe restrictions like lockdowns do not create significant additional benefits:
https://onlinelibrary.wiley.com/doi/10.1111/eci.13...
Thanks for the graphs and response, Elysium! 
Interesting to see the oldest cohorts seeing better outcomes this time round - or, I guess, only the strongest remain so it will naturally be thus...?!
If vaccination increases rate of decline of a curve by 25% (4% to 5% / 18 days to 14 days) I guess that could be plugged into a model to ascertain changes in area under the curve and therefore reductions in death totals across the event?
In which case, given the already tiny numbers of those dying under 50, the change in death totals amongst that group brought about by a smaller area under the curve must surely not stack up in terms of Cost:Benefit analysis of jabbing every single man, woman and child (whether you use financial or other costs).
RSTurboPaul said:
Thanks for the graphs and response, Elysium!
Interesting to see the oldest cohorts seeing better outcomes this time round - or, I guess, only the strongest remain so it will naturally be thus...?!
If vaccination increases rate of decline of a curve by 25% (4% to 5% / 18 days to 14 days) I guess that could be plugged into a model to ascertain changes in area under the curve and therefore reductions in death totals across the event?
In which case, given the already tiny numbers of those dying under 50, the change in death totals amongst that group brought about by a smaller area under the curve must surely not stack up in terms of Cost:Benefit analysis of jabbing every single man, woman and child (whether you use financial or other costs).
If you have already bought and paid for the vaccines there is no cost: benefit analysis to be made... Interesting to see the oldest cohorts seeing better outcomes this time round - or, I guess, only the strongest remain so it will naturally be thus...?!
If vaccination increases rate of decline of a curve by 25% (4% to 5% / 18 days to 14 days) I guess that could be plugged into a model to ascertain changes in area under the curve and therefore reductions in death totals across the event?
In which case, given the already tiny numbers of those dying under 50, the change in death totals amongst that group brought about by a smaller area under the curve must surely not stack up in terms of Cost:Benefit analysis of jabbing every single man, woman and child (whether you use financial or other costs).
Vanden Saab said:
RSTurboPaul said:
Thanks for the graphs and response, Elysium!
Interesting to see the oldest cohorts seeing better outcomes this time round - or, I guess, only the strongest remain so it will naturally be thus...?!
If vaccination increases rate of decline of a curve by 25% (4% to 5% / 18 days to 14 days) I guess that could be plugged into a model to ascertain changes in area under the curve and therefore reductions in death totals across the event?
In which case, given the already tiny numbers of those dying under 50, the change in death totals amongst that group brought about by a smaller area under the curve must surely not stack up in terms of Cost:Benefit analysis of jabbing every single man, woman and child (whether you use financial or other costs).
If you have already bought and paid for the vaccines there is no cost: benefit analysis to be made... Interesting to see the oldest cohorts seeing better outcomes this time round - or, I guess, only the strongest remain so it will naturally be thus...?!
If vaccination increases rate of decline of a curve by 25% (4% to 5% / 18 days to 14 days) I guess that could be plugged into a model to ascertain changes in area under the curve and therefore reductions in death totals across the event?
In which case, given the already tiny numbers of those dying under 50, the change in death totals amongst that group brought about by a smaller area under the curve must surely not stack up in terms of Cost:Benefit analysis of jabbing every single man, woman and child (whether you use financial or other costs).
Elysium said:
havoc said:
I think it's clear
- all the post-retirement age-groups show a downward trend, with the younger groups in that bracket starting their trend later, as the vaccine (with the consequent benefits) take effect later for them.
- all the pre-retirement age-groups are (statistically) flat.
Rt is below 1 for everyone, which I think is due to seasonality. However, it is lower for older age groups, which is likely to be the vaccines impact.
purplepenguin said:
Vanden Saab said:
RSTurboPaul said:
Thanks for the graphs and response, Elysium!
Interesting to see the oldest cohorts seeing better outcomes this time round - or, I guess, only the strongest remain so it will naturally be thus...?!
If vaccination increases rate of decline of a curve by 25% (4% to 5% / 18 days to 14 days) I guess that could be plugged into a model to ascertain changes in area under the curve and therefore reductions in death totals across the event?
In which case, given the already tiny numbers of those dying under 50, the change in death totals amongst that group brought about by a smaller area under the curve must surely not stack up in terms of Cost:Benefit analysis of jabbing every single man, woman and child (whether you use financial or other costs).
If you have already bought and paid for the vaccines there is no cost: benefit analysis to be made... Interesting to see the oldest cohorts seeing better outcomes this time round - or, I guess, only the strongest remain so it will naturally be thus...?!
If vaccination increases rate of decline of a curve by 25% (4% to 5% / 18 days to 14 days) I guess that could be plugged into a model to ascertain changes in area under the curve and therefore reductions in death totals across the event?
In which case, given the already tiny numbers of those dying under 50, the change in death totals amongst that group brought about by a smaller area under the curve must surely not stack up in terms of Cost:Benefit analysis of jabbing every single man, woman and child (whether you use financial or other costs).
Gassing Station | News, Politics & Economics | Top of Page | What's New | My Stuff