Coronavirus - Data Analysis Thread
Discussion


Bolton is looking good. Cases in over 60's have barely moved and cases in the under 60's peaked on the 21st May:
https://coronavirus.data.gov.uk/details/cases?area...
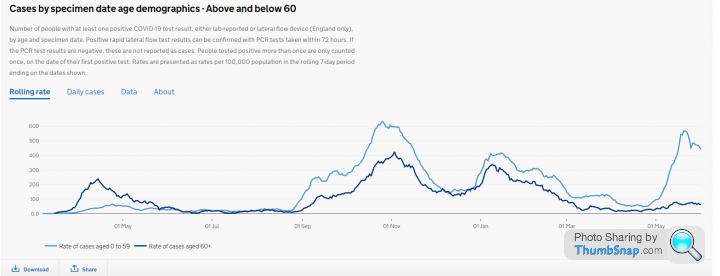
The vaccines work against the new variant. The vulnerable are protected and cases have continued to reduce despite the 17th May 'step 3' opening up.
https://coronavirus.data.gov.uk/details/cases?area...
The vaccines work against the new variant. The vulnerable are protected and cases have continued to reduce despite the 17th May 'step 3' opening up.
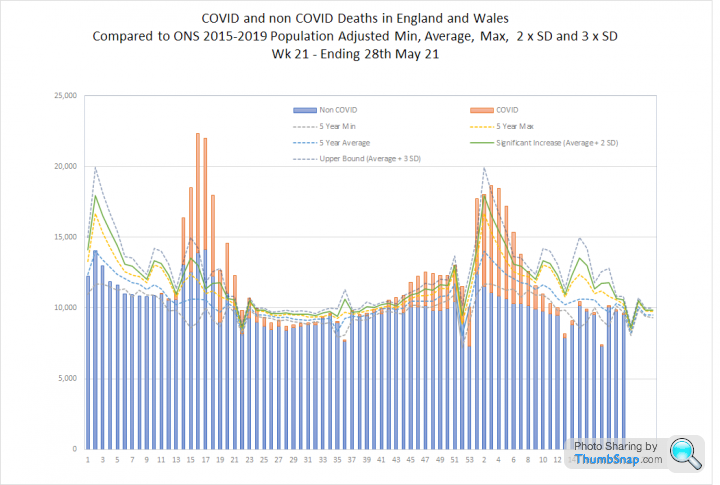
Quick update on excess deaths following the release of ONS data for week 21, ending 28th May:
1. Week 21 was the 13th consecutive week where deaths were at or below the 5 year average. Thats 3 solid months where deaths were lower than normal 'in the middle of a global pandemic'
2. In weeks 20 and 21 deaths 'due to' COVID accounted for just 0.7% of overall deaths. Thats 7 deaths in every thousand.
3. Since week 9 there have been 5,271 deaths 'involving' COVID. However, COVID was stated as a cause of death in just 3,989 of these. The PHE figure for that period is even lower at 2,588 deaths.
4. Since week 9 there have been 10,576 fewer deaths than we would normally expect.
Muncher said:
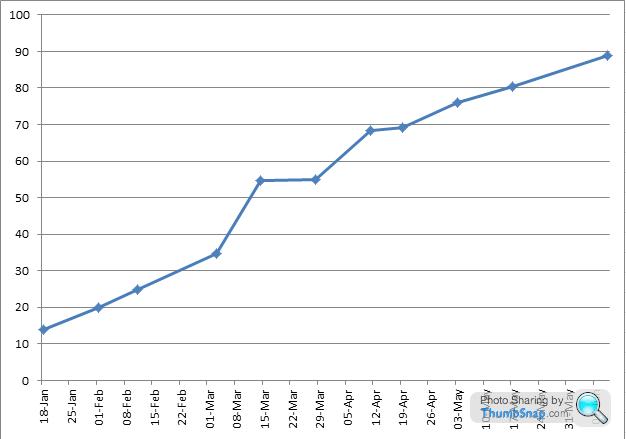
Here is a chart of antibody prevalence of adults in the community as per the ONS surveys. The last data collected was as at 17 May, I have added the last point on the graph as at today's date based upon the trendline.
Here is the age breakdown of cases from last week:
Mode: 20-24 yr
Median: 25-29yr
Mean: ~30.6yr

In the Autumn wave when we reached ~7500 cases we were getting over 400 hospital admissions daily. Now at a similar case rate we are seeing just over 100 daily hospital admissions. So this has to show that the vaccines are working well.
The number of Covid patients in Bolton hospital is decreasing so hopefully this pattern will follow elsewhere and this wave will fizzle out.
Israel had a mini-bump in cases when they started to re-open with high levels of vaccinated adults, perhaps we are seeing a similar thing but with a more transmissive variant making it a slightly bigger bump.
Mode: 20-24 yr
Median: 25-29yr
Mean: ~30.6yr
In the Autumn wave when we reached ~7500 cases we were getting over 400 hospital admissions daily. Now at a similar case rate we are seeing just over 100 daily hospital admissions. So this has to show that the vaccines are working well.
The number of Covid patients in Bolton hospital is decreasing so hopefully this pattern will follow elsewhere and this wave will fizzle out.
Israel had a mini-bump in cases when they started to re-open with high levels of vaccinated adults, perhaps we are seeing a similar thing but with a more transmissive variant making it a slightly bigger bump.
Elysium said:
Interesting. 90% of adults would equate to around 70% of the total population of England and Wales
If you assume at least 40% of under 16s have previously been exposed to it (I think I saw a source suggesting something in this range but can't find it) then the proportion of the population as a whole that has antibodies is currently around 79%.JmatthewB said:
Here is the age breakdown of cases from last week:
Mode: 20-24 yr
Median: 25-29yr
Mean: ~30.6yr
In the Autumn wave when we reached ~7500 cases we were getting over 400 hospital admissions daily. Now at a similar case rate we are seeing just over 100 daily hospital admissions. So this has to show that the vaccines are working well.
The number of Covid patients in Bolton hospital is decreasing so hopefully this pattern will follow elsewhere and this wave will fizzle out.
Israel had a mini-bump in cases when they started to re-open with high levels of vaccinated adults, perhaps we are seeing a similar thing but with a more transmissive variant making it a slightly bigger bump.
I'd say the vaccines have seriously messed with Covid as this was infections and deaths before we really got hold of it:Mode: 20-24 yr
Median: 25-29yr
Mean: ~30.6yr
In the Autumn wave when we reached ~7500 cases we were getting over 400 hospital admissions daily. Now at a similar case rate we are seeing just over 100 daily hospital admissions. So this has to show that the vaccines are working well.
The number of Covid patients in Bolton hospital is decreasing so hopefully this pattern will follow elsewhere and this wave will fizzle out.
Israel had a mini-bump in cases when they started to re-open with high levels of vaccinated adults, perhaps we are seeing a similar thing but with a more transmissive variant making it a slightly bigger bump.
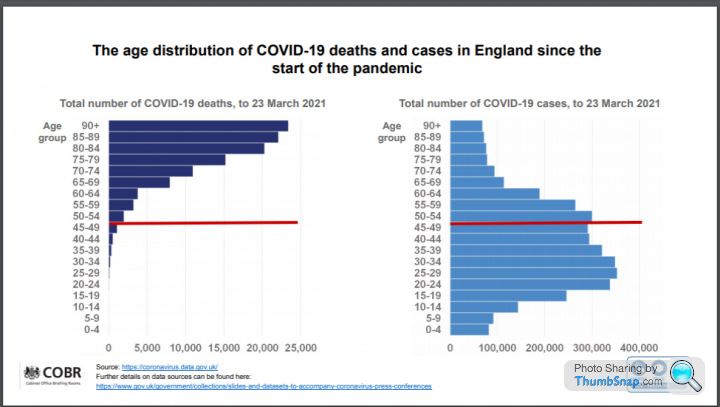
Pretty much even infections across the middle 80% of age ranges with vast majority of deaths concentrated at 70+
TX.
Edited by Terminator X on Thursday 10th June 12:25
Terminator X said:
I'd say the vaccines have seriously messed with Covid as this was infections and deaths before we really got hold of it:
Pretty much even infections across the middle 80% of age ranges with vast majority of deaths concentrated at 70+
TX.
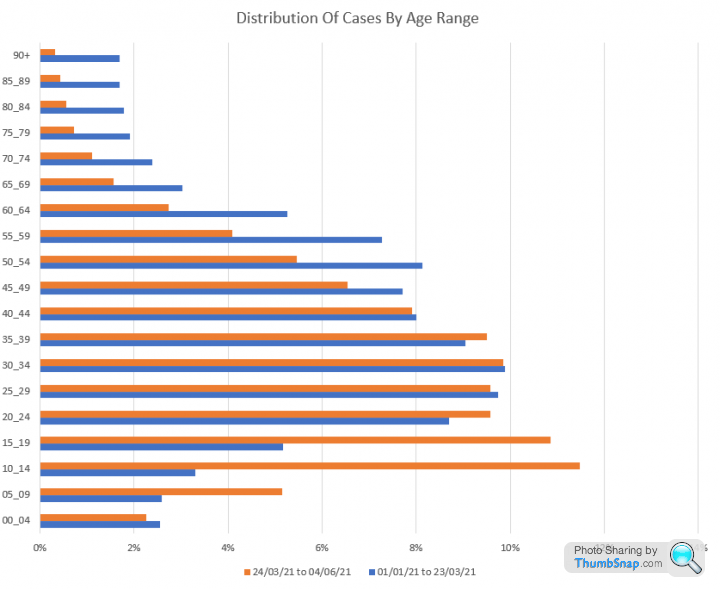
This shows the change in the distribution of cases from 1st Jan 2021 to 23rd March compared to 24th March onwards for England:Pretty much even infections across the middle 80% of age ranges with vast majority of deaths concentrated at 70+
TX.
Edited by Terminator X on Thursday 10th June 12:25
And the same for deaths:

Edited by CarlosFandango11 on Thursday 10th June 17:15
CarlosFandango11 said:
This shows the change in the distribution of cases from 1st Jan 2021 to 23rd March compared to 24th March onwards for England:
And the same for deaths:
The raw figures rather than percentages would give a nicer view of the reality of itAnd the same for deaths:
Edited by CarlosFandango11 on Thursday 10th June 17:15
HappyMidget said:
CarlosFandango11 said:
The raw figures rather than percentages would give a nicer view of the reality of itUsing percentages shows the just change in the age distribution over the two time periods.
Using case & deaths counts would show the change in the age distribution AND the change in volume, making it very difficult to see the change in the age distribution.
Update with todays data:
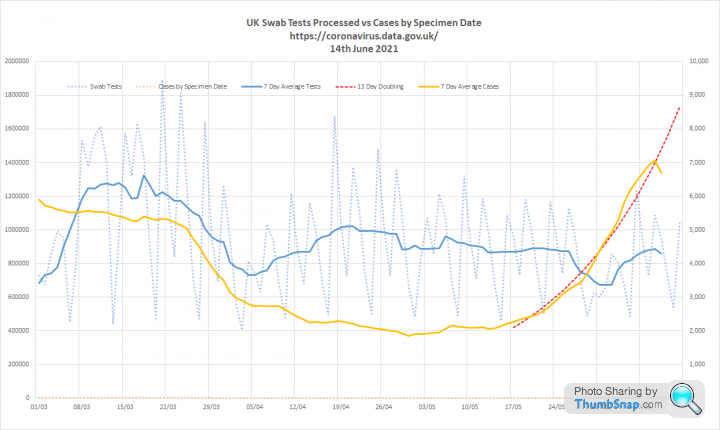
1. Tests and Cases.
I've tweaked this graph slightly to use a calculated 7 day average so it's easier to estimate the doubling rate for the rise in cases. 13 day doubling is still the best fit:

2. Key metrics.
Cases per 100k tests is also doubling every 13 days. The interesting thing is that, because deaths have not increased, the Case Fatality Rate is becoming very low. The last data I have compares cases on the 26th May (3793) with deaths on the 8th June (4). That is a CFR of 0.1% (1 in 1,000)

I have also graphed the Case Admission Rate (% age of cases leading to admissions). The trend is less obvious here, but there is a long term fall from 9% in February to 4% now. Both of these seem very high to me.

As noted above, deaths remain at very low levels. 7 day average in single figures since 5th May

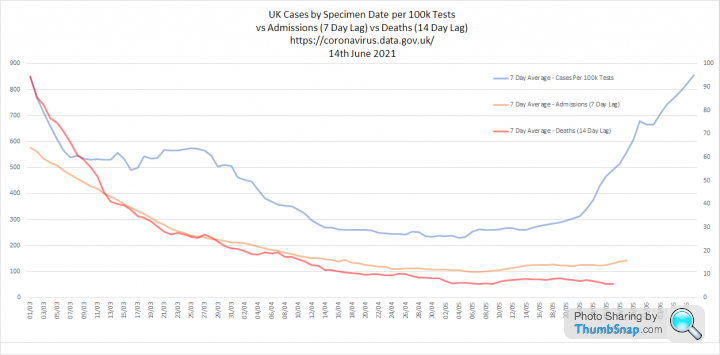
3. Key metrics overlaid.
This is probably the key one to watch right now. The increases in Cases per 100k tests seen so far have not resulted in increases in admissions and deaths. We have already passed the point where this should be visible and (so far) its not there. It should become obvious one way or another in the next week:

4. Growth rates and Rt
This suggests Rt is somewhere around 1.25. I read earlier that >90% of cases are now the Delta variant, which is believed to be 60% more transmissable. That would mean Rt would have been about 0.8 without the variant.

1. Tests and Cases.
I've tweaked this graph slightly to use a calculated 7 day average so it's easier to estimate the doubling rate for the rise in cases. 13 day doubling is still the best fit:
2. Key metrics.
Cases per 100k tests is also doubling every 13 days. The interesting thing is that, because deaths have not increased, the Case Fatality Rate is becoming very low. The last data I have compares cases on the 26th May (3793) with deaths on the 8th June (4). That is a CFR of 0.1% (1 in 1,000)
I have also graphed the Case Admission Rate (% age of cases leading to admissions). The trend is less obvious here, but there is a long term fall from 9% in February to 4% now. Both of these seem very high to me.
As noted above, deaths remain at very low levels. 7 day average in single figures since 5th May
3. Key metrics overlaid.
This is probably the key one to watch right now. The increases in Cases per 100k tests seen so far have not resulted in increases in admissions and deaths. We have already passed the point where this should be visible and (so far) its not there. It should become obvious one way or another in the next week:
4. Growth rates and Rt
This suggests Rt is somewhere around 1.25. I read earlier that >90% of cases are now the Delta variant, which is believed to be 60% more transmissable. That would mean Rt would have been about 0.8 without the variant.
Elysium said:
I have also graphed the Case Admission Rate (% age of cases leading to admissions). The trend is less obvious here, but there is a long term fall from 9% in February to 4% now. Both of these seem very high to me.
Is this a genuine effect of the virus, or are hospitals testing automatically on admission (I assume so) and then putting "Covid" down regardless of why the person came in / what the key problem is?havoc said:
Elysium said:
Is this a genuine effect of the virus, or are hospitals testing automatically on admission (I assume so) and then putting "Covid" down regardless of why the person came in / what the key problem is?NHS said:
The current inpatient testing programme remains:
(i) all patients at emergency admission, whether or not they have symptoms;
(ii) those with symptoms of COVID-19 after admission;
(iii) for those who test negative upon admission, a further single re-test should be conducted
between 5-7 days after admission;
(iv) test all patients on discharge to other care settings, including to care homes or hospices;
(v) elective patient testing prior to admission.
Anyone in hospital is tested multiple times. Regardless of the reason for them being there. If they test positive they become COVID admissions, even if they are asymptomatic.(i) all patients at emergency admission, whether or not they have symptoms;
(ii) those with symptoms of COVID-19 after admission;
(iii) for those who test negative upon admission, a further single re-test should be conducted
between 5-7 days after admission;
(iv) test all patients on discharge to other care settings, including to care homes or hospices;
(v) elective patient testing prior to admission.
It makes sense that the admission rate per case should fall when COVID is less prevalent as asymptomatic cases will be less prevalent also.
It will also reduce as average cases become younger as a positive impact of vaccination.
Elysium said:
havoc said:
Elysium said:
Is this a genuine effect of the virus, or are hospitals testing automatically on admission (I assume so) and then putting "Covid" down regardless of why the person came in / what the key problem is?NHS said:
The current inpatient testing programme remains:
(i) all patients at emergency admission, whether or not they have symptoms;
(ii) those with symptoms of COVID-19 after admission;
(iii) for those who test negative upon admission, a further single re-test should be conducted
between 5-7 days after admission;
(iv) test all patients on discharge to other care settings, including to care homes or hospices;
(v) elective patient testing prior to admission.
Anyone in hospital is tested multiple times. Regardless of the reason for them being there. If they test positive they become COVID admissions, even if they are asymptomatic.(i) all patients at emergency admission, whether or not they have symptoms;
(ii) those with symptoms of COVID-19 after admission;
(iii) for those who test negative upon admission, a further single re-test should be conducted
between 5-7 days after admission;
(iv) test all patients on discharge to other care settings, including to care homes or hospices;
(v) elective patient testing prior to admission.
It makes sense that the admission rate per case should fall when COVID is less prevalent as asymptomatic cases will be less prevalent also.
It will also reduce as average cases become younger as a positive impact of vaccination.
If so, one presumes that they cannot go back in time and record the same for the past 15 months, so it would be interesting 'backcasting' the split of 'for' vs 'with' across previous data. (Although I note that it is likely to be somewhat inaccurate - but then that doesn't stop Govt and their pet modellers...)
Update on the data to give some context to todays events:
1. Cases and Tests. I think there are signs here that case growth is slowing. Although the downtick at the end of the curve is probably reporting lag.
2. Key metrics. I think the slowdown is a little more apparent here in cases per 100k tests. The more interesting point is the continued fall in the case fatality rate. This is happening because cases are increasing and deaths are not. Even when we account for the lag between infection and death.

Hospital admissions are inching up a little, but its reassuring that the case admissions rate is steadily falling

Deaths continue to bump along at the very bottom. Over a month of single figures averaging 7 deaths per day.

3. All of the above metrics overlaid with lag. Its pretty clear that admissions and deaths have not increased at the same rate as cases
1. Cases and Tests. I think there are signs here that case growth is slowing. Although the downtick at the end of the curve is probably reporting lag.
2. Key metrics. I think the slowdown is a little more apparent here in cases per 100k tests. The more interesting point is the continued fall in the case fatality rate. This is happening because cases are increasing and deaths are not. Even when we account for the lag between infection and death.
Hospital admissions are inching up a little, but its reassuring that the case admissions rate is steadily falling
Deaths continue to bump along at the very bottom. Over a month of single figures averaging 7 deaths per day.
3. All of the above metrics overlaid with lag. Its pretty clear that admissions and deaths have not increased at the same rate as cases
These models suggest that a delay will reduce the size of the exit wave, but we already knew that:
https://www.gov.uk/government/publications/imperia...
https://www.gov.uk/government/publications/univers...
All incredibly clever stuff. But it completely ignores the collateral damage caused by dragging this out.
Beyond that, I think the delay is largely political.
https://www.gov.uk/government/publications/imperia...
https://www.gov.uk/government/publications/univers...
All incredibly clever stuff. But it completely ignores the collateral damage caused by dragging this out.
Beyond that, I think the delay is largely political.
Elysium said:
Beyond that, I think the delay is largely political.
Which is the part I never get in these discussions.Boris wants to be popular. He is not an authoritarian…
Lockdowns and extensions seem to be more widely supported than we might have thought they would have been pre-pandemic.
vaud said:
Elysium said:
Beyond that, I think the delay is largely political.
Which is the part I never get in these discussions.Boris wants to be popular. He is not an authoritarian…
Lockdowns and extensions seem to be more widely supported than we might have thought they would have been pre-pandemic.
The public are still not ready for these final restrictions to be lifted. In the USA a fully vaccinated person does not need to isolate if they are exposed to COVID.
Thats incomprehensible to most people here.
Gassing Station | News, Politics & Economics | Top of Page | What's New | My Stuff