Coronavirus - Data Analysis Thread
Discussion


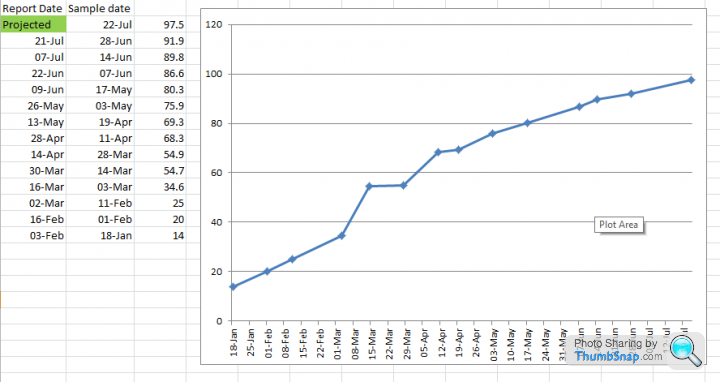
New ONS antibody prevalence survey results out today, 91.9% of the adult population would have tested positive for antibodies during the week beginning 28 June.
Continuing that trend through would suggest something like 97.5% as of todays date.
https://www.ons.gov.uk/peoplepopulationandcommunit...
Continuing that trend through would suggest something like 97.5% as of todays date.
https://www.ons.gov.uk/peoplepopulationandcommunit...

Muncher said:
New ONS antibody prevalence survey results out today, 91.9% of the adult population would have tested positive for antibodies during the week beginning 28 June.
Continuing that trend through would suggest something like 97.5% as of todays date.
https://www.ons.gov.uk/peoplepopulationandcommunit...
If you look at the data split by age group, you can see that there's more going on than is initially apparent:Continuing that trend through would suggest something like 97.5% as of todays date.
https://www.ons.gov.uk/peoplepopulationandcommunit...
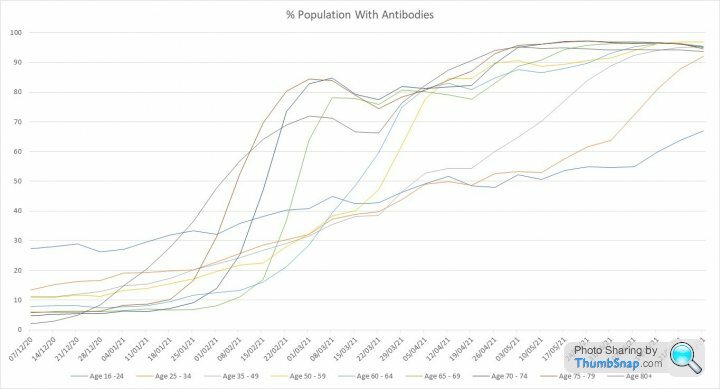
Link for better resolution of graph: https://thumbsnap.com/f/V1BXoriu
It looks like at todays date that antibody levels will only have increased materially in the 16-24 age group, and also slightly 25-34 age group.
Assuming that the recent trend in the 16-24 age group has continued, and that the 25-34 age group level increases slightly to where the other age groups have levelled off, I would estimate an increase of about 3%, with todays level around 95%.
Edited by CarlosFandango11 on Wednesday 21st July 11:23
NoddyonNitrous said:
The Y-axis is percentage going up to 120?
Blame excel, I don't know why it did that.The other interesting thing you can read into this is, if 1.9% of the population developed antibodies over a 2 week period this equates to 1.273M people.
New first doses14 days prior to this were running at about 150,000 per week.
That suggests 973,000 "new" people were infected and produced antibodies within that 2 week period.
In contrast 219,136 people over this period had a positive test, which suggests, at the very maximum, only 23% of new infections are testing positive.
If that ratio were right, at the moment we are looking at something like 150,000 new cases every day.
Assuming we do have 150,000 cases per day consistently, testing positive for 14 days, that's ~2.1M people at any point in time which is 3% of the population.
Based on the number of people who are admitted to hospital each day, on average you would expect 493 of those admitted to be "covid admissions" regardless of the reasons and around 48 of the deaths each day to be "covid deaths".
Based on the number of people who are admitted to hospital each day, on average you would expect 493 of those admitted to be "covid admissions" regardless of the reasons and around 48 of the deaths each day to be "covid deaths".
Muncher said:
NoddyonNitrous said:
The Y-axis is percentage going up to 120?
Blame excel, I don't know why it did that.The other interesting thing you can read into this is, if 1.9% of the population developed antibodies over a 2 week period this equates to 1.273M people.
New first doses14 days prior to this were running at about 150,000 per week.
That suggests 973,000 "new" people were infected and produced antibodies within that 2 week period.
In contrast 219,136 people over this period had a positive test, which suggests, at the very maximum, only 23% of new infections are testing positive.
If that ratio were right, at the moment we are looking at something like 150,000 new cases every day.
So many more 1st vaccinations that new people with antibodies.
b0rk said:
spikeyhead said:
If we focus on the "Over50s" line below
Admission,
All cases, 173 vax, 733 unvax
Over 50's, 140 vax, 82 unvax
Under 50's, 33 vax, 651 unvax
and we know that 90% of the over 50s are double jabbed, then the 10% unjabbed account for about 37% of admissions.
For the under 50s, we can take a sensible guess that 50% of them are jabbed, those that are jabbed only make up 5% of admissions.
Wondered if anyone would bite on this, yes over 50’s unjabbed have a larger population share of admissions than the jabbed. The jabbed population being a far larger number so the case and admission rate per 100k is about 1/5th of the unjabbed.Admission,
All cases, 173 vax, 733 unvax
Over 50's, 140 vax, 82 unvax
Under 50's, 33 vax, 651 unvax
and we know that 90% of the over 50s are double jabbed, then the 10% unjabbed account for about 37% of admissions.
For the under 50s, we can take a sensible guess that 50% of them are jabbed, those that are jabbed only make up 5% of admissions.
CarlosFandango11 said:
Two possible reasons in my mind:
a) the unvaccinated proportion is generally decreasing due to the vaccination rollout, so it will drop naturally with the same infection %. Same reasoning for the vaccinated cases to increase
b) those who are not vaccinated are disengaging with the system - no app and no testing means no isolation...
strudel said:
Two possible reasons in my mind:
a) the unvaccinated proportion is generally decreasing due to the vaccination rollout, so it will drop naturally with the same infection %. Same reasoning for the vaccinated cases to increase
b) those who are not vaccinated are disengaging with the system - no app and no testing means no isolation...
I think both are at play, but would agree that b) is probably increasing, thus BJ's vax passport plana) the unvaccinated proportion is generally decreasing due to the vaccination rollout, so it will drop naturally with the same infection %. Same reasoning for the vaccinated cases to increase
b) those who are not vaccinated are disengaging with the system - no app and no testing means no isolation...
Biker 1 said:
strudel said:
Two possible reasons in my mind:
a) the unvaccinated proportion is generally decreasing due to the vaccination rollout, so it will drop naturally with the same infection %. Same reasoning for the vaccinated cases to increase
b) those who are not vaccinated are disengaging with the system - no app and no testing means no isolation...
I think both are at play, but would agree that b) is probably increasing, thus BJ's vax passport plana) the unvaccinated proportion is generally decreasing due to the vaccination rollout, so it will drop naturally with the same infection %. Same reasoning for the vaccinated cases to increase
b) those who are not vaccinated are disengaging with the system - no app and no testing means no isolation...
The unvaccinated new cases are falling far faster than people are being vaccinated.
I suspect that the behaviour of the few unvaccinated people who are still filling the survey in has become unrepresentative of the unvaccinated population.
CarlosFandango11 said:
Biker 1 said:
strudel said:
Two possible reasons in my mind:
a) the unvaccinated proportion is generally decreasing due to the vaccination rollout, so it will drop naturally with the same infection %. Same reasoning for the vaccinated cases to increase
b) those who are not vaccinated are disengaging with the system - no app and no testing means no isolation...
I think both are at play, but would agree that b) is probably increasing, thus BJ's vax passport plana) the unvaccinated proportion is generally decreasing due to the vaccination rollout, so it will drop naturally with the same infection %. Same reasoning for the vaccinated cases to increase
b) those who are not vaccinated are disengaging with the system - no app and no testing means no isolation...
The unvaccinated new cases are falling far faster than people are being vaccinated.
I suspect that the behaviour of the few unvaccinated people who are still filling the survey in has become unrepresentative of the unvaccinated population.
Quite a big change.
CarlosFandango11 said:
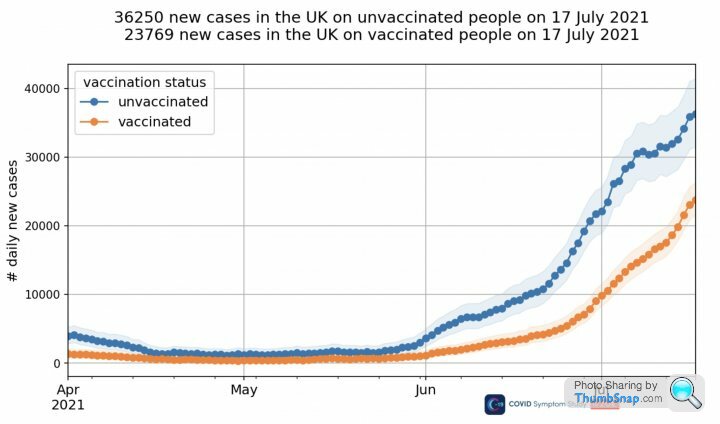
So, the correct answer is actually c) the Zoe Covid Symptom Survey's methodolody was wrong! They've updated their methodology yesterday and now have the following for vaccinated and unvaccinated cases:
Quite a big change.
Interesting.Quite a big change.
If one was a cynic, one would wonder if they were giving out 'the wrong answer' and someone 'had a word'... lol
Did they summarise the changes made?
RSTurboPaul said:
CarlosFandango11 said:
So, the correct answer is actually c) the Zoe Covid Symptom Survey's methodolody was wrong! They've updated their methodology yesterday and now have the following for vaccinated and unvaccinated cases:
Quite a big change.
Interesting.Quite a big change.
If one was a cynic, one would wonder if they were giving out 'the wrong answer' and someone 'had a word'... lol
Did they summarise the changes made?
Changes made are here, plus a graph of their "before" and "after" new cases:
https://covid.joinzoe.com/post/covid-estimates-upd...
RSTurboPaul said:
CarlosFandango11 said:
So, the correct answer is actually c) the Zoe Covid Symptom Survey's methodolody was wrong! They've updated their methodology yesterday and now have the following for vaccinated and unvaccinated cases:
Quite a big change.
Interesting.Quite a big change.
If one was a cynic, one would wonder if they were giving out 'the wrong answer' and someone 'had a word'... lol
Did they summarise the changes made?
Clearly unvaccinated are just taking a bit more care still, moderating their socialising and so on, and perhaps vaccinated are enjoying getting out.
What is the current expcted CFR for a 40 yr old?
CarlosFandango11 said:
They were showing unvaccinated new cases decreasing by a lot since the start of July - perhaps someone challenged that, or perhaps they decided to review their methodology.
Changes made are here, plus a graph of their "before" and "after" new cases:
https://covid.joinzoe.com/post/covid-estimates-upd...
Thank you!Changes made are here, plus a graph of their "before" and "after" new cases:
https://covid.joinzoe.com/post/covid-estimates-upd...
Gassing Station | News, Politics & Economics | Top of Page | What's New | My Stuff