Coronavirus - Data Analysis Thread
Discussion


CarlosFandango11 said:
Elysium said:
CarlosFandango11 said:
Elysium said:
I think we now have evidence that 'zero COVID' or the eradication of COVID in a region through isolation and lockdown has failed.
New Zealand, which was once the poster child for this idea, has now exceeded the UK's recent peak of cases when corrected for population size. However, they may now benefit with a lower death rate due to the inherent lower severity of omicron in a heavily vaccinated population:
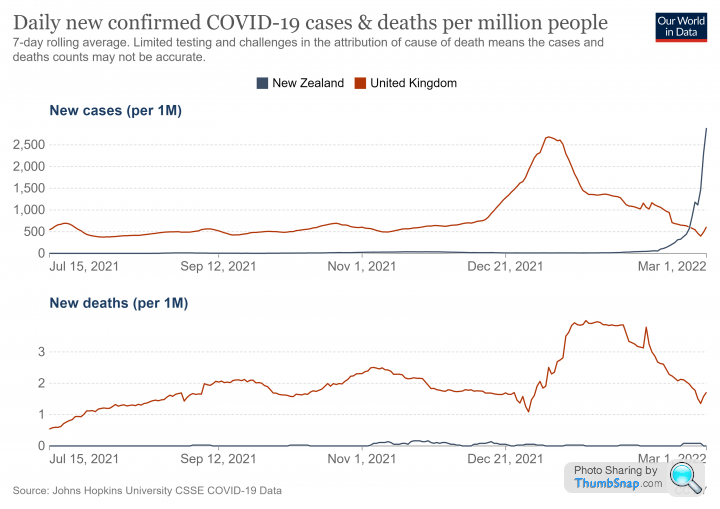
What was New Zealand’s strategy for Covid? I don’t think it was to keep at “zero COVID” forever. If it was to keep levels of COVID very low, or zero, until their population had a high level of vaccinations to minimise deaths, then it looks like they’ve been successful.New Zealand, which was once the poster child for this idea, has now exceeded the UK's recent peak of cases when corrected for population size. However, they may now benefit with a lower death rate due to the inherent lower severity of omicron in a heavily vaccinated population:
https://edition.cnn.com/2021/10/05/asia/new-zealan...
Quote from link said:
Ardern said while the transition to living with the virus was always a move New Zealand was going to make
Quote from link said:
Speaking to reporters Monday, Ardern said she had no regrets about enforcing New Zealand's zero-Covid strategy over the past 18 months because it had saved lives.
"Elimination was important because we didn't have vaccines. Now we do," she said.
Perhaps other countries Zero COVID approaches might not be viewed to be as successful..."Elimination was important because we didn't have vaccines. Now we do," she said.
Zero COVID is an elimination strategy. The openly stated objective is that by maintaining NPI's for a lengthy period you can eventually eliminate the virus from entire regions or countries.
This is the strategy that New Zealand were pursuing until it became apparent that it was not working. Prof Mark Woolhouse, who was part of the SAGE modelling team SPI-M, has recently published a book that discusses the flaws in this idea. Not least of these is the characteristics of exponential decay, which means that universal NPI's would need to be applied for a very long time indeed.
You are arguing that their approach may ultimately have led to the best outcome. That is a different argument to the idea that the zero COVID policy 'worked', because if that were true it would have achieved its stated aims and the virus would have been elminated from New Zealand.
New Zealand is now experiencing its first coronavirus wave. I think they will benefit from having delayed it, but that was a gamble and only time will tell.
Zad said:
I have a couple of theories regarding the recent increase in infections. Firstly, the weather in February was especially nasty. Lots of high winds for a long time. This sort of thing deters people from socialising, and so drove the numbers down quite quickly. Secondly, the school half term holidays were (varying on local authority) at the end of Feb. This pushed the stats for under-19s down further.
Then the schools went back, and the weather improved and infections started increasing again. This might explain why the up-tick is so geographically widespread. The recovery has been rather counter-intuitive; rural areas seem to be slower than urban ones. Presumably because omicron burned through the population so quickly in cities that it created a sort of fire break. For example, several inner city areas of Bradford are reporting under 3 cases now (which shows as white on the case maps).
I wonder if a difficulty in obtaining free lateral flow tests is having an influence too. People going back to work / school / using public transport when they are still infectious.
I see some problems with these theories: Then the schools went back, and the weather improved and infections started increasing again. This might explain why the up-tick is so geographically widespread. The recovery has been rather counter-intuitive; rural areas seem to be slower than urban ones. Presumably because omicron burned through the population so quickly in cities that it created a sort of fire break. For example, several inner city areas of Bradford are reporting under 3 cases now (which shows as white on the case maps).
I wonder if a difficulty in obtaining free lateral flow tests is having an influence too. People going back to work / school / using public transport when they are still infectious.
1. Transmission tends to increase in bad weather because people socialise more indoors. That is the basis of seasonality for viruses.
2. It is now pretty much concluded that schools are not a major driver of transmission.
There is a bit of a clue in the 'Victim of maths' twitter thread quoted above, which observes that cases and hospitalisations have increased simultaneously when there is usually a 7 day lag between them.
This suggests a general increase in prevalence and a corresponding increase in 'incidental' admissions.
I think the explanation may actually very simply. Most people seem to have taken the lifting of restrictions on the 24th Feb as a 'green light' to return to normal. I have certainly noticed more people out and about, mixing, socialising and travelling for work. In fact the last week or so has felt almost entirely like 2019.
Older, more cautious people are the last group to return to social mixing. They are least likely to have been infected before and will have been boosted more than 3 months ago. So this group will also include a fairly high proportion of people who are susceptible to infection.
As this susceptible group returns to normal life transmission is likely to increase. Since this older group is also more likely to be admitted to hospital for other conditions it follows that incidental admissions might also increase.
grumbledoak said:
Elysium said:
I see some problems with these theories:
1. Transmission tends to increase in bad weather because people socialise more indoors. That is the basis of seasonality for viruses.
2. It is now pretty much concluded that schools are not a major driver of transmission.
Isn't school mostly indoors?1. Transmission tends to increase in bad weather because people socialise more indoors. That is the basis of seasonality for viruses.
2. It is now pretty much concluded that schools are not a major driver of transmission.
I suspect "seasonality" is dominated by other factors.
Seasonality is actually quite interesting. Sunlight is clearly a factor as UV light is proven to degrade viruses, but it is thought that one of the main drivers is the way that peoples behaviour changes in response to weather.
An example of this is warmer sub tropical regions which have a winter AND summer season for respiratory viruses. That doesn't fit with the idea it is directly weather related, but it does support the behaviour idea. People are more likely to socialise indoors when it is cold OR when it is very hot.
This is an airbourne virus that transmits mainly as an aerosol, so ventilation is going to have a very significant effect.
grumbledoak said:
Elysium said:
Of course schools are 'indoors', but as was suggested early on, the real world data continues to support the idea that schoolchildren transmit the virus less than adults and that child to child transmission is suprisingly rare.
Seasonality is actually quite interesting. Sunlight is clearly a factor as UV light is proven to degrade viruses, but it is thought that one of the main drivers is the way that peoples behaviour changes in response to weather.
An example of this is warmer sub tropical regions which have a winter AND summer season for respiratory viruses. That doesn't fit with the idea it is directly weather related, but it does support the behaviour idea. People are more likely to socialise indoors when it is cold OR when it is very hot.
This is an airbourne virus that transmits mainly as an aerosol, so ventilation is going to have a very significant effect.
Don't forget how much some people have wanted to use this to Seasonality is actually quite interesting. Sunlight is clearly a factor as UV light is proven to degrade viruses, but it is thought that one of the main drivers is the way that peoples behaviour changes in response to weather.
An example of this is warmer sub tropical regions which have a winter AND summer season for respiratory viruses. That doesn't fit with the idea it is directly weather related, but it does support the behaviour idea. People are more likely to socialise indoors when it is cold OR when it is very hot.
This is an airbourne virus that transmits mainly as an aerosol, so ventilation is going to have a very significant effect.
I would like to see proper investigation of human susceptibility related to Vitamin D and even simple temperature changes, and virus susceptibility to sunlight and atmospheric conditions like humidity. I bet we don't look in those directions.
https://news.yale.edu/2021/06/14/heat-humidity-and...
Vit D somehow became controversial when it is already well understood that Vit D deficiency negatively impacts our immune response. I've been taking a supplement for 2 years as it is a minimal cost precaution with zero downside.
vaud said:
Elysium said:
Of course schools are 'indoors', but as was suggested early on, the real world data continues to support the idea that schoolchildren transmit the virus less than adults and that child to child transmission is suprisingly rare.
I'm not so sure. It went rapidly through our school and currently 25% of Foundation year are out sick with it. With lowish levels in the community, it would seem odd for them all to get it in one week if it wasn't being transmitted between the kids. Seems mild, but maybe just the current variant is more transmissible between kids.https://www.dailymail.co.uk/news/article-8548461/N...
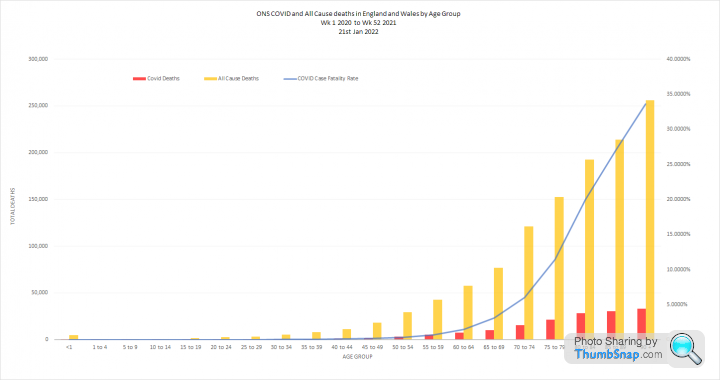
By mid January 2022 we had identified around 2.2m cases of COVID in England and Wales amongst the under 15's. This is about 20% of the population
However, the ONS were suggesting that up to 93% of 12-15 year olds and 73% of 8-11 year olds were likely to have antibodies at that time. Since the majority of that group were unvaccinated this implies 7-8 million childhood infections that were so mild that they went undocumented:
https://www.ons.gov.uk/peoplepopulationandcommunit...
Observation of symptomatic cases in schools is not necessarily giving the full picture.
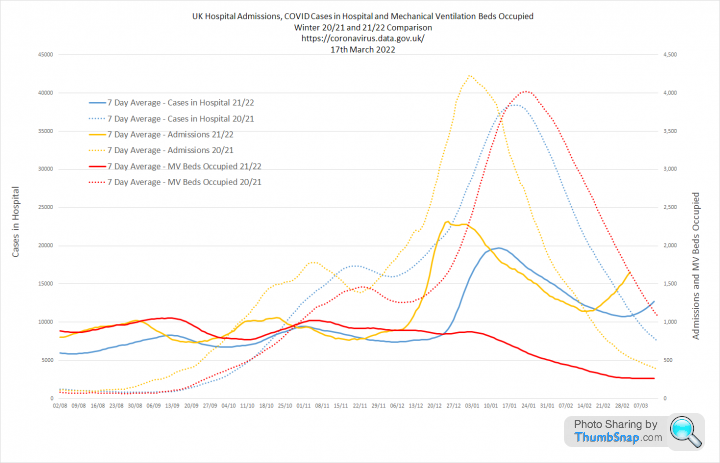
I wasn't planning to do any more updates, but the recent growth in cases prompted me to take another look
1. Year on Year comparisons. If the increase in cases is going to result in more deaths we should start to see this next week. I am hopeful we won't because mechanical ventilator bed occupancy has not increased with admissions or the overall numbers in hospital. This all suggests to me that general prevalence of COVID has increased, because contacts have increased. But that this is not translating to an increase in severe COVID and that the hospital admission rise is likely to be incidental.
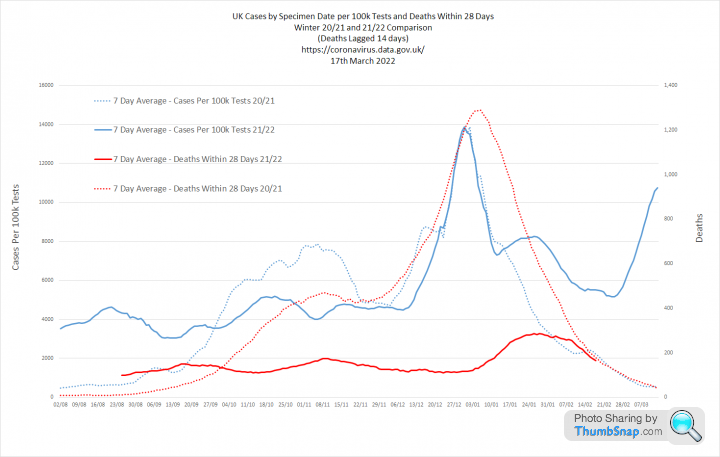
2. When we look at Cases per 100k tests, admissions and deaths with a 7 and 14 day lag we see something interesting. The admissions growth appears to happen before the case growth. So the normal lag between becoming a case and being admitted has changed. In fact admission and case growth have happened simultaneously, which again fits the thoery of a general increase in prevalence with associated incidental admissions.
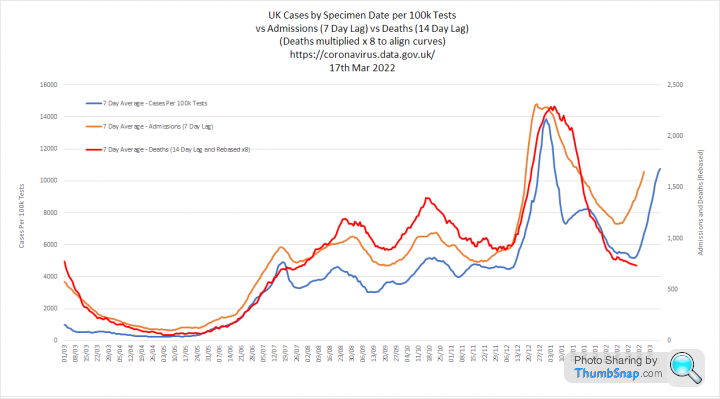
Overall, this looks fine to me given we are now operating with no real domestic restrictions. Next couple of weeks will be interesting though
1. Year on Year comparisons. If the increase in cases is going to result in more deaths we should start to see this next week. I am hopeful we won't because mechanical ventilator bed occupancy has not increased with admissions or the overall numbers in hospital. This all suggests to me that general prevalence of COVID has increased, because contacts have increased. But that this is not translating to an increase in severe COVID and that the hospital admission rise is likely to be incidental.
2. When we look at Cases per 100k tests, admissions and deaths with a 7 and 14 day lag we see something interesting. The admissions growth appears to happen before the case growth. So the normal lag between becoming a case and being admitted has changed. In fact admission and case growth have happened simultaneously, which again fits the thoery of a general increase in prevalence with associated incidental admissions.
Overall, this looks fine to me given we are now operating with no real domestic restrictions. Next couple of weeks will be interesting though

Smollet said:
Terminator X said:
anonymous said:
[redacted]
So 15m deaths from 8bn population and at what £'s cost ...TX.

Latest data from the ONS confirms that omicron is MUCH less likely to kill you than Delta:
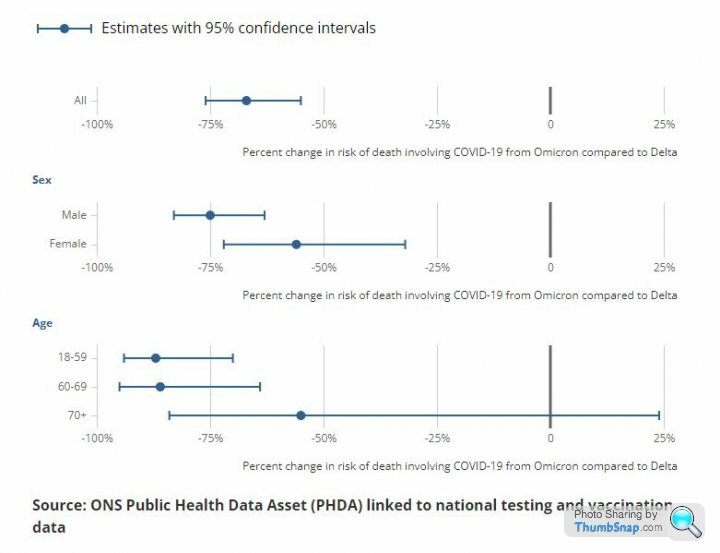
https://www.ons.gov.uk/peoplepopulationandcommunit...
A tenfold reduction in mortality risk for those <70
https://www.ons.gov.uk/peoplepopulationandcommunit...
A tenfold reduction in mortality risk for those <70
Biker 1 said:
My man maths isn't up to it on a Monday afternoon - what does the IFR look like for under 70s these days? I suspect its something similar to complications from the common cold(???)
A belated follow up to this specific question and the thread in general. John P Ioannidis is one of the worlds most eminent epidemiologists. He faced a huge backlash early in the pandemic because he published a paper showing relatively low Infection Fatality Rates. However, his estimates do seem to have been borne out by the data.
This is his latest paper:
https://www.medrxiv.org/content/10.1101/2022.10.11...
Ioannidis et al said:
Across 31 systematically identified national seroprevalence studies in the pre-vaccination era, the median infection fatality rate of COVID-19 was estimated to be 0.035% for people aged 0-59 years people and 0.095% for those aged 0-69 years.
I last updated this spreadsheet, which is based on ONS data, in January 2022. PFR is the 'Population Fatality Rate'- The median IFR was 0.0003% at 0-19 years, 0.003% at 20-29 years, 0.011% at 30-39 years, 0.035% at 40-49 years, 0.129% at 50-59 years, and 0.501% at 60-69 years.
- At a global level, pre-vaccination IFR may have been as low as 0.03% and 0.07% for 0-59 and 0-69 year old people, respectively.
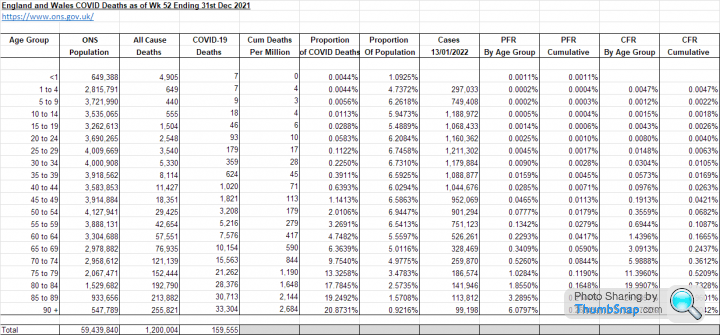
I calculated the PFR's for under 59's in England and Wales as 0.0279% and for under 69's as 0.059%
You might reasonably expect Population Fatality Rates to be 20-40% lower than Infection Fatality Rates depending on the proportion of each age group that had recovered from COVID at that point.
On that basis, Ioannidis' numbers check out very well. However, it remains unclear how much that IFR was dragged down by the following:
1. Herd immunity slowing transmission
2. Infection derived immunity
3. Vaccine derived immunity
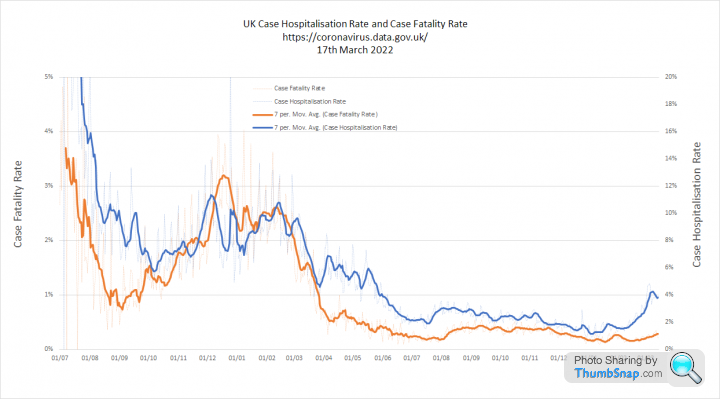
We know the Case Fatality Rate fell over time, so it follows that this was probably also the case for the IFR. This graph covers the period from July 2020 to March 2022:
In any event, it seems likely that the current IFR's for those under 70 in the UK are somewhere in the region Ioannidis has reported.
I would say that it depends on two things:
1. Where you fit in here
2. If you have already recovered from COVID
A booster now is going to stimulate an antibody response that should provide a small reduction in the risk of infection for a brief period of 8-10 weeks.
The benefits and risk of that should be clearly demonstrated to ensure informed consent.
I have already decided that I will not be having one.
Carl_Manchester said:
Biker 1 said:
Not been jabbed even once. I've had covid at least once, maybe twice. First bout was the dreaded delta this time last year.
I don't intend to get jabbed as I'm more concerned about the potential side effects.
Incidentally, the poster above mentioned many of his staff off with covid. How do they know? Are they actually purchasing test kits?
As an aside, I have spotted the test kits appearing in my local corner shops, in and amongst the counter paraphernalia, I bought a couple the other week when my little one came down with hand, foot and mouth. I don't intend to get jabbed as I'm more concerned about the potential side effects.
Incidentally, the poster above mentioned many of his staff off with covid. How do they know? Are they actually purchasing test kits?
As posted by various people in the forums, these new waves tend to start when the kids go back to school. I know for a fact that there's quite a large outbreak (of COVID) still happening in two hospitals in England, amongst staff and patients. My mum and dad caught it in one hospital, my mum survived it, my dad passed on Friday due to pneumonia caused by Covid.
They were both jabbed four/five times but as we know, these new variants go straight through the old jab formula, the new formula probably would have saved him and if the jabs caused heart problems, the ONS data would be more convincing.
I think the majority of people still have test kits knocking about having been given them by schools, work and vaccination clinics during the pandemic.
Unfortunately, the end result of it all is that we now have a new endemic disease, which will continue to cause problems for the elderly and vulnerable for a few more years at least.
Annual boosters, timed to coincide with the usual coronavirus season might help, but only a bit. The reality is that, as with any other virus, it was only ever about our immune systems.
RSTurboPaul said:
Please may I check - this graph is showing somewhere around 1-2% Case Fatality Rate for the 60-69 age range, but the quoted info in your other post from Ioannidis is that the Infection Fatality Rate is around 0.5% for the 60-69.
Is that down to confirmed cases (however that is defined...) being lower than actual infections, many of which won't get diagnosed?
I guess a lot then depends on how many cases are getting confirmed through testing, ergo the level of testing affects the CFRs?
So it would seem ironic if 'Project Moonshot' and similar actually make the illness look less serious, contrary to their 'narrative', because the massive amount of unnecessary testing effectively 'dilutes' the case rates that would normally have been seen?
A 'case' in terms of COVID is a positive test result. Is that down to confirmed cases (however that is defined...) being lower than actual infections, many of which won't get diagnosed?
I guess a lot then depends on how many cases are getting confirmed through testing, ergo the level of testing affects the CFRs?
So it would seem ironic if 'Project Moonshot'
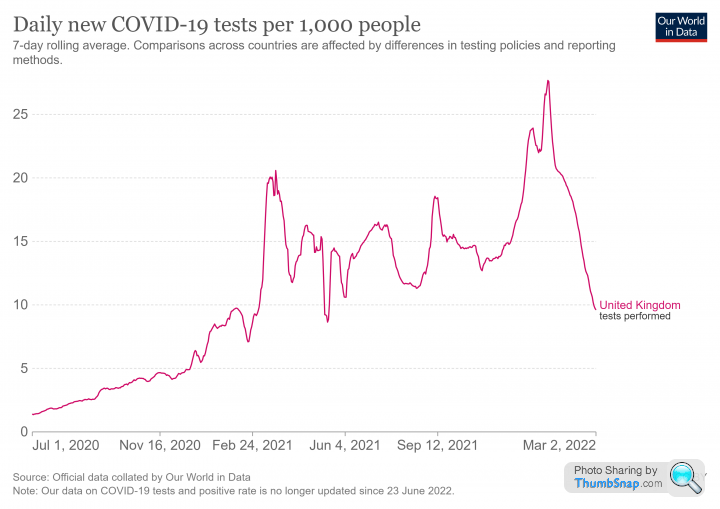
and similar actually make the illness look less serious, contrary to their 'narrative', because the massive amount of unnecessary testing effectively 'dilutes' the case rates that would normally have been seen?As you say the CFR should always be higher than the IFR, because you will never capture every case.
The proportion of cases identified is the Case Ascertainment Rate. Up to a certain point this is obviously influenced by testing capacity. So the early data, when we tested very few people is useless. The CFR is ridiculously high.
This shows that the CFR rose after Sept 2020 as testing ramped up, which is the opposite of what you might expect. Then, through the first half of 2021, during the period of mass vaccination, the CFR fell consistently, whilst tests remained high.
After this point, the CFR does not seem to be impacted by testing levels.
(edited to align end date on 2nd graph)
Edited by Elysium on Thursday 20th October 08:18
Gassing Station | News, Politics & Economics | Top of Page | What's New | My Stuff