Preparing hard workers for a future of tax paying...
Discussion


turbobloke said:
NoelWatson said:
turbobloke said:
Not sure what you mean by "so taking your sloping line, why is it that we haven't we dropped below it".
A best-fit line with data like that has points above and below the line. This one does, so what does your question refer to?
I'm saying that if we are now at the bottom of the cycle, your gradient needs to be a lot steeper as we should've spent some time under the trend. I dug up some data today - will post tomorrow.A best-fit line with data like that has points above and below the line. This one does, so what does your question refer to?
Even with the rough and ready eye method, a best-fit line is drawn mindful of the data plotted, not some individual opinion/interpretation or past/future considerations.
You seem fixated with interpretation based on individual opinion (yours or similar). I explain very clearly in each post what it is I'm saying yet you manage to go beyond or around it and sometimes invent new points to argue against that I've never said.
So, to try again: I fail to see what meaning there is attached to "we should've spent some time under the trend". Who is we? The data points represent some sort of average, of house price and of earnings over time. There are several points on the curve under the line I hastily sketched and several above. Many points both ways, as it happens, which is what anybody who has drawn a few thousand best-fit lines by hand - or some automated method or other - would expect. On that basis your question has no meaning to me.
cymtriks said:
Simple solution:
If you're of working age and not employed then you must attend a jobseekers office 9-5 five days a week to get benefits. Don't turn up, don't get paid.
There will be an on site team of secretaries to help with CVs and a creche. You'll be able to practice mock interviews. Reps from local businesses will come to talk about the jobs they offer. The forces will come along as well. It will be illegal not to advertise jobs on their database for any company employing more than five people.
State projects like ditch and footpath clearing will be on offer.
Sit and stare out of the window if you want but you'll do that until you are 65. No one will care if you apply for no jobs, you'll just sit there.
Anyone who wanted to work would probably value all the help on offer, note that this isn't intended to be a punishment unless you make it one.
I'd sign up for that. Could you make local councils have to tell me when they have given a job I have applied for and followed up twice to someone else as well?If you're of working age and not employed then you must attend a jobseekers office 9-5 five days a week to get benefits. Don't turn up, don't get paid.
There will be an on site team of secretaries to help with CVs and a creche. You'll be able to practice mock interviews. Reps from local businesses will come to talk about the jobs they offer. The forces will come along as well. It will be illegal not to advertise jobs on their database for any company employing more than five people.
State projects like ditch and footpath clearing will be on offer.
Sit and stare out of the window if you want but you'll do that until you are 65. No one will care if you apply for no jobs, you'll just sit there.
Anyone who wanted to work would probably value all the help on offer, note that this isn't intended to be a punishment unless you make it one.
NoelWatson said:
NoelWatson said:
I have another factor. That 46% of people do not have any money left at the end of the month because they have overstretched themselves to buy overvalued housing. I think that will be the overriding factor
This is a short term crisis, the factors I've stated will take a generation to work through.NoelWatson said:
cymtriks said:
so the outlook is therefore very expensive homes
http://www.telegraph.co.uk/finance/personalfinance/7934593/Mini-property-boom-is-over-amid-concerns-about-double-dip-recession.htmlcymtriks said:
This is a short term crisis
Before we continue, can you run me through this pleaseExplain that that a "dip" or even "double dip" recession is just that, a dip, not some decade long event?
Explain how some factors affect long term trends while others affect short term trends?
Seriously, are you trying to make some kind of point? Why do you question supply and demand? Why do you argue with factors that affect short term and long term trends by trying to make out that, somehow, they don't?
The basics are as follows:
- Various factors have affected demand, both short term and long term, many of these are staggeringly obvious (divorce, more singles, immigration, etc).
- Various factors have affected supply, both short term and long term, many of these are staggeringly obvious (land availability, environmental ceoncerns, planning restrictions, etc).
- interest rates and lending criteria have changed as interest rates have fallen and steadied compared to previous decades.
- The effect is not linear, even slowly moving influences can suddenly reach a tipping point, see my earlier post on 99 people and 100 homes versus 100 people and 99 homes, the former gaurantees an unhapy seller, the later gaurantees an unhappy buyer yet the numbers have barely changed.
- The long term trend is therefore very expensive homes, this might not be reflected in the price, but some cost will rise to make the total higher than ever.
NoelWatson said:
turbobloke said:
NoelWatson said:
turbobloke said:
Not sure what you mean by "so taking your sloping line, why is it that we haven't we dropped below it".
A best-fit line with data like that has points above and below the line. This one does, so what does your question refer to?
I'm saying that if we are now at the bottom of the cycle, your gradient needs to be a lot steeper as we should've spent some time under the trend. I dug up some data today - will post tomorrow.A best-fit line with data like that has points above and below the line. This one does, so what does your question refer to?
Even with the rough and ready eye method, a best-fit line is drawn mindful of the data plotted, not some individual opinion/interpretation or past/future considerations.
You seem fixated with interpretation based on individual opinion (yours or similar). I explain very clearly in each post what it is I'm saying yet you manage to go beyond or around it and sometimes invent new points to argue against that I've never said.
So, to try again: I fail to see what meaning there is attached to "we should've spent some time under the trend". Who is we? The data points represent some sort of average, of house price and of earnings over time. There are several points on the curve under the line I hastily sketched and several above. Many points both ways, as it happens, which is what anybody who has drawn a few thousand best-fit lines by hand - or some automated method or other - would expect. On that basis your question has no meaning to me.
What the heck is all this "if" we're at the bottom of a trend and "likely that" we would've undershot whatever?
It's just handwaving interpretive opinion and none of that has ANY influence whatsoever on how a best fit line is drawn on the data, by eye or using some more sophisticated technique.
cymtriks said:
Why is any of this not obvious?
Because none of these factors were present pre 2000. Sorry for being so simplistic. We have had an unprecendented credit bubble people jumped on the bnadwagon, 46% of mortgage holders are left with either zero or negative money at the end of every month because they were desperate to become part of it. Paying off this debt will be an overriding long term trend.Edited by NoelWatson on Wednesday 11th August 20:16
cymtriks said:
NoelWatson said:
Before we continue, can you run me through this please
Err, run you through supply and demand?Explain that that a "dip" or even "double dip" recession is just that, a dip, not some decade long event?
Explain how some factors affect long term trends while others affect short term trends?
.
.
.
Why is any of this not obvious?
Having read your recent posts, I could see what you were saying without needing the dots joined. Whether I agreed or not is sort-of immaterial, but it made sense to me anyway.
I also share your apparent concerns over the nature of some replies, both content and motive.
It's getting tedious responding to posts that ignore points made, reply to points not made, etc and if the seemingly deliberate misunderstandings continue then for my part I'll have to do some work.
turbobloke said:
cymtriks said:
NoelWatson said:
Before we continue, can you run me through this please
Err, run you through supply and demand?Explain that that a "dip" or even "double dip" recession is just that, a dip, not some decade long event?
Explain how some factors affect long term trends while others affect short term trends?
.
.
.
Why is any of this not obvious?
Having read your recent posts, I could see what you were saying without needing the dots joined. Whether I agreed or not is sort-of immaterial, but it made sense to me anyway.
I also share your apparent concerns over the nature of some replies, both content and motive.
It's getting tedious responding to posts that ignore points made, reply to points not made, etc and if the seemingly deliberate misunderstandings continue then for my part I'll have to do some work.
 ks about motive. You have your views, I have mine.
 NoelWatson said:
46% of mortgage holders are left with either zero or negative money at the end of every month because they were desperate to become part of it. Paying off this debt will be an overriding long term trend.
Is that true?. Thats very scary if it is. Sort of puts things into perspective. Can anyone find that recent quote of what % of mortgages are interest only?, was gobsmackingly high. markcoznottz said:
NoelWatson said:
46% of mortgage holders are left with either zero or negative money at the end of every month because they were desperate to become part of it. Paying off this debt will be an overriding long term trend.
Is that true?. Thats very scary if it is. Sort of puts things into perspective. Can anyone find that recent quote of what % of mortgages are interest only?, was gobsmackingly high. NoelWatson said:
markcoznottz said:
NoelWatson said:
46% of mortgage holders are left with either zero or negative money at the end of every month because they were desperate to become part of it. Paying off this debt will be an overriding long term trend.
Is that true?. Thats very scary if it is. Sort of puts things into perspective. Can anyone find that recent quote of what % of mortgages are interest only?, was gobsmackingly high. Mortgage holders are not anywhere near 100% of the market so its impact is lower than you are suggesting. FTB segments have always made sacrifice for their first purchases. I know people that scrimped and saved for 5 years before they could start spending. Its nothing new. Inflation is up, affordability for the next few years will be great. Stop being such a doom munger all the time.
rich1231 said:
NoelWatson said:
markcoznottz said:
NoelWatson said:
46% of mortgage holders are left with either zero or negative money at the end of every month because they were desperate to become part of it. Paying off this debt will be an overriding long term trend.
Is that true?. Thats very scary if it is. Sort of puts things into perspective. Can anyone find that recent quote of what % of mortgages are interest only?, was gobsmackingly high. Mortgage holders are not anywhere near 100% of the market so its impact is lower than you are suggesting. FTB segments have always made sacrifice for their first purchases. I know people that scrimped and saved for 5 years before they could start spending. Its nothing new. Inflation is up, affordability for the next few years will be great. Stop being such a doom munger all the time.
NoelWatson said:
cymtriks said:
Why is any of this not obvious?
Because none of these factors were present pre 2000.
Immigration, divorce, singles, planning laws, environmental concerns, etc...
NoelWatson said:
Sorry for being so simplistic. We have had an unprecendented credit bubble people jumped on the bnadwagon, 46% of mortgage holders are left with either zero or negative money at the end of every month because they were desperate to become part of it. Paying off this debt will be an overriding long term trend.
People will pay it down, inherit, go bankrupt (discharged from debt), inflation will eat up the debt. There is no reason to suppose that this is game changing.Remember that many mortgage holders were in the same situation in the now long forgotten early nineties.
The debt is big but isn't going to be as influential as the trends I've mentioned. The debt will pass, the issues I mentioned have been steadily rising for half a century.
Twincam16 said:
fbrs said:
Twincam16 said:
And as a result, in order to prevent repossession and negative equity, these people had a vested interest in the value of their house continuing to rise exponentially, as did the market.
they have a vested interest true, but that doesnt change the price. i have a vested interest in my house being worth 1bn quid, but it isnt. the price of anything is determined by buyers just as much as sellers; buyers have a vested interest in it being free. 'the market' most evidently had a vested interest in us house prices to and look what happened there. your understanding of free markets makes no senseEdited by fbrs on Friday 6th August 14:50
We're now reaping the consequences of that failed economic model. I feel the new one will have to include more affordable houses.
I think supply and demand of mortgage credit had far more influence on house prices than the physical supply of houses.
As soon as it became possible to borrow 4x or 5x salary (instead of 2x or 2.5x salary, like the good old days) then prices were always going to increase dramatically.
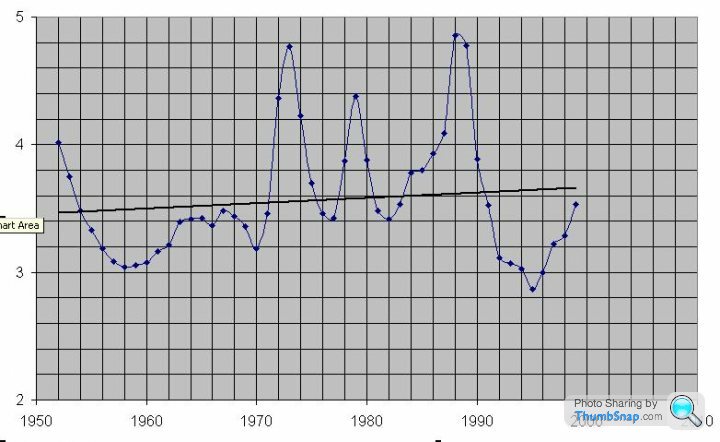
So apart from fear and greed getting in the way as unemployment and hubris track the economic cycle, there is a steady rise as shown by the line drawn on that data.
Call it crazy but that might just be the impact of the steady rises cymtriks refers to, caused by the factors they and others cite, steadily operating under the froth of bonus hormones a cloud of credit and P45 litter. Who knows.
As to my view, I rarely state it, I just ask a few questions now and then to query assumptions and seek detail. This is apparently not acceptable or if it is what comes back rarely relates to the point(s) made.
It was probably a good move to do 90 mins work - I'll do some more now.
on another thread it was said:
short term treds will continue to follow short term supply and demand, long term trends will continue to follow long term supply and demand, just like it ever was
That says the same thing I just said and it fits with NW's plot afaics. One is the underlying long-term trend as shown by the line, the other is the flapping about with peaks and troughs as people visit housepricecrash.com for the first time  giving the shorter term structure (the real reasons being on this and the other thread in many posts).
turbobloke said:
So apart from fear and greed getting in the way as unemployment and hubris track the economic cycle, there is a steady rise as shown by the line drawn on that data.
Call it crazy but that might just be the impact of the steady rises cymtriks refers to, caused by the factors they and others cite, steadily operating under the froth of bonus hormones a cloud of credit and P45 litter. Who knows.
As to my view, I rarely state it, I just ask a few questions now and then to query assumptions and seek detail. This is apparently not acceptable or if it is what comes back rarely relates to the point(s) made.
It was probably a good move to do 90 mins work - I'll do some more now.
TB, I do not dispute that there is a steady increase (assuming the data I pulled yesterday is correct). However, my point all along has been that we are still way over that long term trend line, so why are we not expecting something similar along the lines Call it crazy but that might just be the impact of the steady rises cymtriks refers to, caused by the factors they and others cite, steadily operating under the froth of bonus hormones a cloud of credit and P45 litter. Who knows.
As to my view, I rarely state it, I just ask a few questions now and then to query assumptions and seek detail. This is apparently not acceptable or if it is what comes back rarely relates to the point(s) made.
It was probably a good move to do 90 mins work - I'll do some more now.

P.S. I got my historical data from here
http://www.measuringworth.org/datasets/ukearncpi/r...
http://www.nationwide.co.uk/hpi/downloads/UK_house...
Edited by NoelWatson on Thursday 12th August 08:15
What is this long term trend?
It's only available from the data and your curve wanders off because of opinion not because of data. A best fit line fits data it doesn't look at crystal balls.
I suspect this notion of "long term average" which seems to come from that original wavy chart with a horizontal line on it labelled "long term average" (not the one you just drew) but it doesn't look like a long term average at all it looks like somebody has decided that 4x average salary is an absolute immovable but fundamentally arbitrary affordability level and drawn a line horizontally for that reason, not because it fits the data. Then you seem to have been seduced by the fact that although data has a best fit line that's not horizontal it should for some magical reason force the data back to that level.
WHich is opinion of the crystal ball variety, my point has never had anything to do with that, it was all about the fact that the horizontal line labelled "long term average" did not fit the data and was misleadingly labelled. It's an arbitrary affordability level and nothing more than that i.e. the original chartmaker's opinion.
turbobloke said:
What is this long term trend?
It's only available from the data and your curve wanders off because of opinion not because of data. A best fit line fits data it doesn't look at crystal balls.
I suspect this notion of "long term average" which seems to come from that original wavy chart with a horizontal line on it labelled "long term average" (not the one you just drew) but it doesn't look like a long term average at all it looks like somebody has decided that 4x average salary is an absolute immovable but fundamentally arbitrary affordability level and drawn a line horizontally for that reason, not because it fits the data. Then you seem to have been seduced by the fact that although data has a best fit line that's not horizontal it should for some magical reason force the data back to that level.
WHich is opinion of the crystal ball variety, my point has never had anything to do with that, it was all about the fact that the horizontal line labelled "long term average" did not fit the data and was misleadingly labelled. It's an arbitrary affordability level and nothing more than that i.e. the original chartmaker's opinion.
This goes back to the original question. What has changed over the last decade that makes house prices at a multiple of >5 when they have averaged <4 over the preceding 50 years.It's only available from the data and your curve wanders off because of opinion not because of data. A best fit line fits data it doesn't look at crystal balls.
I suspect this notion of "long term average" which seems to come from that original wavy chart with a horizontal line on it labelled "long term average" (not the one you just drew) but it doesn't look like a long term average at all it looks like somebody has decided that 4x average salary is an absolute immovable but fundamentally arbitrary affordability level and drawn a line horizontally for that reason, not because it fits the data. Then you seem to have been seduced by the fact that although data has a best fit line that's not horizontal it should for some magical reason force the data back to that level.
WHich is opinion of the crystal ball variety, my point has never had anything to do with that, it was all about the fact that the horizontal line labelled "long term average" did not fit the data and was misleadingly labelled. It's an arbitrary affordability level and nothing more than that i.e. the original chartmaker's opinion.
Gassing Station | News, Politics & Economics | Top of Page | What's New | My Stuff