Stock market is a "fully-fledged epic bubble" and will burst
Discussion


bmwmike said:
So what's everyone doing - everyone sold out into cash and sit it out then? Or rebalancing? Or nothing and keep buying?
Curious to know what some of our resident professional IFA's are doing in terms of their own pots such as SIPP or perhaps ISA's?
Pension - did move some more into global index funds but about 10% of totalCurious to know what some of our resident professional IFA's are doing in terms of their own pots such as SIPP or perhaps ISA's?
Kept back half of this years ISA as cash in the ISA (the other half was "invested" straight in unfortunately again global trackers but also IME and IMT. At present feeding in cash in the ISA each 4 or 5 or so days as things drop.
Increased pension contributions once a month to hopefully feed in during this turmoil.
rdjohn said:
I was in my 30s when I was speaking with an experienced fund manager in 1986 just after Big-Bang. He went on-and-on about how the 1970s were so very difficult. The only thing they had in the office were basic adding machines, or, if lucky a Sinclair calculator. They simply read the FT and thought “ Oh s t” In 1986, he had a flashy computer (no Windows) and thought he knew everything.
Of course in October 1987, Black Friday happened and he still thought “Oh” we did not see that coming. ....
t” In 1986, he had a flashy computer (no Windows) and thought he knew everything.Of course in October 1987, Black Friday happened and he still thought “Oh” we did not see that coming. ....
I was a novice in 1987, so did not see that coming either, but it did not matter because I did not panic.
Looking back though, it was unprofessional for 'an experienced fund manager', to make that comment (leaving aside his main job of increasing fee income).
The market rise during 1987, prior to that crash, was enormous. That was one obvious clue he overlooked.
There was a week of panic, but followed promptly by a strong recovery.
By the end of 1987, for anyone who held throughout that year;
FTSE 100 ... = +2.0% (Total Return = +6.2%)
All-Share .... = +4.5% (Total Return = +8.44%)
Enormous panic, but turned out out to be no big deal, for those who stayed in the market continually.
That (very serious at the time) crash, only shows as a tiny blip on charts now.
Joey Deacon said:
the stock market has effectively been turned into a casino, mostly due to the massive increase in value of technology stocks, often based on nothing at all.
It is clear that all the money printed during the pandemic to try and control an uncontrollable virus is a large part of what has caused this. Trouble is what do you do with your money, the other issue is that inflation is eroding it at 10% even if you decide to hold cash.
You sure this isn't an investor problem, rather than an investment problem? No one forced anyone to buy a particular subset of the market. Looking at things on a global scale and I'm not sure I see the "casino" It is clear that all the money printed during the pandemic to try and control an uncontrollable virus is a large part of what has caused this. Trouble is what do you do with your money, the other issue is that inflation is eroding it at 10% even if you decide to hold cash.
Jon39 said:
rdjohn said:
I was in my 30s when I was speaking with an experienced fund manager in 1986 just after Big-Bang. He went on-and-on about how the 1970s were so very difficult. The only thing they had in the office were basic adding machines, or, if lucky a Sinclair calculator. They simply read the FT and thought “ Oh st” In 1986, he had a flashy computer (no Windows) and thought he knew everything.
Of course in October 1987, Black Friday happened and he still thought “Oh” we did not see that coming. ....
t” In 1986, he had a flashy computer (no Windows) and thought he knew everything.Of course in October 1987, Black Friday happened and he still thought “Oh” we did not see that coming. ....
I was a novice in 1987, so did not see that coming either, but it did not matter because I did not panic.
Looking back though, it was unprofessional for 'an experienced fund manager', to make that comment (leaving aside his main job of increasing fee income).
The market rise during 1987, prior to that crash, was enormous. That was one obvious clue he overlooked.
There was a week of panic, but followed promptly by a strong recovery.
By the end of 1987, for anyone who held throughout that year;
FTSE 100 ... = +2.0% (Total Return = +6.2%)
All-Share .... = +4.5% (Total Return = +8.44%)
Enormous panic, but turned out out to be no big deal, for those who stayed in the market continually.
That (very serious at the time) crash, only shows as a tiny blip on charts now.
Your thoughts are sobering. It puts things into perspective. It does seem like a blip compared to the last decade and a half.
Derek Chevalier said:
speedy_thrills said:
Mr Whippy said:
I’d expected a stronger dead cat bounce but it just seems to be going worse to worse.
I expect a regression to the underlying trend.I mean ultimately all markets, that's how regression works of course.

Joey Deacon said:
speedy_thrills said:
Cash and Australasian banks mostly.
My main hope from this is this is the last time we hear "crypto" or "ESG" for a very long time.
Yes, be very nice if we never hear from the Crypto and Forex YouTubers convincing people that they can get rich by not doing very much. I think this is half the problem, the stock market has effectively been turned into a casino, mostly due to the massive increase in value of technology stocks, often based on nothing at all.My main hope from this is this is the last time we hear "crypto" or "ESG" for a very long time.
It is clear that all the money printed during the pandemic to try and control an uncontrollable virus is a large part of what has caused this. Trouble is what do you do with your money, the other issue is that inflation is eroding it at 10% even if you decide to hold cash.
Edited by speedy_thrills on Thursday 12th May 14:03
speedy_thrills said:
S&P500 long term trend.
I mean ultimately all markets, that's how regression works of course.
For some reason there seems to be a focus on the S&P 500, and in particular the large-cap growth stocks within it. While I'm sure this is unrelated to the fact they had, until recently, performed well I mean ultimately all markets, that's how regression works of course.
 , there are many other markets out there.
 Have a look at the relative valuations in the JP Morgan guide to the markets - not everything is expensive (however you might define it).
Phooey said:
Derek Chevalier said:
Have a look at the relative valuations in the JP Morgan guide to the markets - not everything is expensive (however you might define it).
Which market/s or sectors do you think are not expensive (fair value?) at the moment?Phooey said:
Seeing as S&P500 (current P/E 20ish i think) is getting a mention atm, is there a chart somewhere that shows it's P/E during downturns or crashes?
Not sure of source quality, but there are several alternatives out there. Single-digit is not unheard of.https://www.multpl.com/s-p-500-pe-ratio/table/by-y...
Derek Chevalier said:
Not sure of source quality, but there are several alternatives out there. Single-digit is not unheard of.
https://www.multpl.com/s-p-500-pe-ratio/table/by-y...
Bloody hell was 2009 (70.91) a typo!https://www.multpl.com/s-p-500-pe-ratio/table/by-y...
Looking at today we don't seem too far above average.. although will be a big drop if we go to single digits. Is PE a crude measure when we look at the businesses today vs say 50yrs ago, increased population etc?
Handy chart though - thank you

Derek Chevalier said:
Could you save me the hassle.. bit much to take in 
Phooey said:
Seeing as S&P500 (current P/E 20ish i think) is getting a mention atm, is there a chart somewhere that shows it's P/E during downturns or crashes?
For the S&P500, recessions greyed out: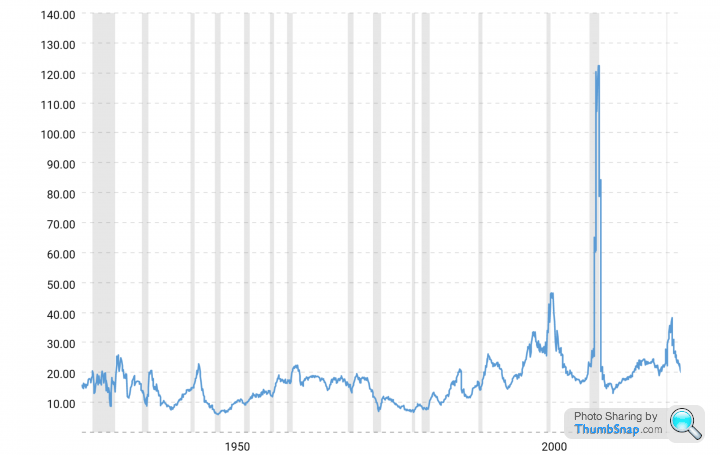
Earnings can be really variable over one year though, Shiller CAPE uses the previous 10 years of earnings:
https://www.multpl.com/shiller-pe
Here is some background on the measure and why it's popular.
Given that a lot of my investments are taking a hammering I did an excercise yesterday evening the result of which was a surprise.
I took out a 15 year investment plan with Skandia Life making monthly contributions starting in 2002. Taking 2 of the funds I chose, the Inv Perpetual High Income and Smaller Companies, the prices were as follows:
Highest price prior to credit crunch - 19/7/07 (both funds)
Date they hit lowest price after credit crunch - 9/3/09 (High Income - down 32.8% from high) 20/3/09 (Sm Comp - down 46.7% from high)
Date when they reached 2007 high figures again - 9/1/12 (High Inc) 1/3/12 (Sm Comp)
4 and half years to recover to previous high.
But it illustrates the benefits of pound cost averaging as I contributed each month.
lockhart flawse said:
Given that a lot of my investments are taking a hammering I did an excercise yesterday evening the result of which was a surprise.
I took out a 15 year investment plan with Skandia Life making monthly contributions starting in 2002. Taking 2 of the funds I chose, the Inv Perpetual High Income and Smaller Companies, the prices were as follows:
Highest price prior to credit crunch - 19/7/07 (both funds)
Date they hit lowest price after credit crunch - 9/3/09 (High Income - down 32.8% from high) 20/3/09 (Sm Comp - down 46.7% from high)
Date when they reached 2007 high figures again - 9/1/12 (High Inc) 1/3/12 (Sm Comp)
4 and half years to recover to previous high.
But it illustrates the benefits of pound cost averaging as I contributed each month.
And presumably you did well after the 4.5 years as you'd bought more for your £ during the low years. If you hadn't had the low period, you would have less overall units, and a lower outcome because you'd been buying at a higher price for longer. Its why i'm still buying tech stocks too. Maybe they'll take 5 years to recover, but i buy them for the AWS/Azure/GCP mostly, and those are what new business are built on, so i'm quite optimistic in this area and the only times i've lost money is when i've sold.I took out a 15 year investment plan with Skandia Life making monthly contributions starting in 2002. Taking 2 of the funds I chose, the Inv Perpetual High Income and Smaller Companies, the prices were as follows:
Highest price prior to credit crunch - 19/7/07 (both funds)
Date they hit lowest price after credit crunch - 9/3/09 (High Income - down 32.8% from high) 20/3/09 (Sm Comp - down 46.7% from high)
Date when they reached 2007 high figures again - 9/1/12 (High Inc) 1/3/12 (Sm Comp)
4 and half years to recover to previous high.
But it illustrates the benefits of pound cost averaging as I contributed each month.
speedy_thrills said:
For the S&P500, recessions greyed out:
Earnings can be really variable over one year though, Shiller CAPE uses the previous 10 years of earnings:
https://www.multpl.com/shiller-pe
Here is some background on the measure and why it's popular.
Thank you Earnings can be really variable over one year though, Shiller CAPE uses the previous 10 years of earnings:
https://www.multpl.com/shiller-pe
Here is some background on the measure and why it's popular.

Phooey said:
Derek Chevalier said:
Could you save me the hassle.. bit much to take in https://www.youtube.com/watch?v=jjWmaRKmnEA
There are two options discussed, both low cost and globally diversified.
1. Portfolio comprised of just plain vanilla indices
2. Portfolio comprised of plain vanilla indices with tilts to small-cap and value shares
Many investors have done the exact opposite of what has historically worked over the longer term - i.e piled into large-cap growth

lockhart flawse said:
Given that a lot of my investments are taking a hammering I did an excercise yesterday evening the result of which was a surprise.
I took out a 15 year investment plan with Skandia Life making monthly contributions starting in 2002. Taking 2 of the funds I chose, the Inv Perpetual High Income and Smaller Companies, the prices were as follows:
Highest price prior to credit crunch - 19/7/07 (both funds)
Date they hit lowest price after credit crunch
- 9/3/09 (High Income - down 32.8% from high)
- 20/3/09 (Sm Comp - down 46.7% from high)
Date when they reached 2007 high figures again
- 9/1/12 (High Inc)
-1/3/12 (Sm Comp)
4 and half years to recover to previous high.
But it illustrates the benefits of pound cost averaging as I contributed each month.
The 2008 crash was an interesting, but extremely worrying event.
A very long time, since queues of people outside banks, attempting to withdraw their money, had last been seen in the UK.
Your percentage falls were slightly better than the average (red line) although that does not take income into account. Many companies did manage to keep dividends flowing during that crash (unlike the pandemic)
The chart does not go far enough forward, but 4½ years to recover was a long time.
We all like talking about wanting markets to go up, but having less of a fall than average during a downturn, is of equal importance.
In car terms, you can then begin the next stock market phase, one lap in the lead, making it far quicker to recover the percentage fall.
Monthly contributions obviously average out purchases, although as the fund builds, each payment would/should gradually represent a smaller proportion of the total fund value. Therefore might not help overall as much, when a fund value falls this far.
However, 2007 / 2009 was one of the extreme crashes. Probably have to go back to 1974 for a bigger decline.

Gassing Station | Finance | Top of Page | What's New | My Stuff